Introduction
OpsRamp Health Status page is a single-window-solution to monitor all related services. Using the Health page, you can monitor the latest information about the availability status of all the related services, view incidents, and subscribe for updates.
Accessing Health page
To access the Health Status page, from the top bar of OpsRamp Console simply click Health to directly view the status of your POD or else from any web browser, open https://health.opsramp.com/ to view the status of all PODs.
The Health Status page helps you to,
- Access dashboard to view the health status of all PODs.
- Access your POD to view specific details and subscribe for updates.
Access Dashboard
From the Health page dashboard,
- Monitor the availability status of PODs. For every POD, you can view the following details:
- Latest response time
- Average response time of the last 7 days
- Uptime in the last 7 days
- Uptime in the last 30 days
- Status of the user interface, API, and Connection
- Search a domain or URL.
- View list of Open incidents.
- View details about scheduled maintenances.
Monitor POD-specific information and subscribe for updates
From the dashboard, click the name of the desired POD. From the POD-specific page, do the following:
- Search for a domain or URL
- Subscribe for updates to get email notification when OpsRamp creates, updates, or resolves an incident.
- Monitor the health status of services.
- View incidents.
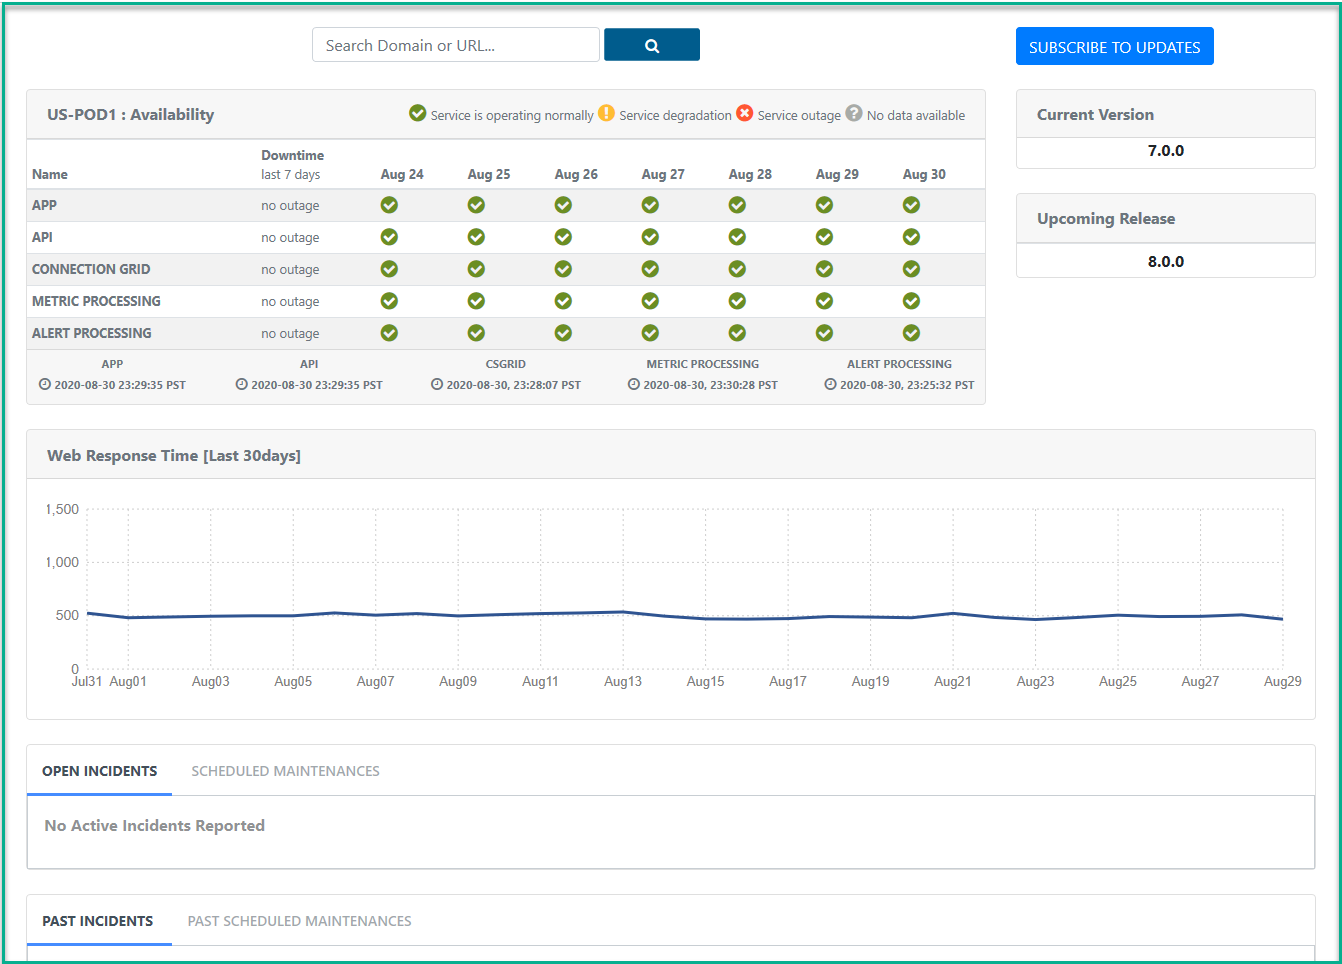
The following details of the selected POD are displayed:
- Availability status of all the related services for the last 7 days. For example, APP, API, Metric Processing, Alert Processing, and Connection Grid.
- Web response time for the last 30 days.
- List of Open Incidents and Scheduled Maintenances.
- List of Past Incidents and Past Scheduled Maintenances.
- View current and upcoming versions of OpsRamp.