Release Date: September 2020
Dashboards and User Interface
Improved look and task flows for Setup pages
Login, account, user management and Setup pages now have an improved look and feel with simplified task flows. These enhancements reduce the number of steps and clicks necessary to navigate the platform efficiently while also providing enhanced visualization.
Improved look and task flows for Setup pages
Improved widget selection for dashboards
Selecting new widgets is now easier with a new palette of commonly used widgets. This visualization makes selecting widgets easier and more transparent.
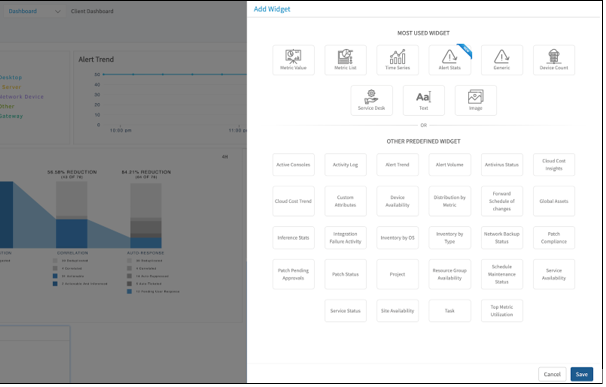
Improved widget selection for dashboards
New alert statistics widget
The alert statistics widget shows alert’s volume reduction by each stage in OpsRamp’s alert processing pipeline. This widget provides a real-time view of how the machine learning models reduce alert noise.
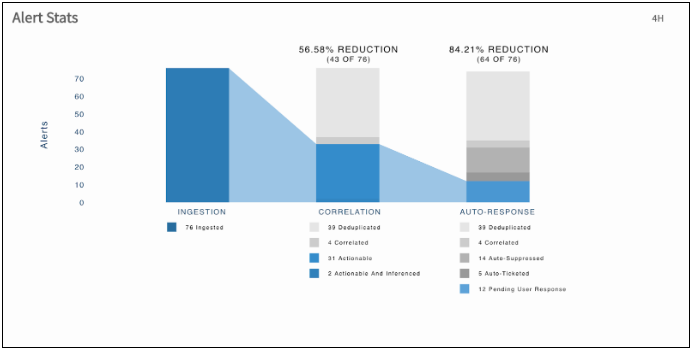
New alert statistics widget
Agent and Gateway description in UI
OpsRamp Agent and OpsRamp Gateway are now renamed to Agent and Gateway, respectively, in UI.
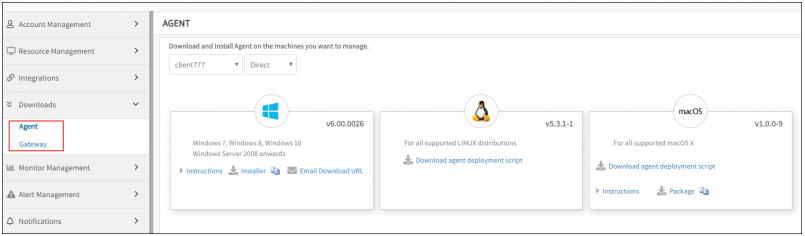
Agent and Gateway description in UI
Update client logo within Client Details
You can now update a client’s logo within the Client Details page.
Update client logo within Client Details
Module to enable/disable remote consoles
You can now enable or disable the remote console module for specific client accounts. This option allows you to selectively disable this feature for environments that have stringent remote access requirements.
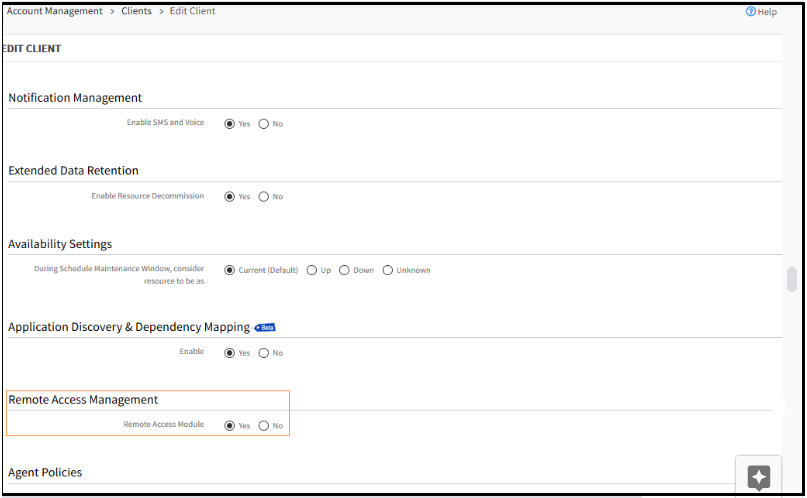
Module to enable/disable remote consoles
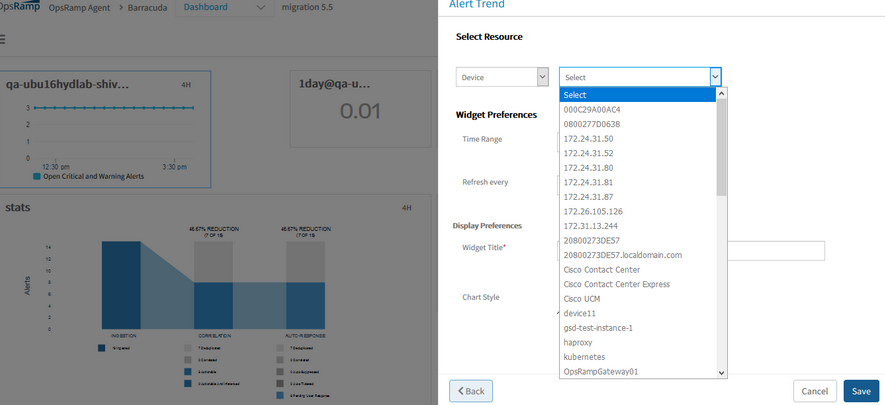
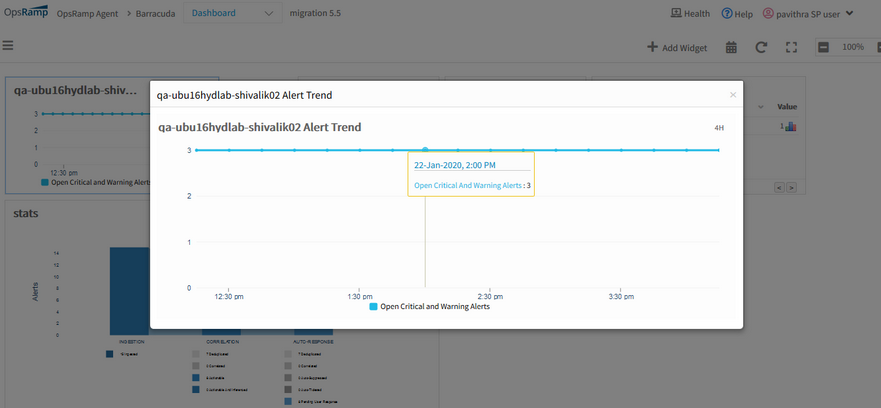
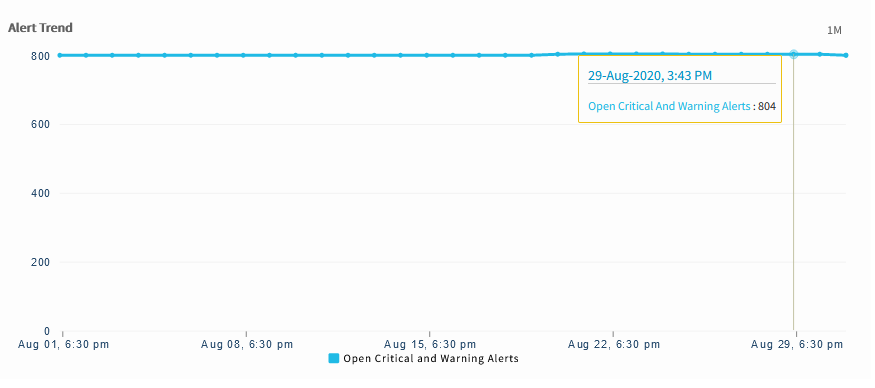
Resource selection provided in Alert Trend widget at client level
The widget will render the critical and warning alerts count of the selected device.
In partner level, it is same as the existing one as resource selection is not applicable for partner.
Resource selection provided in Alert Trend widget at client level
Resource selection provided in Alert Trend widget at client level
Resource selection is displayed only at client level trend widget.
If any resource has been selected, widget renders according to the selected resource.
While showing the count, the cumulative count of the previous open alerts along with the alerts count in the selected time range are displayed.
In case nothing is selected in the Select Resource dropdown list, it will render the critical and warning alerts count for the client.
Resource selection provided in Alert Trend widget at client level
Introduced “All” option to address all the Active and InActive values
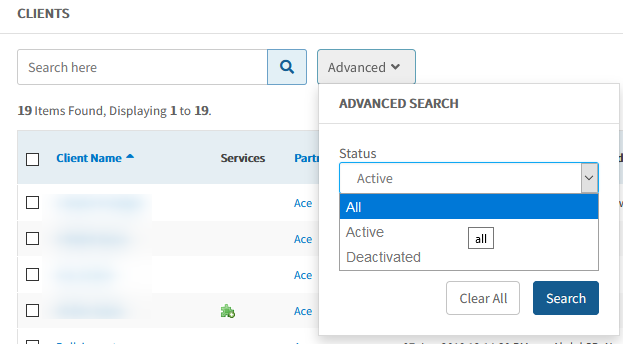
Introduced “All” option to address all the Active and InActive values
For partner, client and user listing, “All” option has been introduced in the dropdown of the listing page, which shows all the Active and Inactive values together.
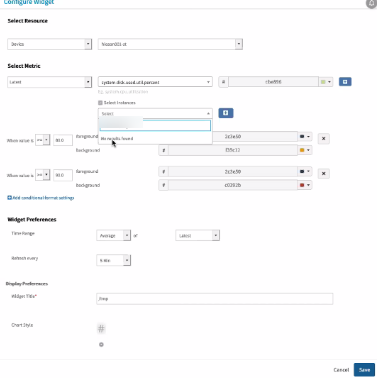
Enhancements to Time series widget
Allows the user to select specific devices within the selected group, to be displayed in the time series widget.
Earlier, if the user selects a specific group, it could not select specific devices within that group
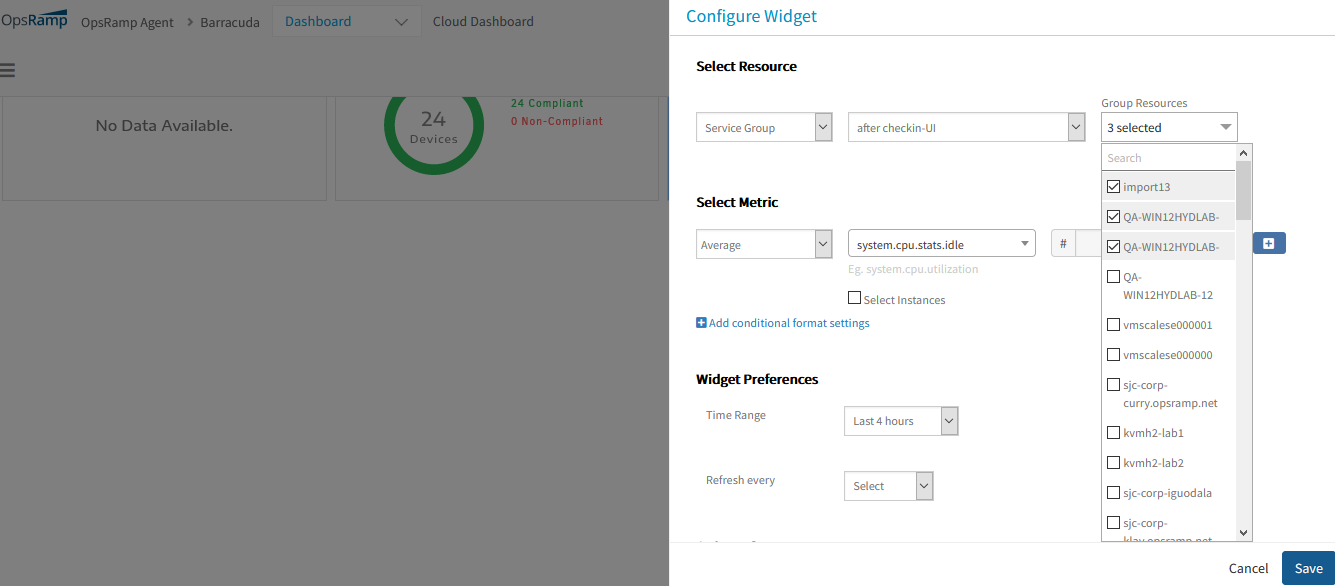
Enhancements to Time series widget
Also, all the resources are shown as a list in the configure widget window.
Regex issue – Log file monitor for Linux server
After the user inputs the Regex for the Log file monitor, the monitor continues to load. The setting does not reflect to the Log file monitor.
Issue is fixed. Regex of 300 characters long (that is, >255) is working perfectly.
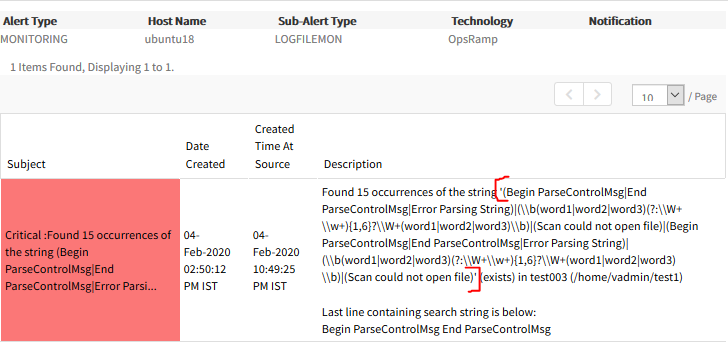
Regex issue – Log file monitor for Linux server
Graph title font size issue
Increase in Font Size is throwing off the ability to see the entire graph name.
Graph title font size issue
Increase in font size in h2 tag had increased it across all the widgets which caused in message truncation.
Reverted to small size and fixed the issue.
The graphs names and widget names are visible properly.
Instances not populating or allowed to be updated on Metric Value Widgets
Widgets are not populating instances when typing instance under metric widget value.
Instances not populating or allowed to be updated on Metric Value Widgets
Passing metric group instead of metric name as request parameter while loading instances so this issue.
Changed request parameter from metricgroup to metricname.
Issue is fixed. Instances are populating properly when typing the instance under metric widget value.
Delay in enabling an interface as a WAN link
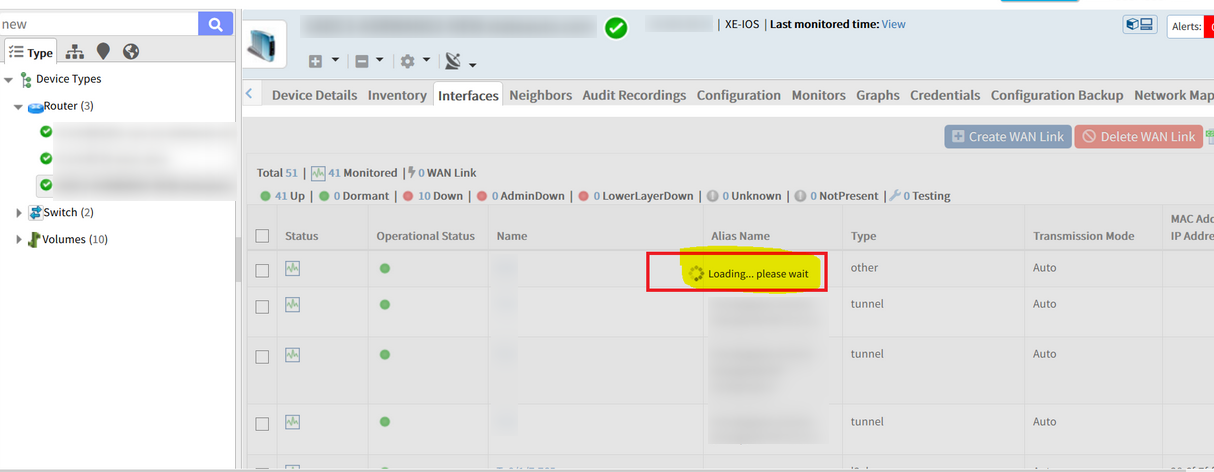
Delay in enabling an interface as a WAN link
Issue is fixed. Able to create WAN links.
Kubernetes (K8s) container count mismatch is observed in UI
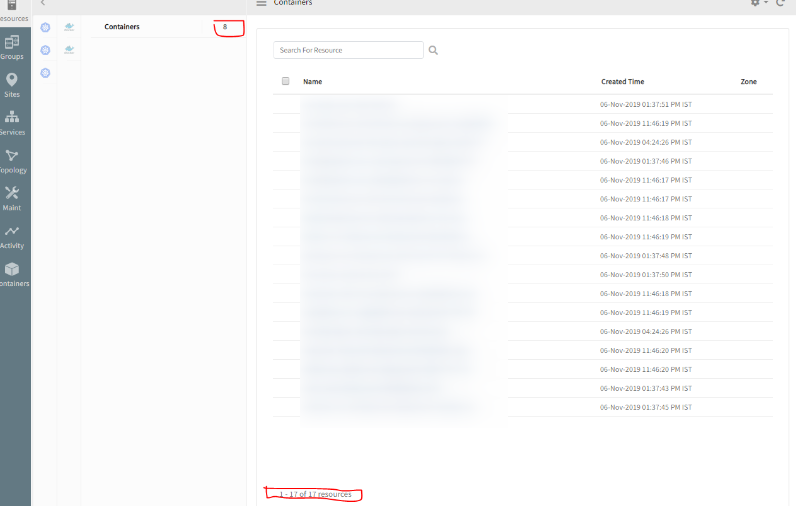
Kubernetes container count mismatch is observed in UI
Issue is fixed. The container count is matching correctly on both the tree as well as the right side resources list.
Interface Export does not give all interfaces information on the device
Unable to get the list of interfaces exported on the device.
Whenever the user exports, it gives 57 interfaces only and not 156 interfaces as shown in the Interfaces tab.
The user tries to rediscover the device and exporting. Same issue persists.
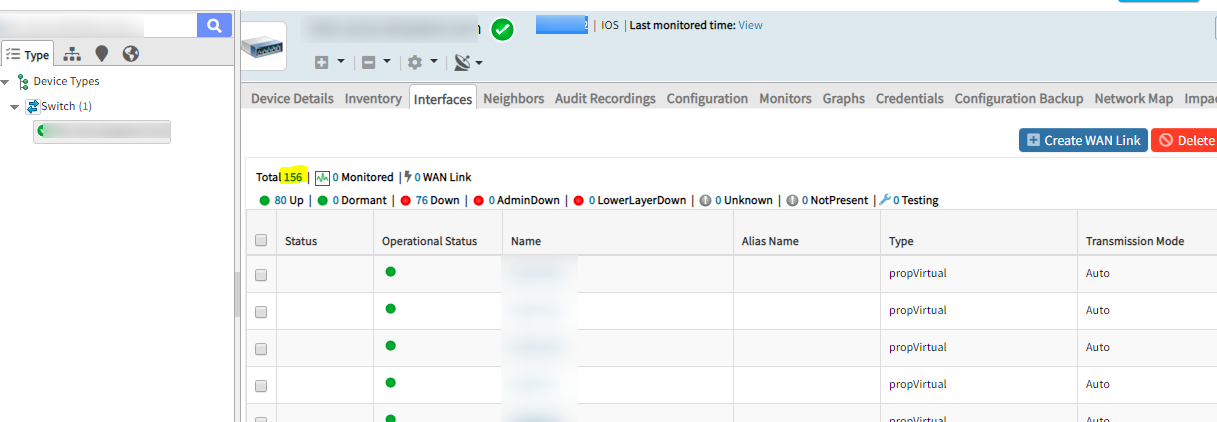
Interface Export does not give all interfaces information on the device
Issue is fixed. Done required changes and handled null pointer exception.
Able to export all the 156 interfaces.
Unable to Create Metrics List Widget for Netapp Cluster Metrics
Unable to create a working Metric List widget that outputs data for the Resource Group.
Able to get the metric data in a widget if creating “Predefined Widget” » “Top Metric Utilization”. Able to add the below metrics for the Resource Group. It does populate widget with the metric data, but the user wants a ‘Metric List widget’.
Metric: netapp.cluster.volume.inode-utilization Metric: netapp.cluster.volume.percentage-size-used
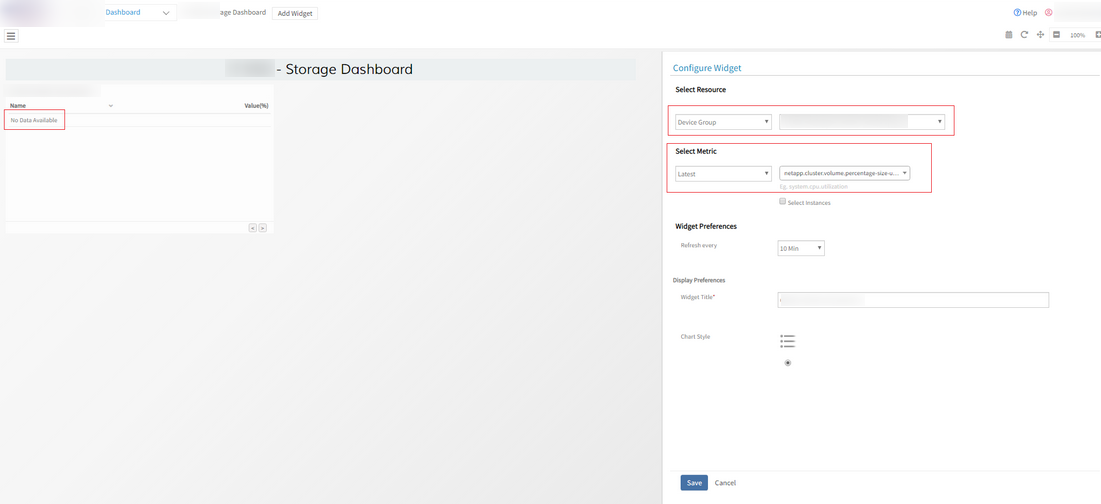
Unable to Create Metrics List Widget for Netapp Cluster Metrics
In the metric list widget process, retrieving the devices object array by passing the datalog monitoring parameters. Due to that unable to show resources in metric list widget.
Issue is fixed. Changed the devices object service layer call to resources object service layer call in metric list widget process; also fixed the metric list widget monitoring icon issues.
Unable to access widgets though have permission enabled
When the user logs into OpsRamp and goes to the ‘Client Dashboard’, has the three widgets (Top Memory/CPU/Disk Performance) that show ‘No Access’, even though they have a Permission Set: ‘Dashboards Shared View’ enabled.
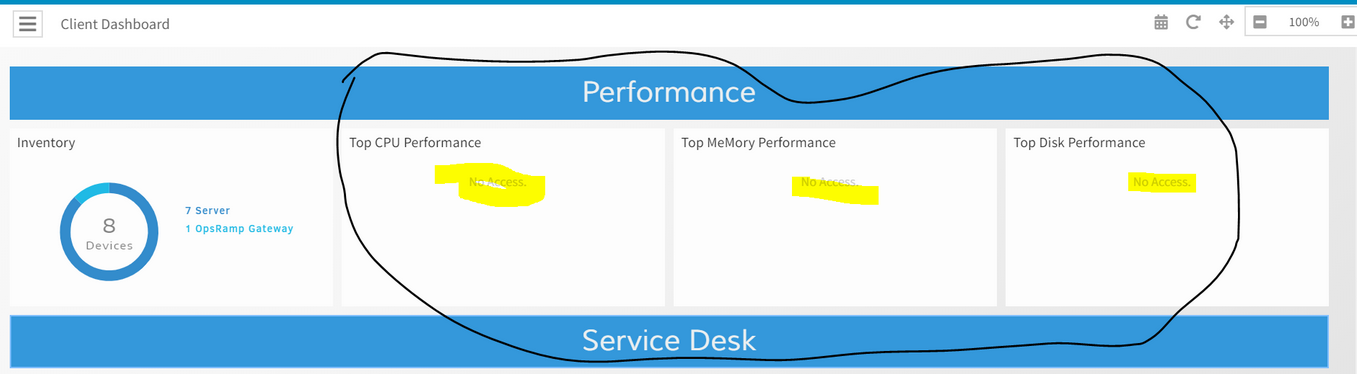
Unable to access widgets though have permission enabled
Unable to access widgets though have permission enabled
Top Memory/CPU/Disk Performance widgets require Device View and Monitors View permission.
The user does not have the monitors view permission, so displaying no access message for the above 3 widgets.
Issue is fixed. Able to view the above 3 widgets with Device View and Monitors View permission.
Unable to access the Bladeservers tab in the New UI
Able to view the tab and the details under SP Level, but unable to view the details under Partner level; it is showing blank.
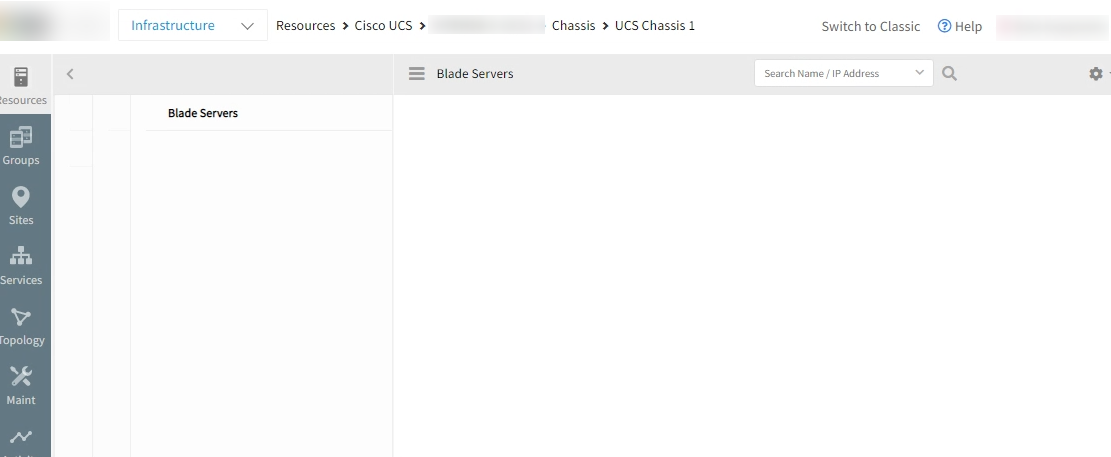
Unable to access the Bladeservers tab in the New UI
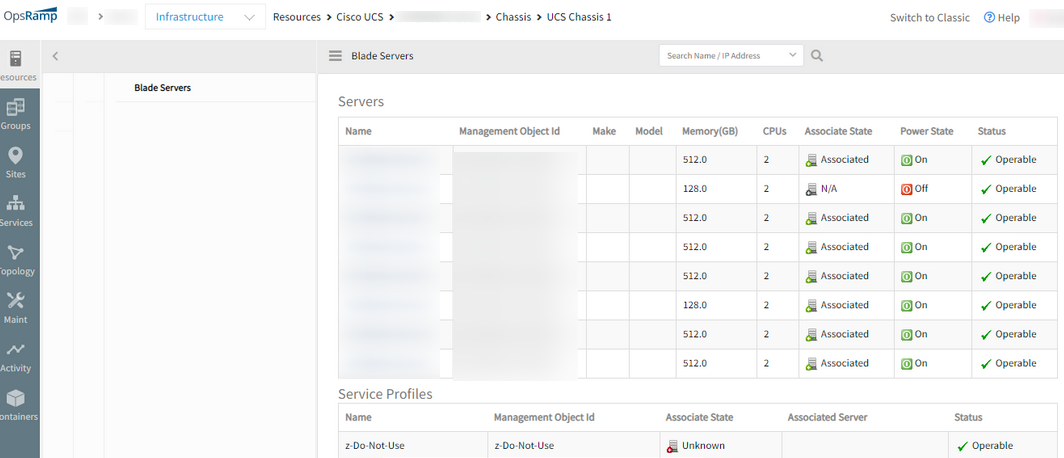
Unable to access the Bladeservers tab in the New UI
Issue is fixed. The UCS Bladeserver list is displayed under the Partner login as well, in the New UI.
Service Map widget for Service Status does not reflect data
Receiving 500 Internal server error.
Service Map widget for Service Status does not reflect data
Issue is fixed. The service status widget is populating data correctly.
Issue while assigning Service Map
Receiving 500 – Internal server error while assigning individual service map as node under top level service map.
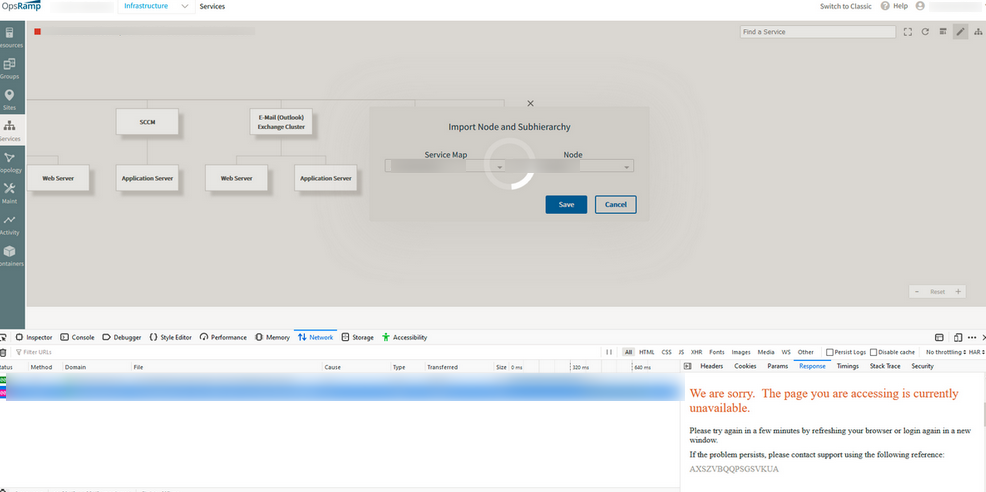
Issue while assigning Service Map
Issue is fixed. Service maps are importing correctly.
Monitoring Management
Provided Inclusion filter for SNMP trap OIDs
‘Include OIDs’ option in the ‘Create SNMP Trap Monitor’ screen under ‘Monitor Management’ is provided.
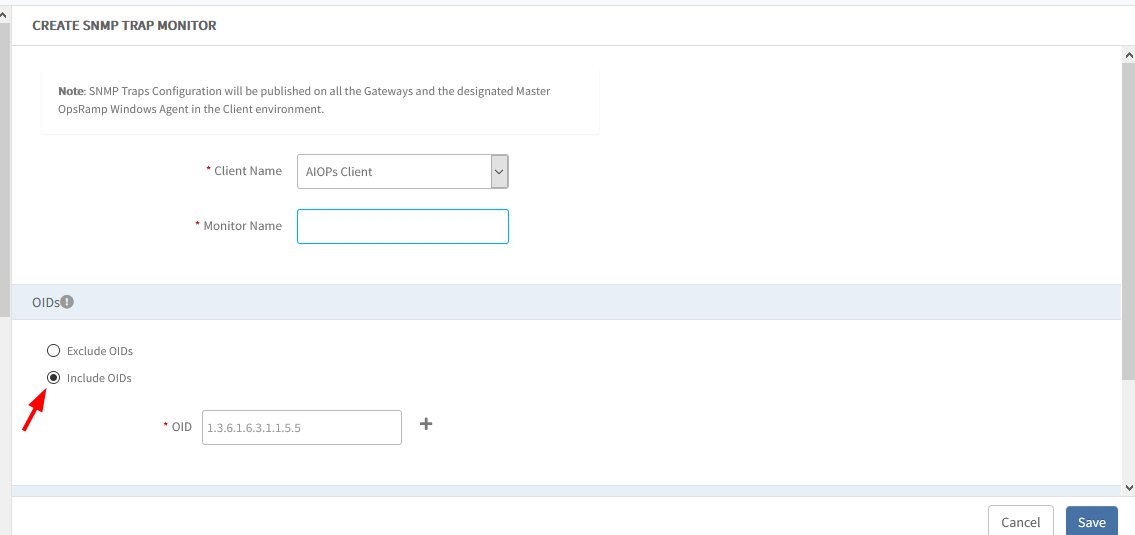
Provided Inclusion filter for SNMP trap OIDs
There is Exclude OID option, and if there are large number of OIDs, then it involves unreasonable manual effort. So, the Include option is provided.
Advance search functionality in Agent Custom Monitors List page
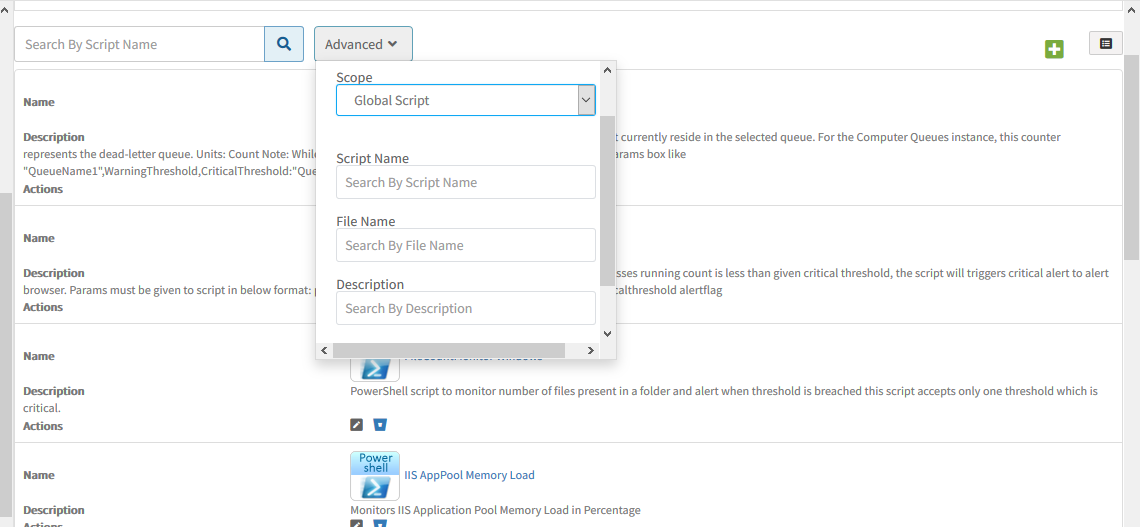
Advance search functionality in Agent Custom Monitors List page
The advance search functionality provides the ability to search the content with the search filters: Script Name, File Name and Description.
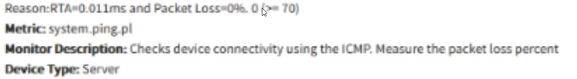
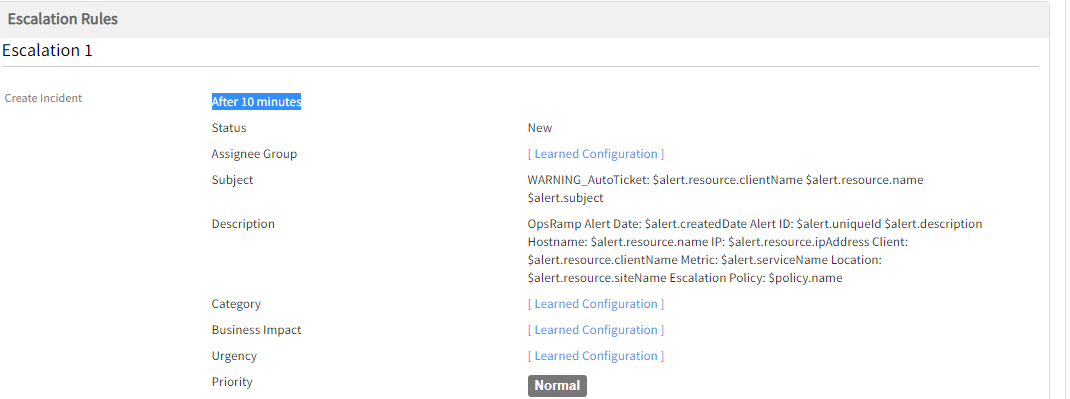
Alert’s subject content to be more descriptive for Repeat count and Frequency of metrics
Previously: If there is a CPU alert that needs to repeat 6 times, with a 5-minute interval before alerting, it does not display what the total time is.
Now: Provided the support at Gateway end. The Alert Duration is shown as per the change in metrics with latest Gateway.
Before the change:
Alert’s subject content not descriptive
After the change:
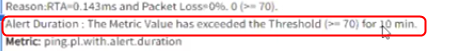
Alert’s subject content to be more descriptive
The duration of the alert is being displayed as part of the improvement.
The alert subject is descriptive for all the metrics.
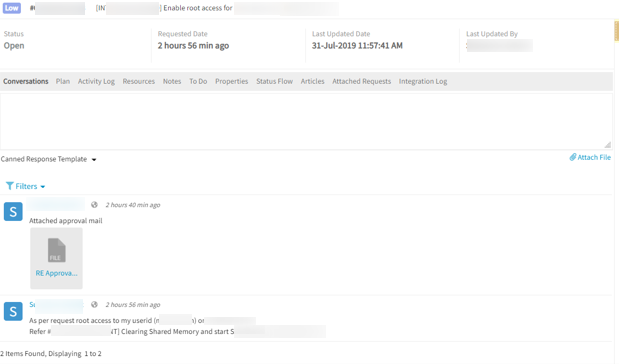
Not receiving any notifications for any Incident created
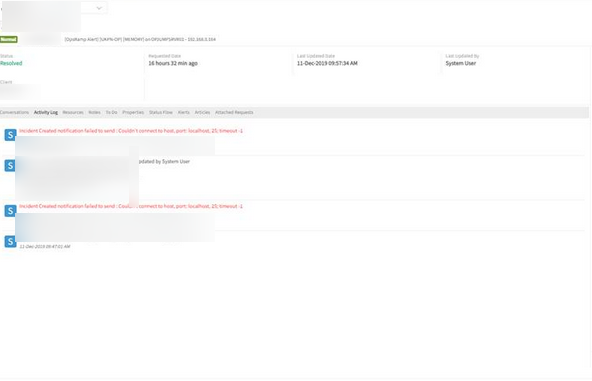
Not receiving any notifications for any Incident created
The sendmail client went to hung state on one of the notification servers that was not allowing E-mail delivery. So, restarted the service to bring it back.
E-mail notifications for tickets are send through separate servers called Job processors. There are multiple JP nodes processing the notification data.
In this specific case, one of the notification nodes got impacted and some of the E-mails did not get delivered.
Worked on enabling checks at each node level to avoid this in future.
Issue is fixed. The notifications are being received for the Incidents created.
Disk partitions are not visible in Hardware Tab
Disk utilization Graph/Hardware Tab does not show the partitions available on the device in portal.
Executed the asset information job for this device, restarted the agent, but of no avail.
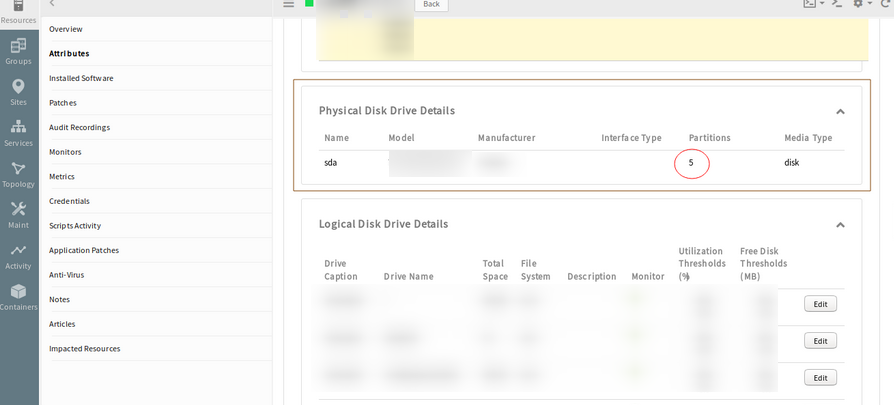
Disk partitions are not visible in Hardware Tab
Issue is fixed. Able to see the partitions in the tab.
Alerting is disabled on the device, still alerts are being triggered
Alerting is disabled on the device, still alerts are being triggered
Alerting is disabled on the device, still alerts are being triggered
Issue is fixed. There are no alerts raised after disabling from monitoring.
Tenancy and RBAC
Disabling / Deactivating MFA/2FA authentication will require OTP
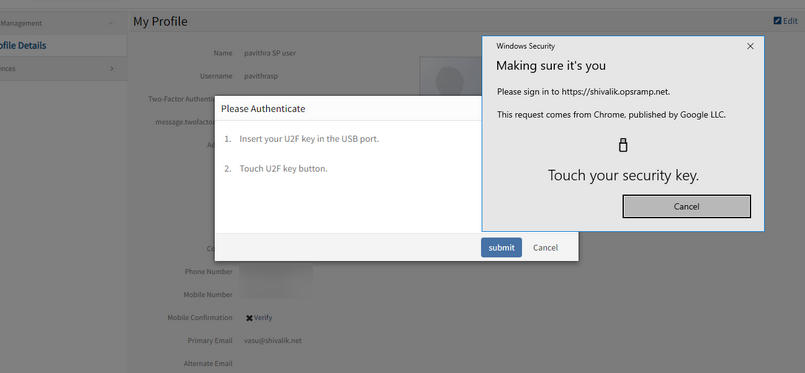
Two-Factor Authentication on ‘YUBICO Authenticator’
When trying to turn OFF, the YUBICO authentication check screen is displayed. Unless the key is entered correctly, the MFA/2FA cannot be disabled or deactivated.
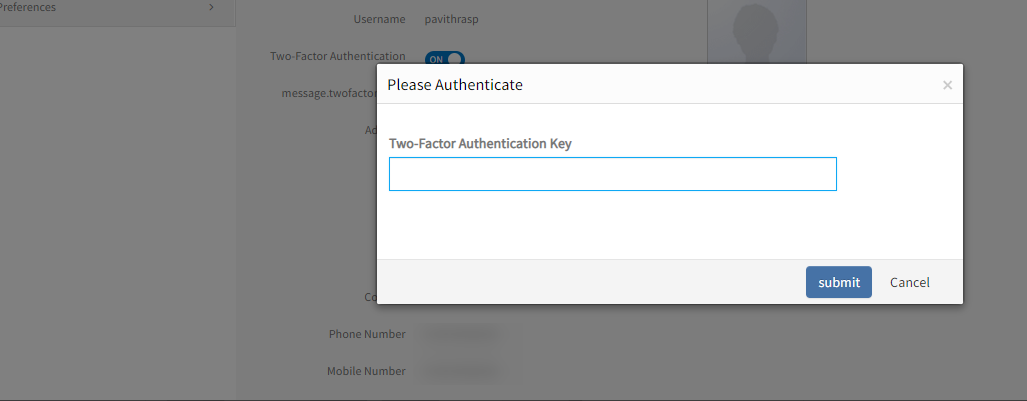
Two-Factor Authentication on 'YUBICO Authenticator
Two-Factor Authentication ‘OFF’ on ‘TOTP Authenticator’
When trying to turn OFF, the TOTP authentication check screen is displayed. Unless the code is entered correctly, the MFA/2FA cannot be disabled or deactivated.
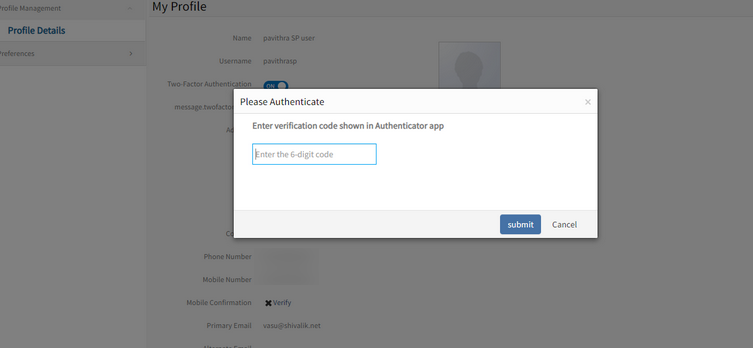
Two-Factor Authentication 'OFF' on 'TOTP Authenticator
Two-Factor Authentication ‘OFF’ on ‘FIDO Authenticator’
When trying to turn OFF, the FIDO authentication check screen is displayed. Unless the key is entered correctly, the MFA/2FA cannot be disabled or deactivated.
Two-Factor Authentication 'OFF' on FIDO Authenticator
- If Authentication is wrong or fails, then validation message is displayed.
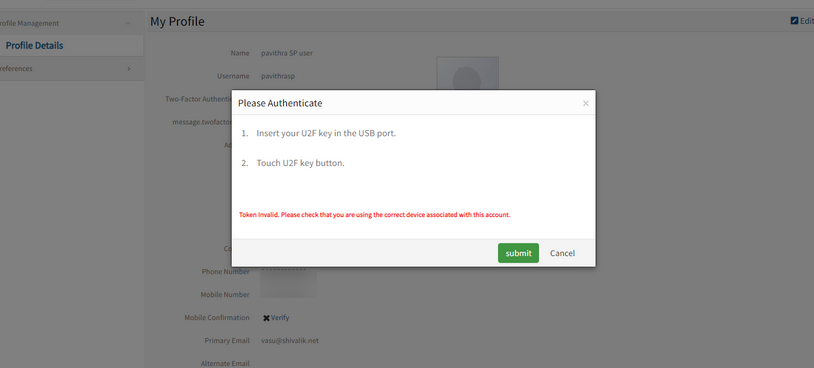
If Authentication is wrong or fails, then validation message is displayed
In case the authentication fails for 3 times, the user is automatically logged out. The user must log in again.
This feature is introduced to avoid security issues like session hijacking.
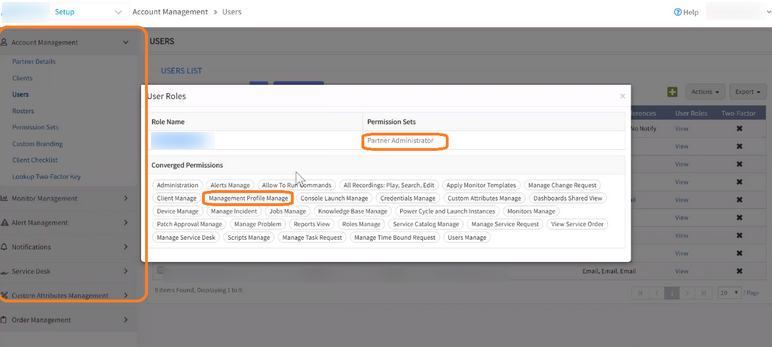
Allow Administrator to Delete Views created by other users
This will improve RBAC and allow user to use roles at granular level and allow only certain set of users with appropriate permission to remove the view instead of depending on the creator. If a creator of manage views is no longer a user in OpsRamp the View still exists and cannot be deleted from UI.
Users with roles that have Administrator permission set should be able to delete shared views created by both other admin and non-admin users.
This feature is User based and should be Role based.
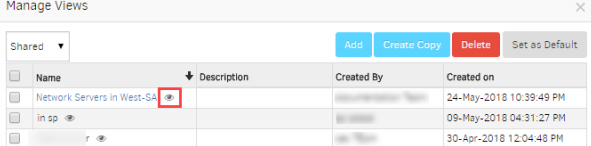
Allow Administrator to Delete Views created by other users
Only a user with Administrator role can delete a shared view.
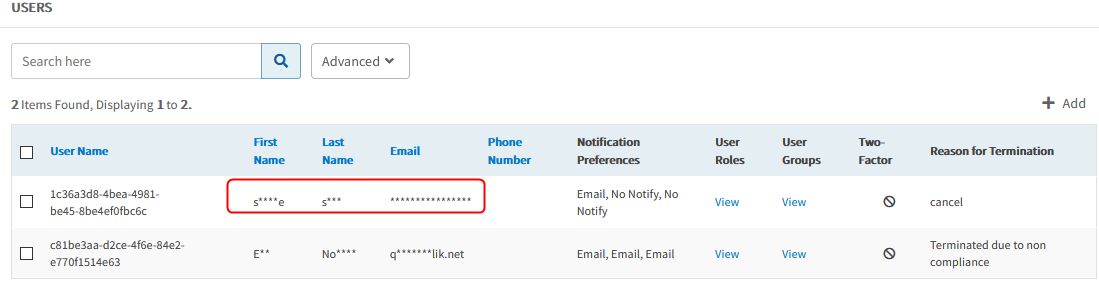
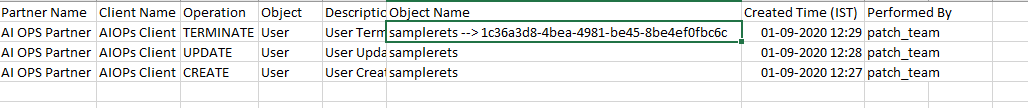
Terminated user’s Audit logging additions
The USERS page displays the terminated user PII (Personal Identifiable Information) in a completely masked or partially masked format and displays the User Name as a random unique ID.
Terminated user's Audit logging additions
You could trace back the details of a terminated user using the Audit Reports. From the generated Audit Reports, check the Object Name column to map the unique ID and the terminated username.
Terminated user's Audit logging additions
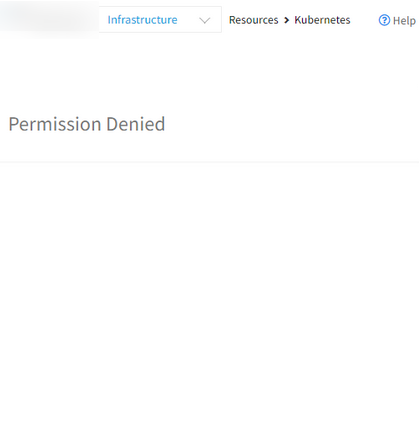
Permission Denied issue, for Kubernetes resources, when user with specific clients’ access logs in
Logging in as a Partner having specific clients’ access (instead of All clients’ access), it is showing Permission Denied error, even though user is having All Resources permission, for Kubernetes resources.
On the Infrastructure page, when the user clicks Kubernetes resources on the left panel tree, this error message is displayed.
Permission Denied issue
Passed deviceId in Kubernetes device node request URL. Issue is fixed. The user is able to view the resource details.
Able to view the resource details
Clients are getting removed in the process of creating or modifying a Role
User has created a user group with some name and then assigned a role. When trying to add the clients, initially they added 15 clients, but only 12 clients got saved. Then they added the other 3 clients and saved. The number of clients went down to 10. Randomly few clients were removed.
Modified the process of client loading while role Create/Edit.
Issue is fixed. Clients are not getting removed after creating and updating roles.
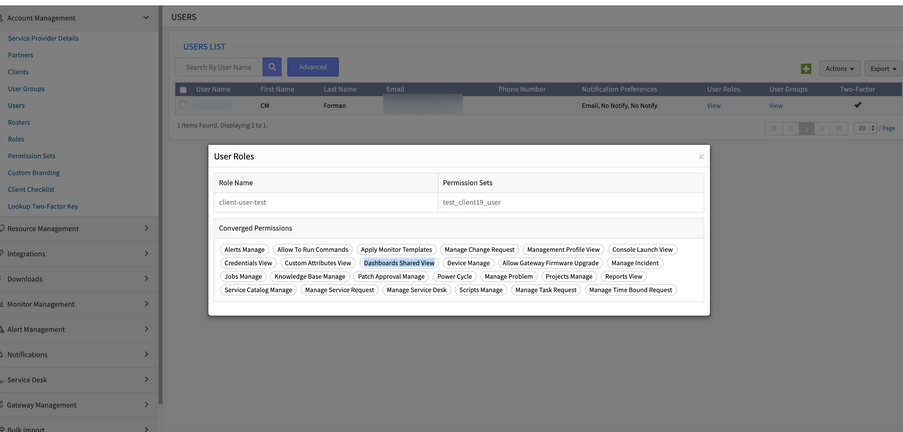
Partner Viewer User when elevated to Partner Administrator role, the permissions are not reflected
There are two user roles created- (a) With View only permission values (b) With Manage permission values. Both the roles are mapped under SSO so that when a user with Viewer or Admin permission is accessing from SSO will have the respective role assigned.
Removed the user from Viewer role in AD FS and added to Admin and then tested. The user is able to access and has the role of Admin, but is unable to see the Resource Management, Integrations, Downloads selections under Setup.
Partner Viewer User when elevated to Partner Administrator role, the permissions are not reflected
The cache keys are not deleted when user roles are updated, then they are trying to log in by SSO.
Issue is fixed. Deleted the cache keys.
User is able to view all the selections under Setup.
Templates
ActiveMQ metric graphs are displayed even though they do not map to an assigned template
None of the metrics are mapped to any of the assigned templates, yet the graphs are still displayed, in the Metrics tab.
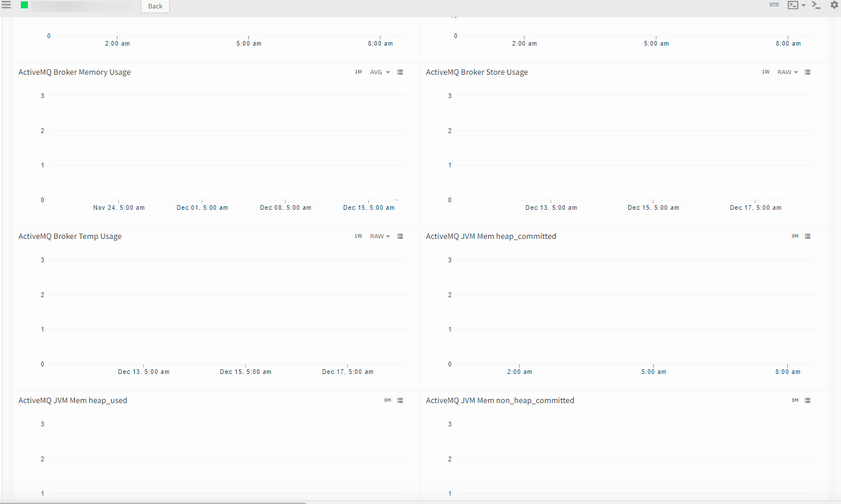
ActiveMQ metric graphs are displayed even though they do not map to an assigned template
Issue is fixed. The additional graphs are not displayed.
Reports
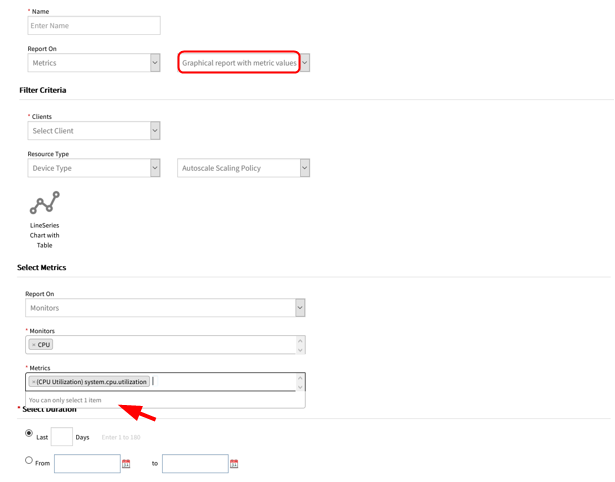
Graphs in custom metric reports
Custom metric reports now support an option to include time series graphs for deeper analysis of insights tracked by OpsRamp.
Graphs in custom metric reports
Ticket Report Enhancement
Standard ticket report is enhanced to include the attribute Time from Alert to ticket. This enhancement helps users view the time taken to create an incident after the corresponding alert generation.
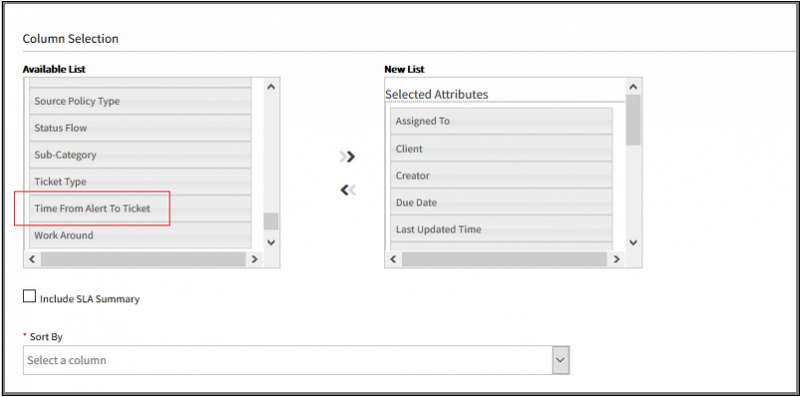
Ticket Report Enhancement
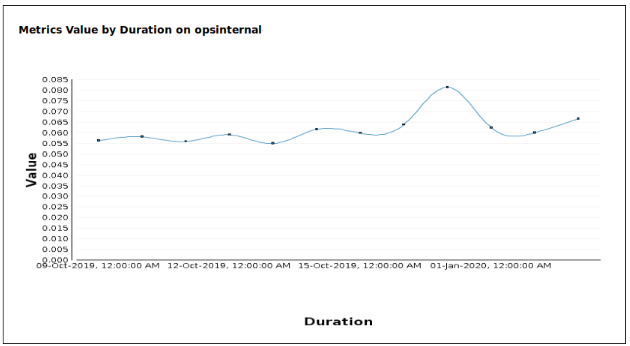
Metric report to show RAW or individual data points for CPU / Memory metric utilization
Previously, there was one data point in a report generation period of 1 day or week or a month.
When exported the report from the graph will show all the data points (average value).
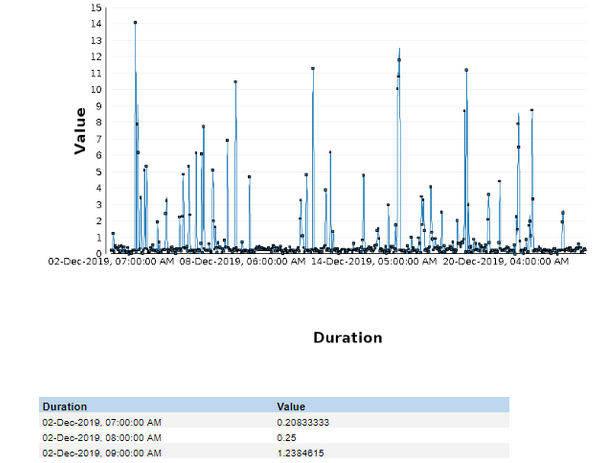
Metric report to show RAW or individual data points for CPU / Memory metric utilization
The device selection is restricted to 50 devices, and number of metrics selected to just 1.
The device selection is restricted to 50 devices, and number of metrics selected to just 1
Alert Report page shows Permission Denied message though users have Device view permission
This is happening at Client level for all the users.
Alert Report page shows Permission Denied message
Issue is fixed. Able to view the page.
Audit report is not showing correct information

Audit report is not showing correct information
When Email Id is changed in the User account, the Audit report is showing it as User Enabled Two Factor.
Issue is fixed. When the attributes like Email Id, etc. are changed, the report shows as User Updated.
Unable to download CSV file from the Email notification, it is redirecting to branding.app.opsramp.net
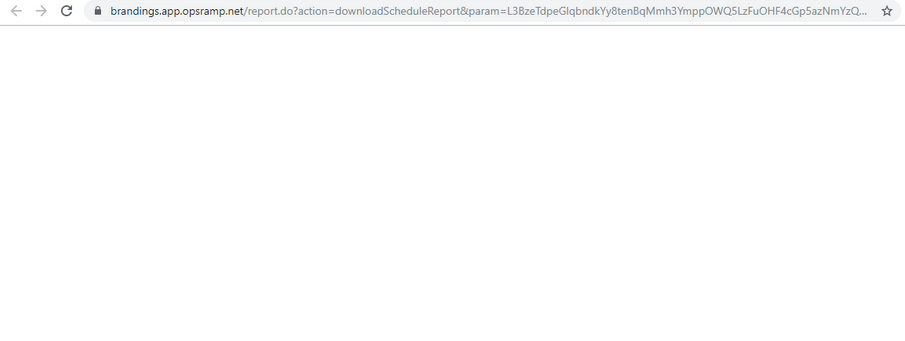
Unable to download CSV file from the Email notification
This is fixed.
Also, if Client user does not have custom branding, then mails will be sent with default ITOP base URL, instead of the Partner URL. Similarly, if Partner user does not have custom branding, mails will be sent with default ITOP base URL instead of the SP URL.
So, if a client user (who does not have custom branding) creates a user or generates a report, they will only get the generic OpsRamp URL.
If the organization has custom branding, it will get the mails with custom branding URL.
Unable to run Partner level patch report. It is failing
The user tried to regenerate, still it is failing.
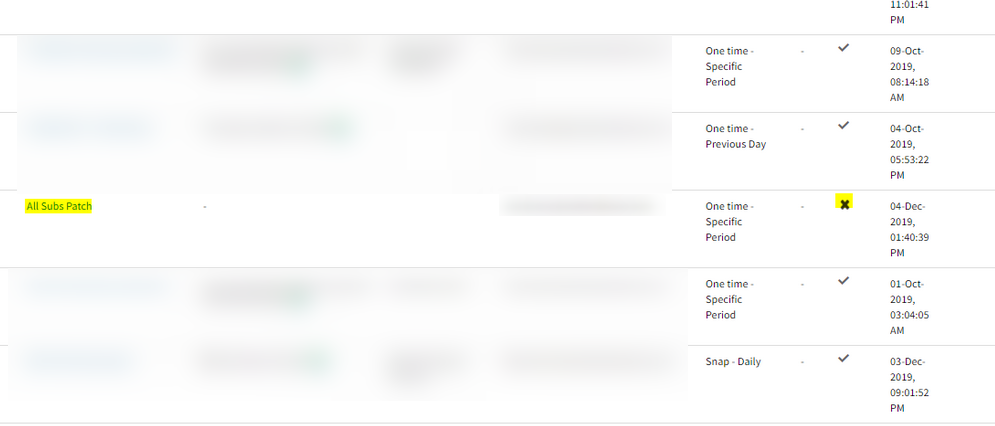
Unable to run Partner level patch report. It is failing
Issue is fixed. The report is generating properly.
Web Services Monitoring
Migrated the existing node.js module in Existing Synthetic Http Transaction Monitoring to Selenium Python Based Monitoring
Deprecated node.js based selenium synthetic transaction monitoring. Migrated to python based selenium script monitoring.
SSL Certificate Expiry graph for HTTPS web service monitors is not showing data
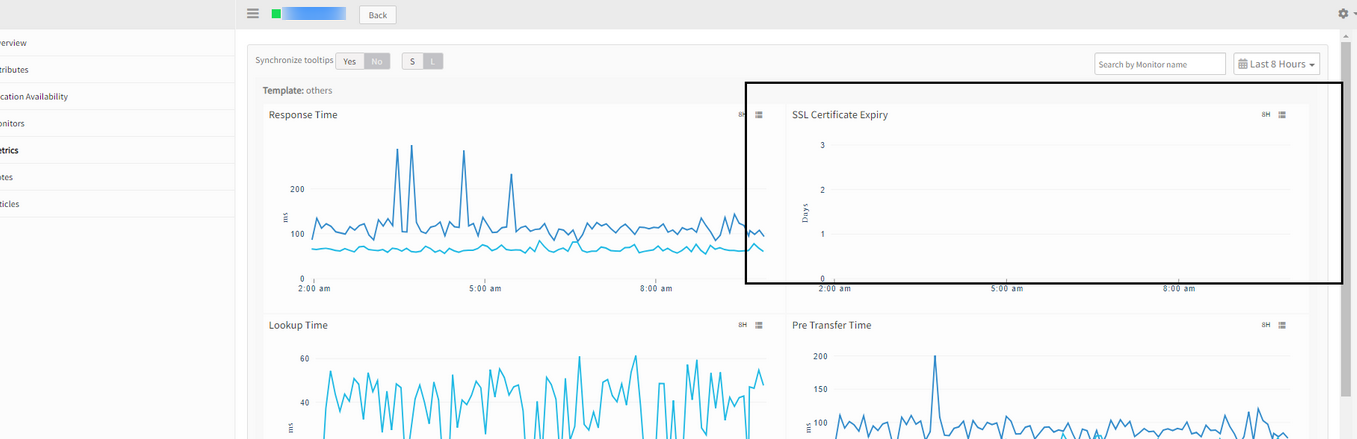
SSL Certificate Expiry graph is not showing data
Issue is fixed. The graph is displaying data correctly.
Unable to apply synthetic monitoring
Error message is displayed when applying the Web Services.
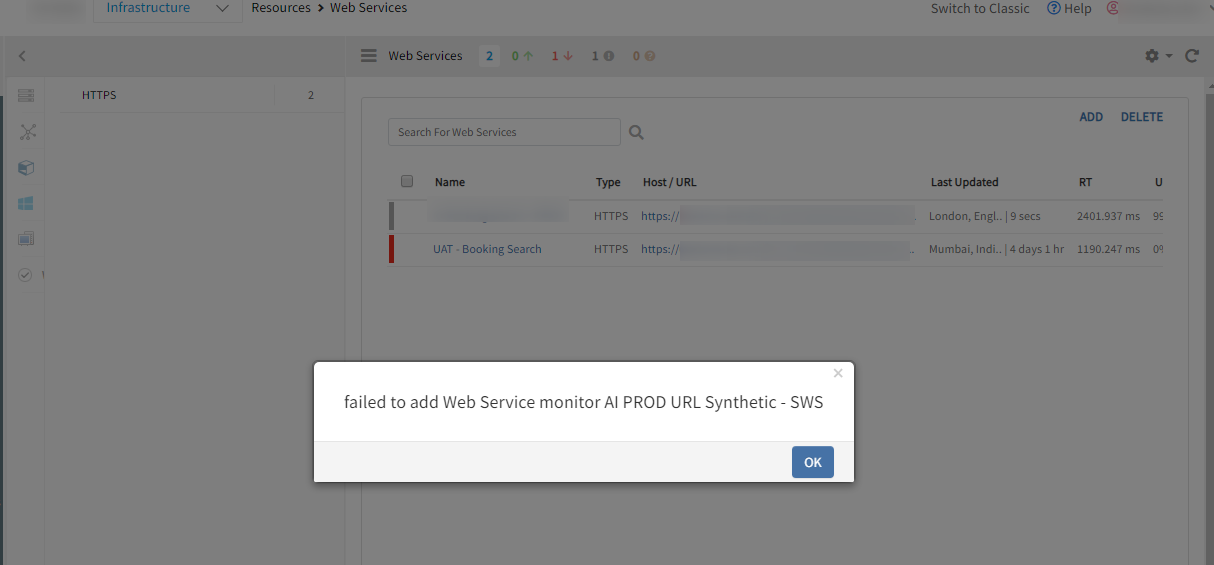
Unable to apply synthetic monitoring
Issue is fixed. The synthetic monitoring is being added successfully.
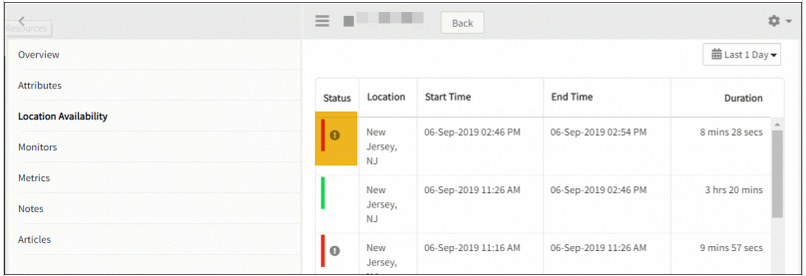
Error message when trying to access Location Availability
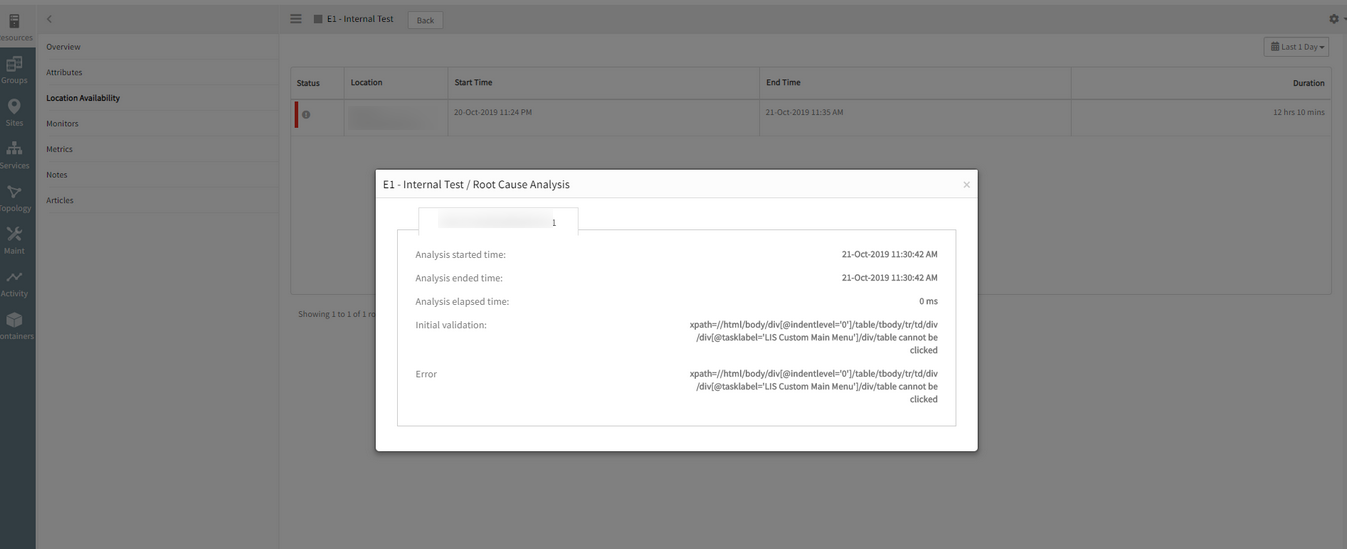
Unable to access Location Availability
Issue is fixed.
Added additional capabilities to Chrome driver to ignore certificate related errors.
Alert Management
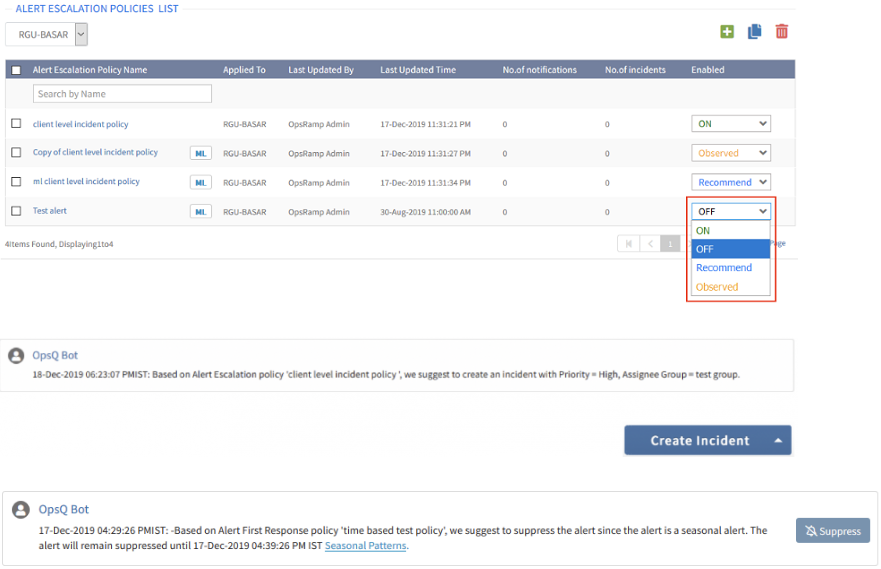
Recommend mode
First Response and Alert Escalation policies now provide a new mode – the Recommend mode. In Recommend mode, you will see actions that OpsRamp recommends for an alert – based on its automated learning. Then apply the recommended actions with a single click. This feature helps you advance from Observed mode, which provides passive insight into decisions that OpsRamp would have made. With recommend mode, have a user perform final validation before acting on learning-driven recommendations.
Recommend mode
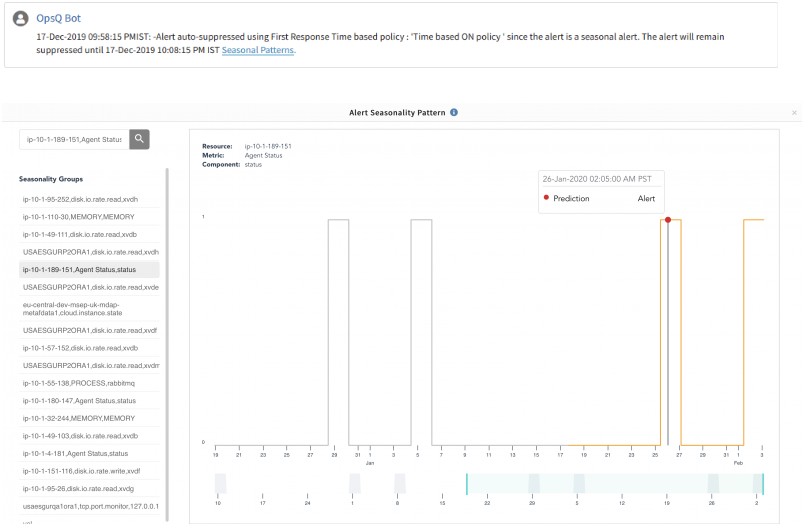
Visualize seasonality patterns in alerts
Visualize patterns for alerts that are candidates for auto-suppression. You will see a link within alerts that are auto-suppressed or recommended for auto-suppression to launch a widget showing the historical and estimated trends for alert recurrence.
Visualize seasonality patterns in alerts
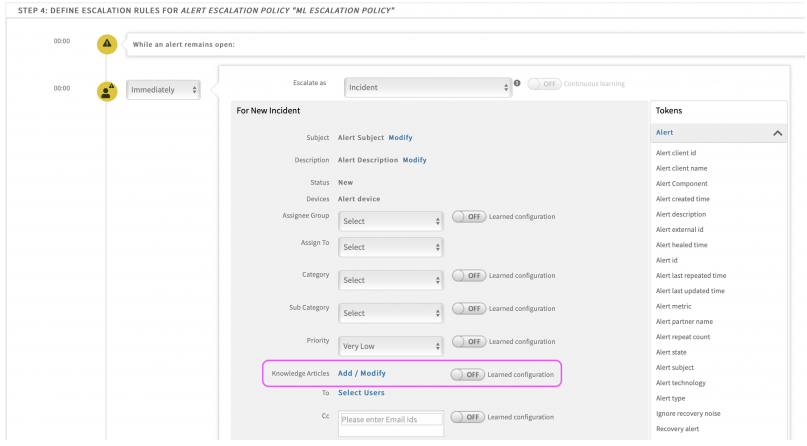
Link knowledge articles to incidents automatically
Knowledge articles play a vital role in helping the IT staff to resolve incidents. Now, configure KB articles as part of the alert escalation policy. The incident ticket created through the policy will have knowledge articles linked. Alert escalation policies can also learn or be trained to automatically link relevant knowledge articles to incidents.
Link knowledge articles to incidents automatically
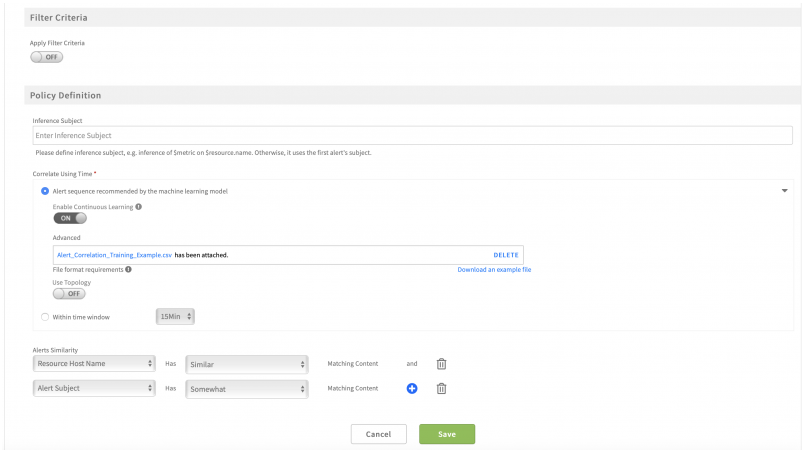
Simplified alert correlation policies
Alert correlation policies are now easier to configure with a newly designed page, which presents policy options in an intuitive layout.
Simplified alert correlation policies
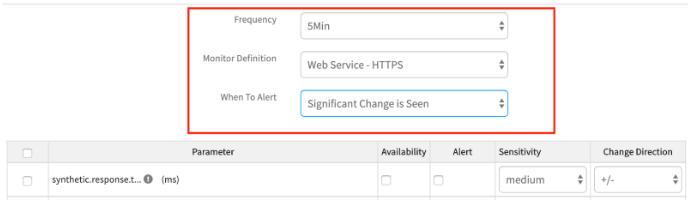
Change detection for all metrics
Prior to this release, change-based thresholds were available only for metrics collected by the OpsRamp Agent and Gateway. Now, these thresholds are available for all metrics, including those collected by public cloud infrastructure and web services.
Change detection for all metrics
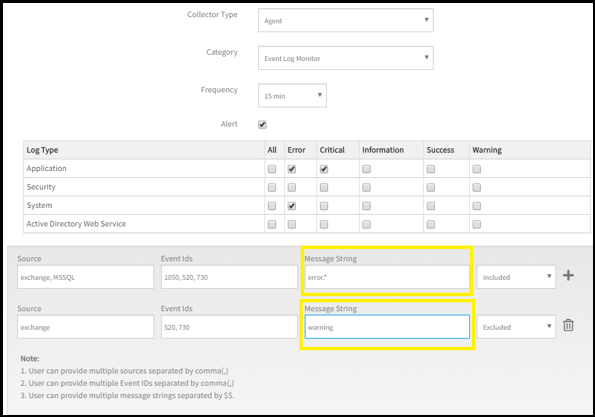
Improved filtering of Windows event logs
The monitoring template for Windows event logs now supports filtering on Message String, along with Source and Event ID.
Improved filtering of Windows event logs
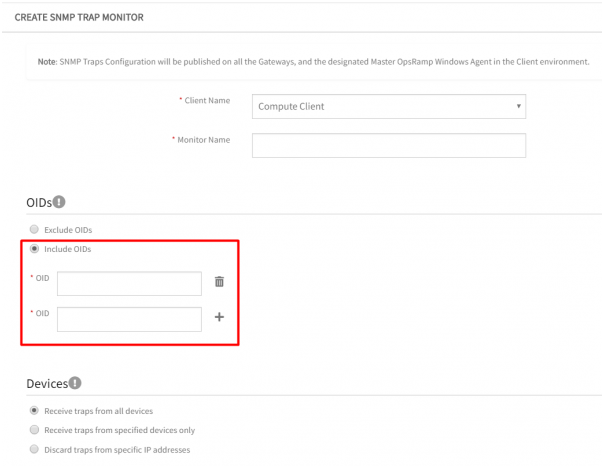
Improved filtering of SNMP Traps
Now include specific inclusion filters in the SNMP Trap monitors, making it easy to monitor SNMP traps of interest.
Improved filtering of SNMP Traps
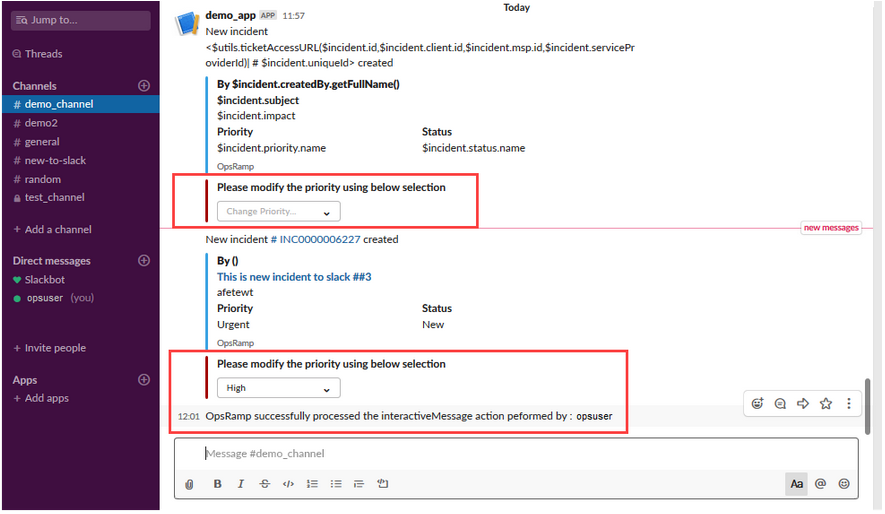
Interactive messages in Slack
The existing Slack integration is enhanced to support bi-directional integration. Once configured, users will be able to view all OpsRamp-generated incidents as Slack messages on the configured channel and any updates on Slack messages will be reflected in the OpsRamp incident. See Slack for more information.
Interactive messages in Slack
Usability improvements in email integration
The email-based integration framework has an improved user experience. The interface for defining parsing conditions has been simplified and the integration framework allows users to define a default parsing condition to avoid dropped email notifications.
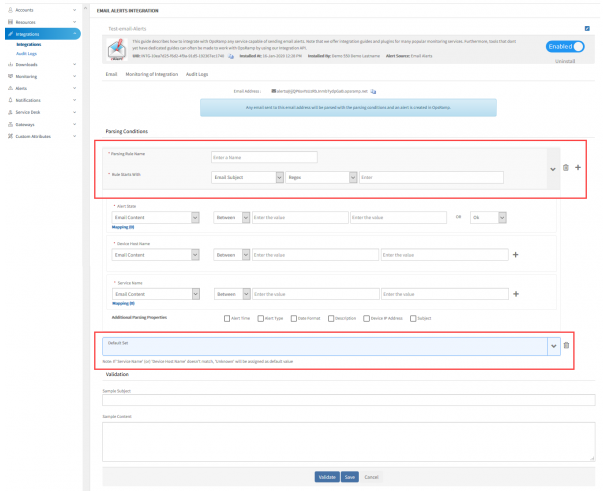
Usability improvements in email integration
Multiple property and parsing support for webhook-based integrations
Webhook-based event integrations now support improved parsing of event payloads and mapping event properties to OpsRamp’s event model.
Supported patterns:
- Between
- Before
- After
- Regular Expressions
Email Parsing
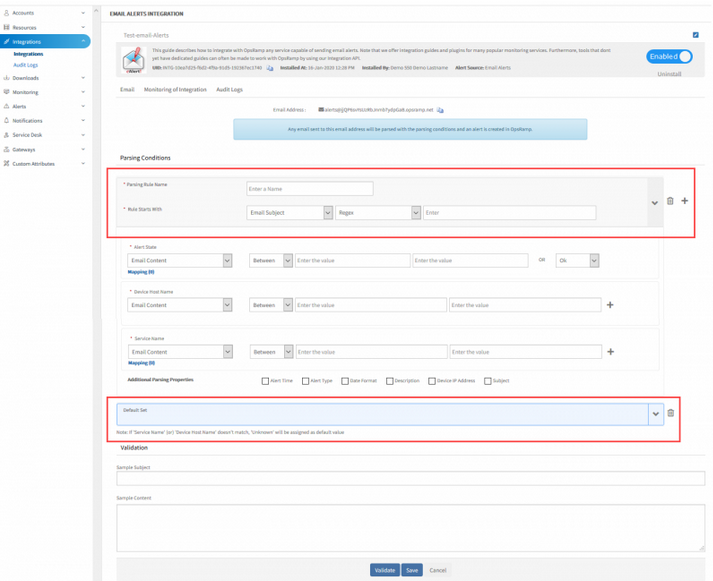
Email Parsing
Alert Mapping Parsing Properties
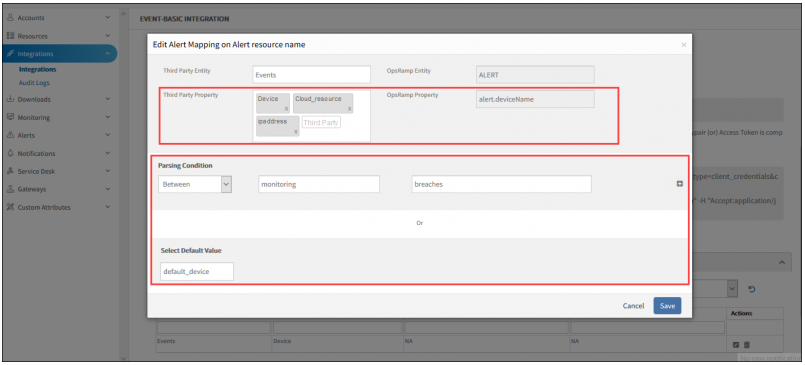
Alert Mapping Parsing Properties
New alert integrations
OpsRamp now includes integrations to ingest events, via webhooks, from the following products:
- Dynatrace
- Logz.io
- Prometheus
- Splunk
- Zabbix
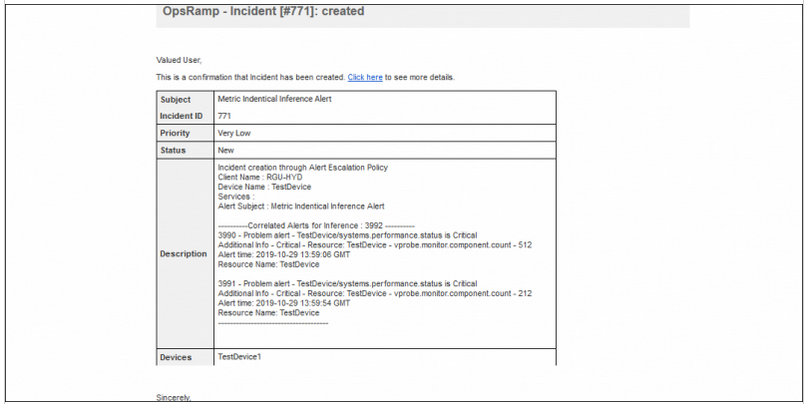
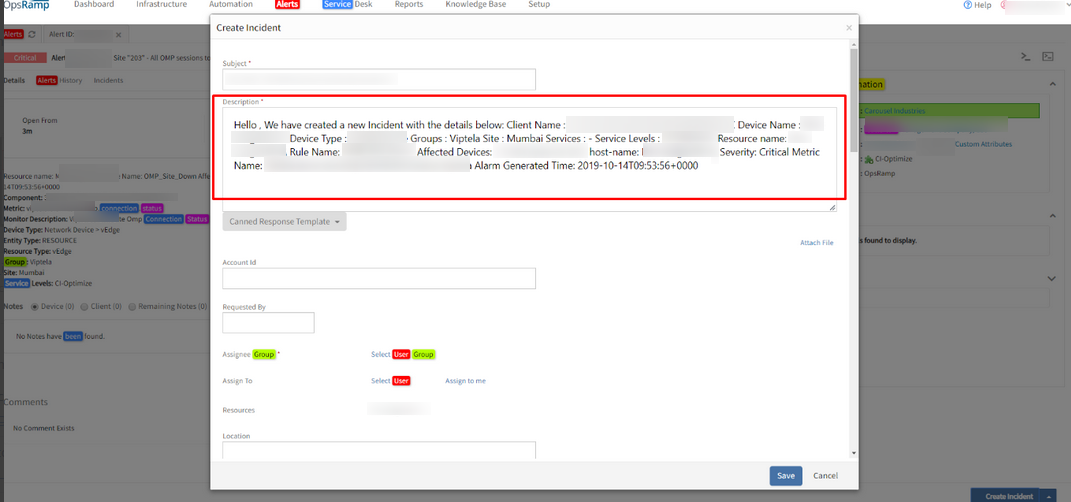
Inference context in auto-incidents
Incidents automatically created, from inferences, by alert escalation policies now include more details about the inference. Auto-incidents now include a list of correlated alerts associated with the inference. This enhancement makes it easy for incident management teams to focus on the right alerts for the root cause analysis.
Auto-incident description showing list of correlated alerts:
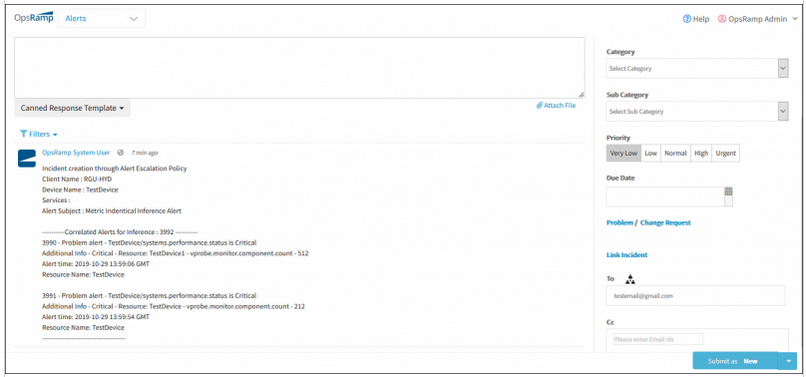
Auto-incident description showing list of correlated alerts
Incident Email Notification showing the list of correlated alerts:
Incident Email Notification showing the list of correlated alerts
Simplified time-period selection in alert browser
Alert view configuration now supports additional time-period selections for common scenarios. Prior to this release, selections included last day, week, month, year and custom period. Now, you have additional options to select by last 1, 2, 4, 8, 12, 18 hours.
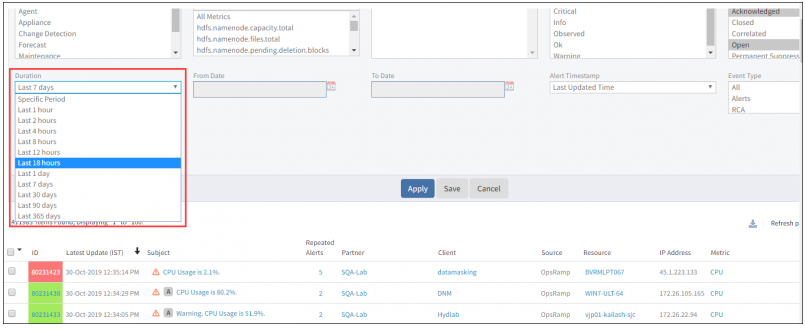
Simplified time-period selection in alert browser
Alert Similarity Reinforced Correlation
The Co-Occurrence based correlation policy includes an option to apply alert similarity as an additional criterion. With this option, you can fine-tune your policies so that alerts are correlated only if they co-occur and share similar properties. This option is suitable when limited topology information is available about the environment – alert similarity serves as a good proxy for alerts from related devices.
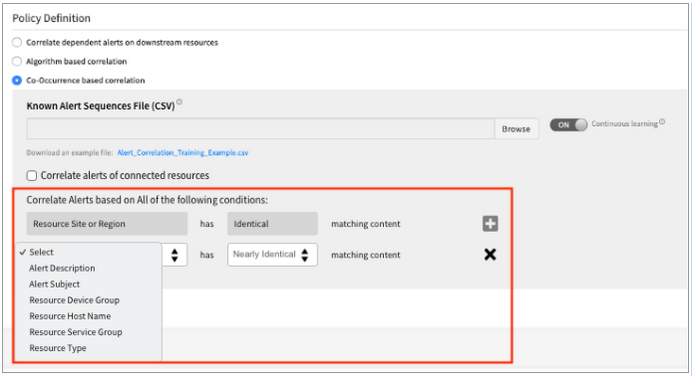
Alert Similarity Reinforced Correlation
Visibility into Detected Alert Sequence
You can now view common alert sequences that have been detected and learnt by OpsRamp. A new window shows top co-occurring alert sequences seen in your environment. This information helps you understand correlation decisions made by correlation policies and also gives you insights into patterns of device activity in your environment that cause these common alerts.
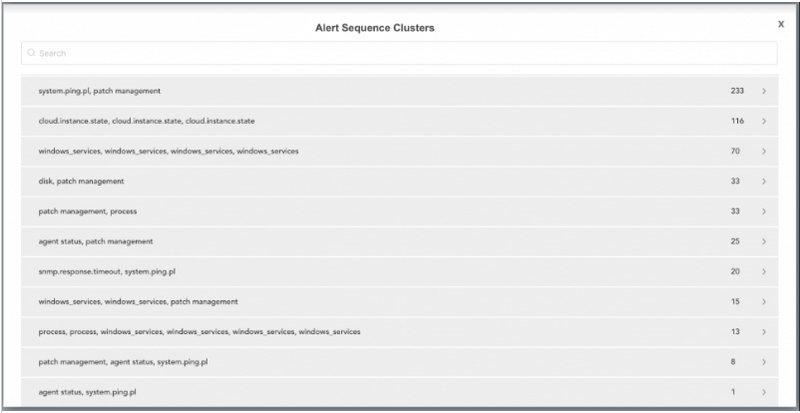
Visibility into Detected Alert Sequence
Inference Stats Widget with Statistics on Observed Mode
The Inference Stats widget now includes an option to show statistics for inferences created with Observed Mode. Using the option, you can configure this widget to show the potential alert reduction results in your environment.
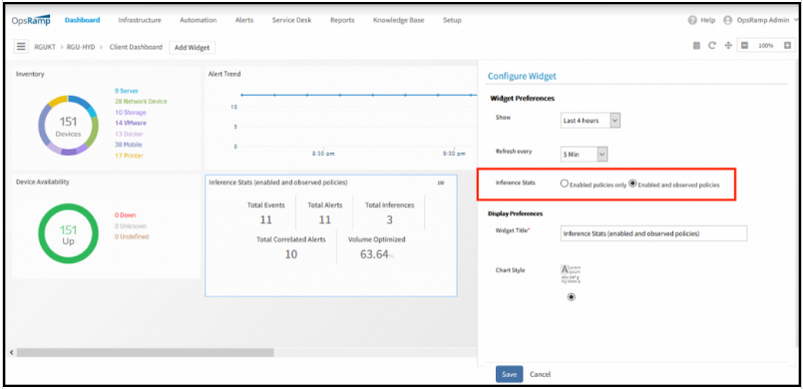
Inference Stats Widget with Statistics on Observed Mode
Improved Alert Ingestion from External Tools
The Create Alert API is enhanced to allow additional resource information to be included as part of creating a new alert. The resource name, device group, service group, location and custom attributes associated with an alert can be included while creating a new alert. With this improvement, OpsRamp can now ingest more resource context via a single API and apply this context in correlating alerts from external tools.
Updated event timestamps - Alert View
Added “First Alert Time (timezone)” to the main alert view
Renamed “Latest Update” column to “Last Alert Time (timezone)” in the Alert view and Correlated Alert view.
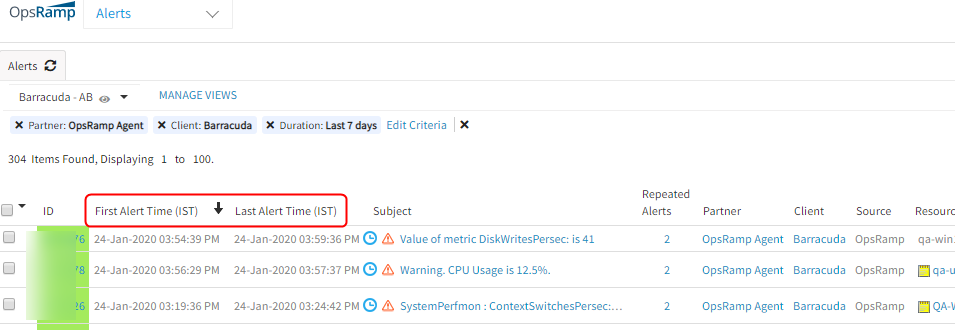
Updated event timestamps - Alert View
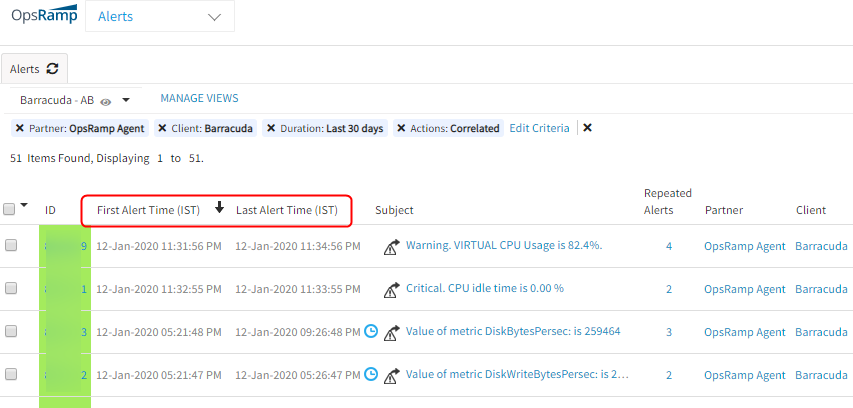
Updated event timestamps - Alert View
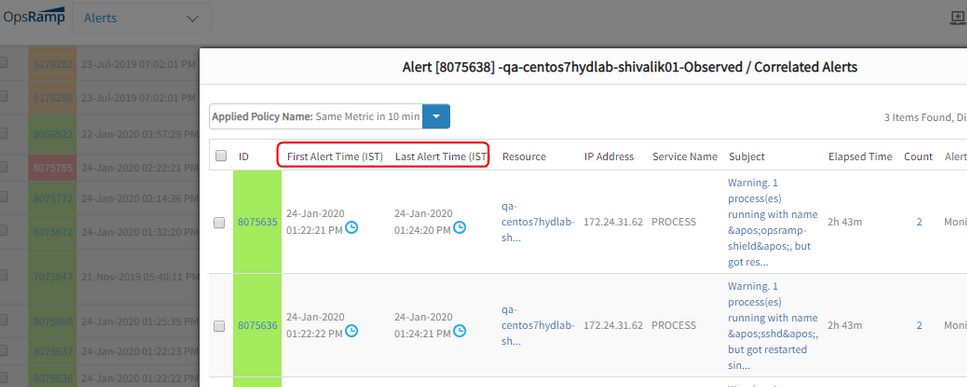
Updated event timestamps - Alert View
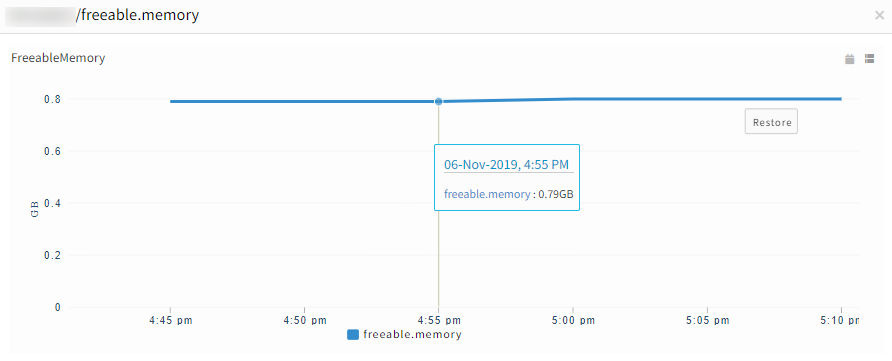
Incorrect value in Alert
Received a critical alert as freeable.memory is 0.0 GB. At the alert creation time the graph shows as 0.79 GB.
Incorrect value in Alert
The value in the Subject and description is incorrect. The alert is genuine.
Rounded off the values to two decimals. Issue is fixed.
Agents are online, but heal alerts did not generate
Received Agent offline alerts across multiple clients, though agents are online.
The heal alerts did not trigger for all the critical agent status alerts. Due to a bug, having 2 critical alerts that triggered when we get huge agent status alerts in a short interval of time and stay longer.
Agents are online, but heal alerts did not generate
A bug fix is applied to avoid duplicate critical offline alerts in these kinds of scenarios.
Unable to receive voice or SMS notifications
The user has Partner/Client level notifications enabled.
The mobile numbers which were not receiving the OTP were in DND mode.
Able to receive voice/SMS notifications.
No Incidents are created through policies
This happened on Jan 22, 2020.
From the past 35 hours, no incidents are getting created through alert escalation policies. There are multiple alerts that are matching the policies.
While calculating the difference of current time and past time, the number overflowed.
The fix was deployed on Jan 22nd. So, all the alerts that matched the policies configured to create the incidents with elapsed time will not be created before 30 hours from the time of deployment. After the fix, the incidents will be created for the alerts that are still in open state.
Changed Integer to Long. Issue is fixed.
While creating Incident from an alert, the description field is not displayed in proper format
This is taking time to alter manually causing inconvenience and consuming time for the users.
The description field is not displayed in proper format
The regular expression used in this function caused the issue for the simple strings.
Issue is fixed. The description is displayed properly.
Incident subject is taking the alert subject of an Info alert
As per the Alert Escalation policy the incident should be generated after 10 minutes. Here, the warning alert is triggered on 20-Aug-2019 at 11:06:20 PM IST and the Info alert triggered on 20-Aug-2019 at 11:06:27 PM IST and the incident got created with the latest Info alert subject.
As per policy, the incident should be created on 20-Aug-2019 at 11:16:20 PM IST, but the incident was created before the completion of 10 minutes.
Incident subject is taking the alert subject of an Info alert
Issue is fixed. Now the incidents are raised according to the time mentioned in the Alert Escalation policy, along with the correct subject line.
Mislabelled Email notification subject
Subject of the Email alert is “Top 10 large files in L:\”. This is the Info status of the alert. The Email should have triggered with the subject of the Critical alert.
As per the Escalation policy, the Disk Usage Critical Email notification should send immediately when critical alert is triggered. The Critical alert triggered on 20-Aug-2019 at 03:05:33 PM PDT but the notification was sent on 20-Aug-2019 at 03:05:38 PM PDT. Notification is delayed by 5 seconds, and meanwhile Info alert got triggered. Hence, the latest alert subject was considered for Email notification.
Issue is fixed. The notification delay issue is fixed. The user is receiving Email notifications with the correct subject.
Agent is offline, alert does not heal
For one of the clients, the agent is offline, but the alert is not healing. The alert remains red even after the Agent came back online.
The agent logs from the instance show that the agent is constantly restarted.
Agent is offline, alert does not heal
Issue is fixed. Agent offline alerts and heal alerts are working fine.
Hybrid Cloud Discovery and Monitoring
Improved Windows and Linux discovery
OpsRamp now enables remote discovery of Windows and Linux servers using WMI & SSH protocols.
Note: WMI discovery is supported only through Windows-based gateway, while SSH discovery is available from both Windows & Linux gateways.
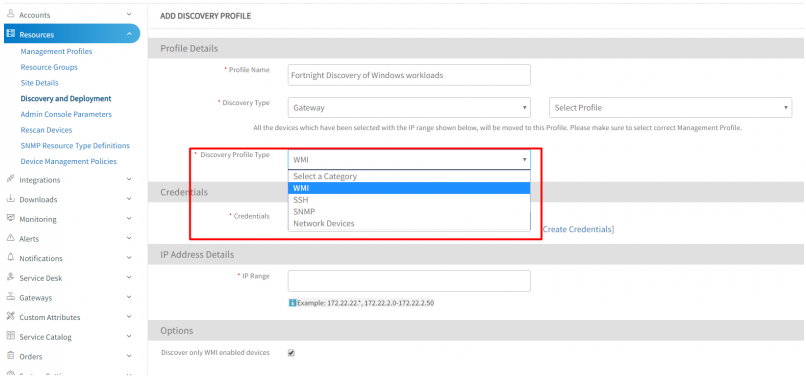
Improved Windows and Linux discovery
Custom monitors for Windows servers
With this release, the Gateway is available as a Windows application (see release note). Custom monitors, based on Powershell and WMI, are supported on the Windows gateway. Write agentless custom monitors for applications running on Windows systems.
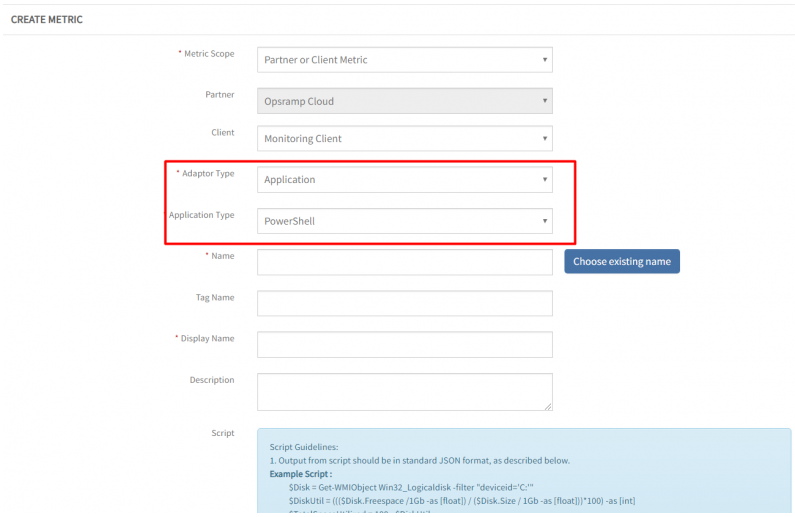
Custom monitors for Windows servers
Default availability monitors for cloud resources
The “Status/State” metric found in cloud monitoring templates will be the default availability metric. This provides administrators with a high-level understanding of resource availability immediately after assigning monitoring templates.
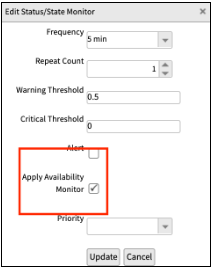
Default availability monitors for cloud resources
Topology discovery and visualization for Azure and Google Cloud Platform
Building on the existing support for AWS Topology, OpsRamp now supports automatic topology mapping for services in Azure and Google Cloud Platform. This enhanced topology enables teams to identify misconfigured routing rules, visualize VMs that have redundant network routes and more. This relationship data will also be leveraged by OpsRamp’s event correlation models in order to reduce alert fatigue and provide the cloud administrator more context when troubleshooting.
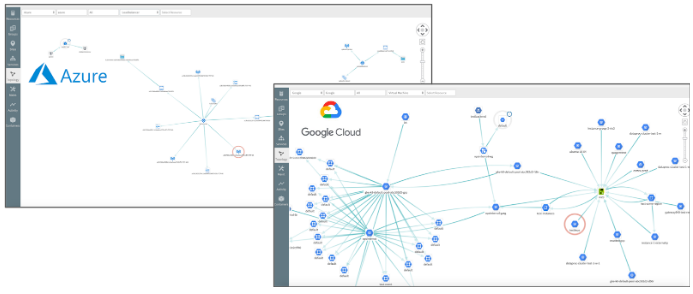
Topology discovery and visualization for Azure and Google Cloud Platform
Expanded support for AWS, Azure and Google Cloud services
OpsRamp now discovers and monitors the following services:
AWS:
- AWS Transit Gateway
- AWS CloudSearch
- AWS DocumentDB
Azure:
- Azure Application Insights
- Azure Traffic Manager Profiles
- Azure Virtual Networks
- Azure Route Table
- Azure Virtual Machine Scale Set
- Azure SQL Elastic Pool
- Azure Service Bus
Google Cloud:
- Google BigTable (Instances, Clusters, Nodes, Tables)
- Google Cloud Composer
- Google Cloud Filestore
- Google Cloud Memory Store for Redis
- Google Cloud Run
- Google Cloud TPU
- Google Cloud Tasks
Onboard AWS resources with External ID & Role ARN
OpsRamp now allows users to onboard their AWS accounts using an External ID & Role ARN. This creates a more secure and stable mechanism for onboarding AWS resources and is aligned with AWS best practices.
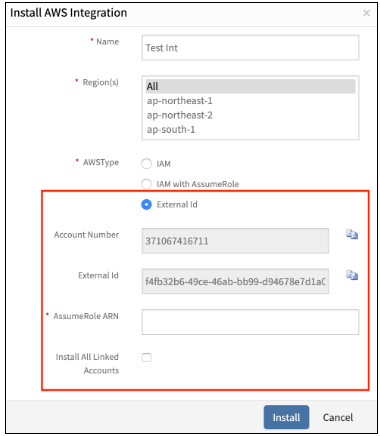
Onboard AWS resources with External ID & Role ARN
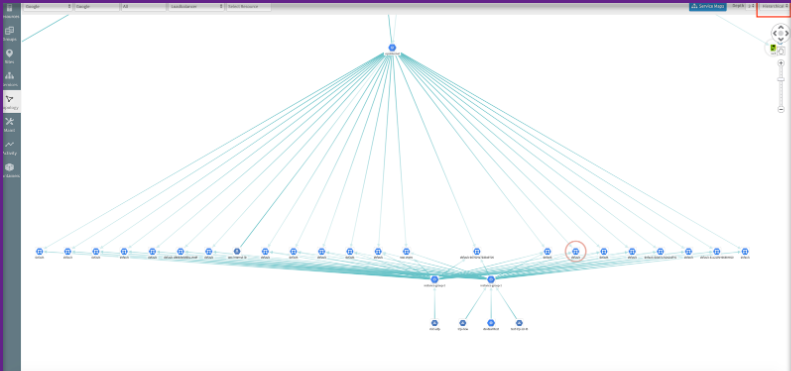
Topology map layout improvements
You will be able to visualize discovered topology with a hierarchical view. With hierarchical views easily see dependency relationships, host connectivity to network infrastructure, and clustered resources.
Topology map layout improvements
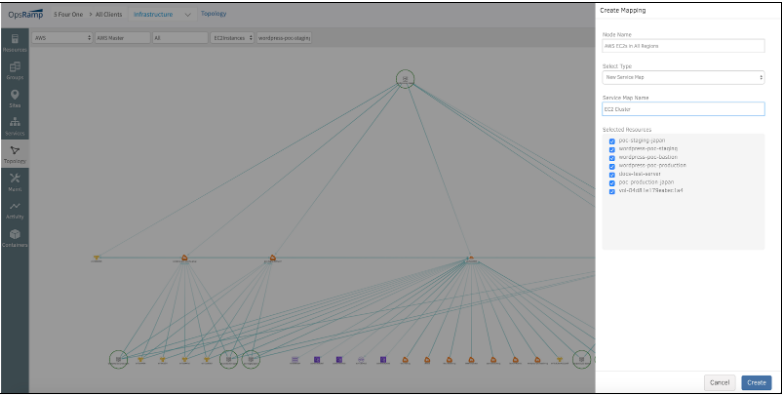
Create Service Map from Topology Map
Now, create service maps from discovered topology results. Bridging service maps and topology gives context when creating service maps and will ultimately deliver better alignment with application or infrastructure topology.
Create Service Map from Topology Map
Step-wise breakdown of Synthetic transaction performance
After creating a custom HTTPs synthetic using the Selenium plugin, OpsRamp will now be able to provide deep analysis into each step performed in the transaction. Having deeper insights into the Synthetic transaction enables web service owners to have more context when diagnosing and trying to pinpoint web service issues before the end users are impacted.
Step-wise breakdown of Synthetic transaction performance
Improved template assignment for Synthetics
Users will now be able to assign templates to web services using device management policies. Many of the configuration parameters for synthetic monitors have also been moved to templates to allow for easier deployment and configuration of web service resources at scale.
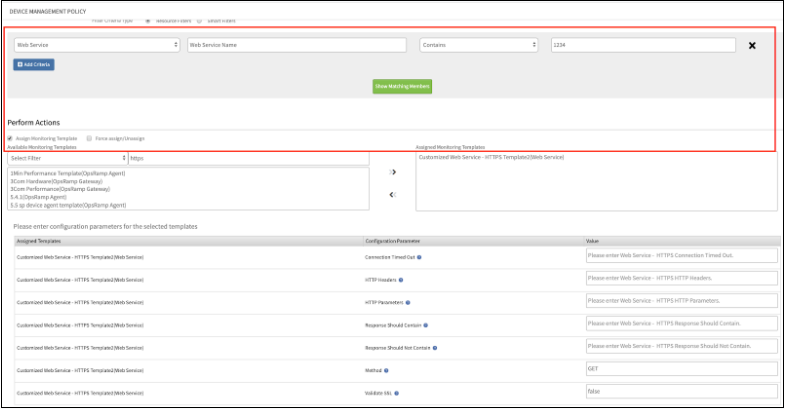
Improved template assignment for Synthetics
Case sensitive custom attributes
Custom attributes are now case sensitive. Any attributes that are ingested from Third-party tools or created natively in OpsRamp now retain their case. This means that users will be able to take advantage of any custom tags that are created in Third-party tools, or natively, to group resources, and created service maps.
Case sensitive custom attributes
Uniform name attribute for all resource types
Now leverage the name attribute to create resource groups, assign monitoring templates or create service maps. The name attribute is derived from the following attributes with the corresponding priority: 1) Alias Name 2) Host Name 3) Resource Name. Customers will now be able to use a consistent name attribute to query and use across the entire platform.
Uniform name attribute for all resource types
Define device group based on resource interfaces
Now use the interface names to group resources. This enables users to group resources that may share a common port or create service maps with the interfaces that support a service.
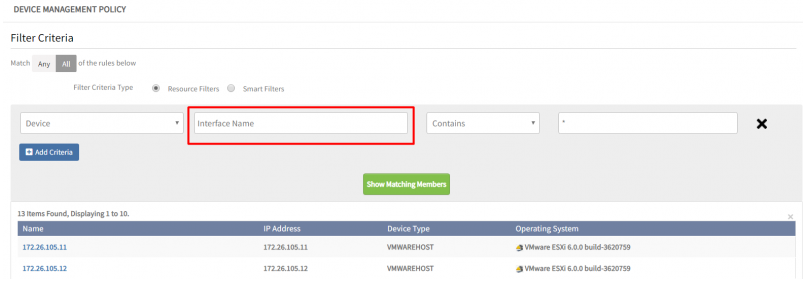
Define device group based on resource interfaces
Azure Blob Store integration for data export
OpsRamp now supports Azure Blob storage. Take advantage of this integration, via the data export feature, to export data to Azure blob storage.
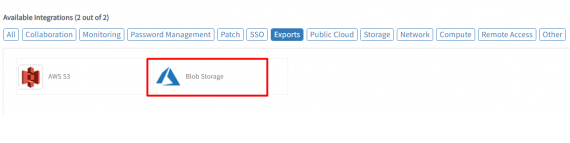
Azure Blob Store integration for data export
Instrumentation Management
Ansible playbook to manage Linux Agent
Perform Agent deployment on Linux machines using Ansible playbooks. This feature helps users deploy and manage agents at scale with greater efficiency. Install agents, switch the agent from proxy to direct and vice versa, update agents, and uninstall agents. Download the Ansible playbook from the Agent download section.
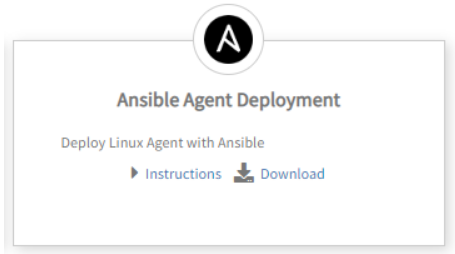
Ansible playbook to manage Linux Agent
Automated Linux Agent deployment for AWS Lightsail
OpsRamp now automatically deploys the Linux Agent onto auto-provisioned AWS Lightsail virtual machines. With this capability, OpsRamp provides visibility into VMs as soon as they appear.
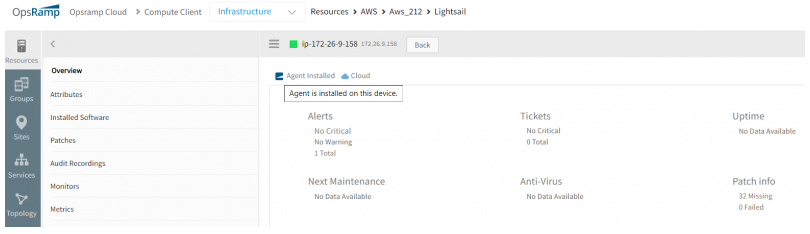
Automated Linux Agent deployment for AWS Lightsail
Changes in Linux and Windows Agent version numbering
The numbering scheme for OpsRamp Agent versions has been changed to align with product release numbers.
Windows Agent Release Version Number:
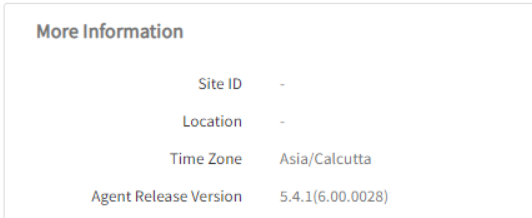
Windows Agent Release Version Number
Linux Agent Release Version Number:
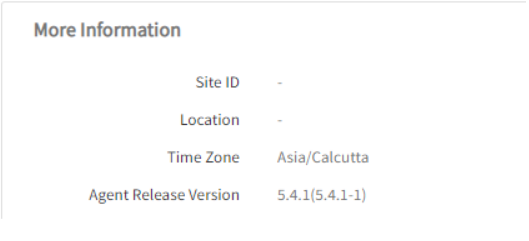
Linux Agent Release Version Number
Agent installation and uninstallation logs
Windows and Linux Agents will now leave the trace of installation and uninstallation logs in the end machine. In the event of installation and uninstallation issues, these logs will give visibility about the Agent and help identify the root cause of the issue.
One-click to enable debug logs on Agent
Set the Agent logs to debug mode from the OpsRamp UI. This makes it easy to temporarily enable debug mode to troubleshoot issues.
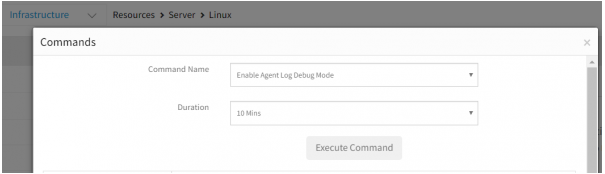
One-click to enable debug logs on Agent
View Agent logs from the UI
Now see Agent logs from the UI using remote commands.
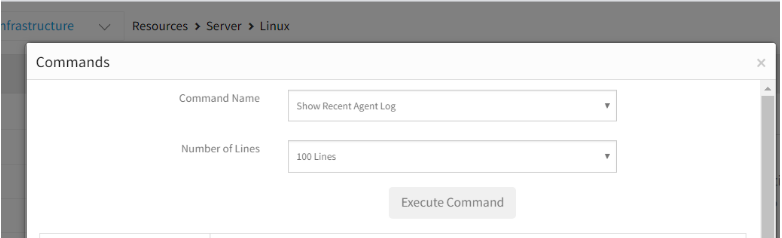
View Agent logs from the UI
Agent Logs
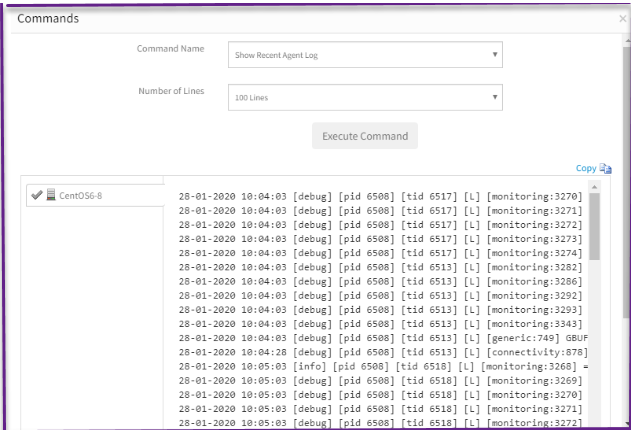
Agent Logs
Release Notifications
A new notification feature is now available in the UI. OpsRamp will communicate product related notifications such as upcoming releases, Gateway updates, and other information through this new channel.
Release Notifications
Example Notification:
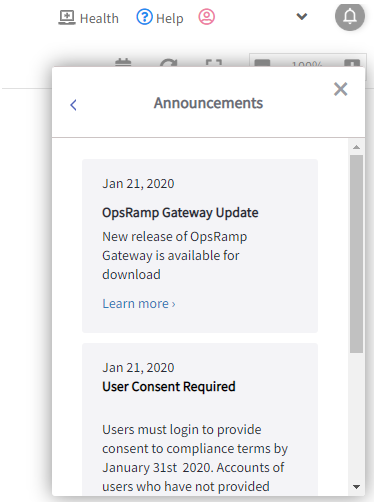
Example Notification
Windows Gateway (Beta)
The OpsRamp Gateway is now available as a Windows application.
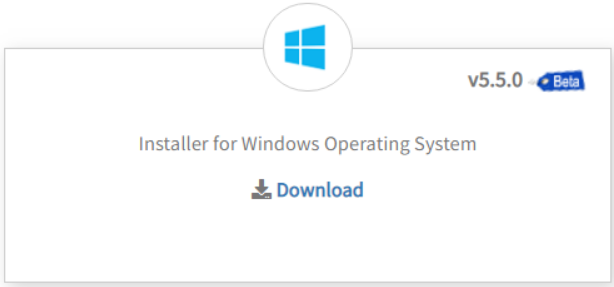
Windows Gateway (Beta)
Manage proxy settings on Gateway
As part of the Gateway security measures, the proxy service on the Gateway can be turned off. Perform this either from Gateway web UI, console UI, or API.
Manage proxy settings on Gateway
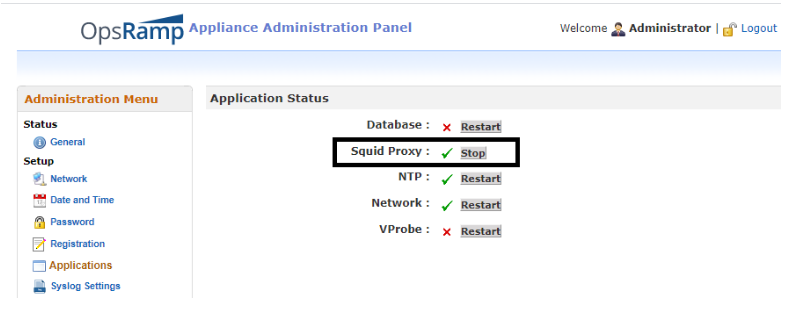
Password change option for “ruser” account on Gateway
You can now change the password of the “ruser” account on the Gateway.
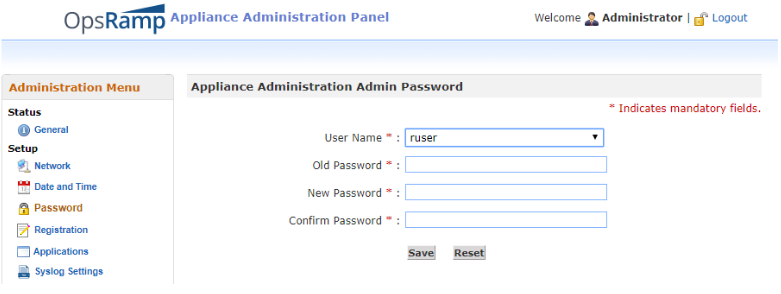
Password change option for “ruser” account on Gateway
Gateway with persistent static IP configuration
By default, the Gateway appliance uses the IP address assigned by DHCP during the installation. Prior to this release, the Gateway did not persist the static IP address assigned in a non-DHCP network, between reboots. Now, the static IP address is persisted across reboots, on DHCP and non-DHCP networks.
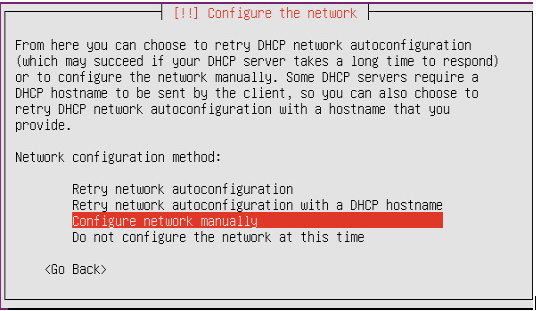
Gateway with persistent static IP configuration
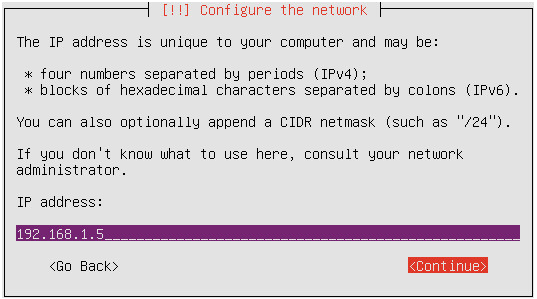
Gateway with persistent static IP configuration
Resource alias IP detection
The OpsRamp Agent is now able to identify all primary and corresponding alias IP addresses on a resource and makes them available in the resource attributes section under “Network Information”. With this, users have visibility into all IPs that are assigned on one or more network interfaces present on a resource.
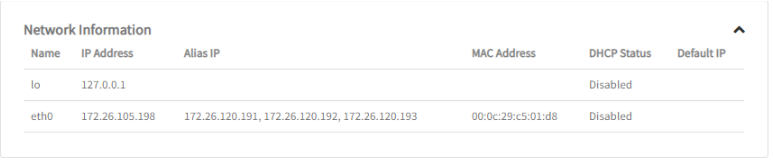
Resource alias IP detection
Access Controls
Restrict access from specific IPs
OpsRamp now provides flexibility for administrators to control access to the OpsRamp UI, based on a user’s IP address. Partner-level administrators can specify a list of IPs from where users can log in to OpsRamp.
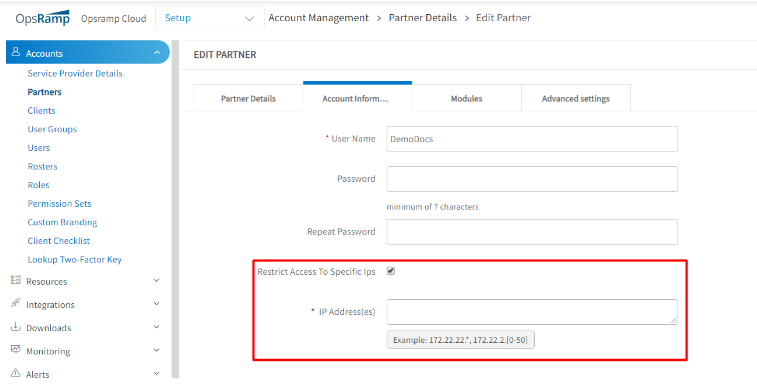
Restrict access from specific IPs
Share Dashboards with Specific Roles
You can now share dashboards with specific roles, making it easier to limit visibility to specific users.
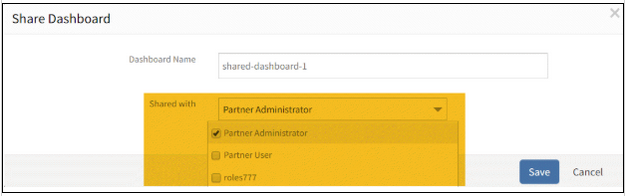
Share Dashboards with Specific Roles
Access Controls for Custom Integrations
Custom integrations now support role-based access controls. Starting with this release, you must associate a role with a new custom integration. The custom integration is accessible only to users with the associated role.
Note: Your existing custom integrations will continue to work as usual. The requirement to associate a role only applies to new integrations created after this release.
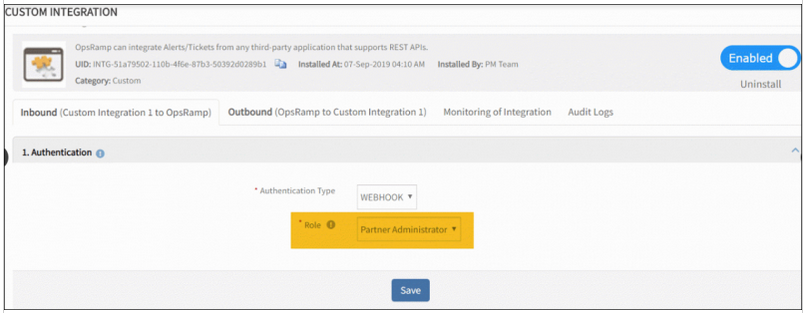
Access Controls for Custom Integrations
Terminate User Action for User Management
You can now permanently remove a user from OpsRamp with the terminate action. Prior to this release, OpsRamp only supported the ability to disable a user. A disabled user could be re-enabled later. With the new terminate option, a user can be permanently removed from OpsRamp. The terminate action erases all record of the user. This action is intended to support “right to erasure” requirements of GDPR and similar regulations.
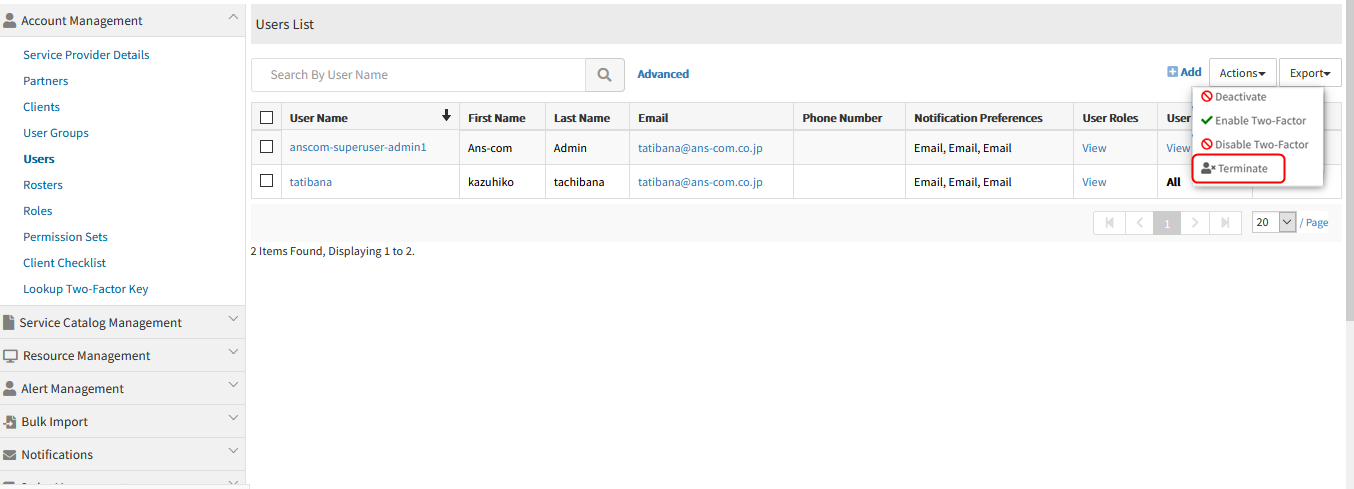
Terminate User Action for User Management
Automated User Provisioning for Azure Active Directory (AD)
OpsRamp integrates with Azure AD to automatically provision and deprovision users. This new integration supports the SCIM standard for automated user management. Using this option, you can now manage your users within Azure AD and configure role mappings in OpsRamp so that users are automatically provisioned with the right role.
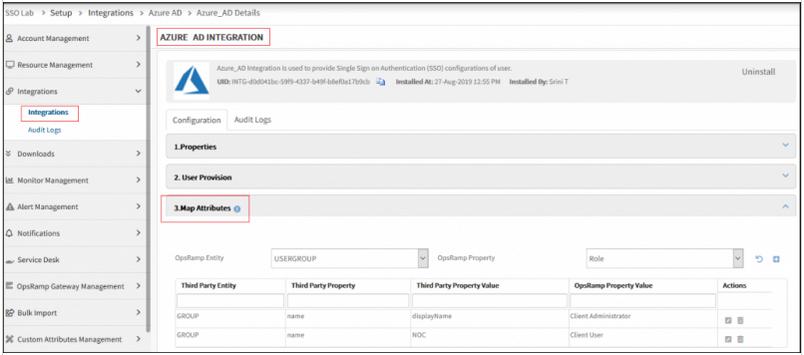
Automated User Provisioning for Azure Active Directory
Resource Management
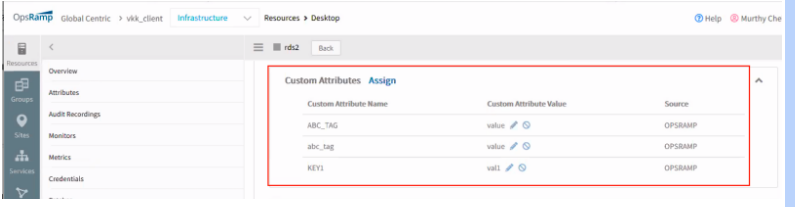
Custom Attribute Assignment Enhancement
Previously, to edit a custom attribute already assigned to a resource, user required to completely remove the value, and then assign a new one. This was a laborious process and created excess steps to assign the designated attributes. Now, users will be able to change the custom attributes assigned to a resource in a quick and intuitive manner.
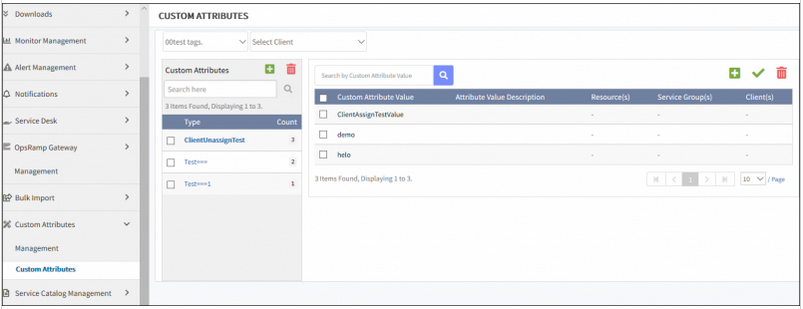
Custom Attribute Assignment Enhancement
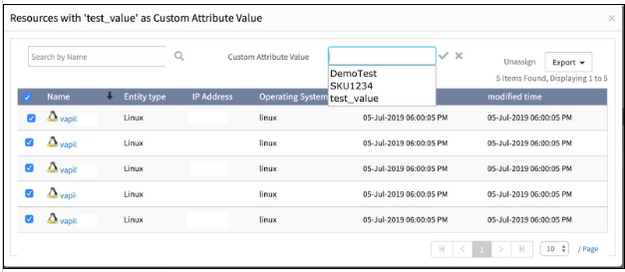
Custom Attribute Assignment Enhancement
Displaying VLAN Number & MAC Address in Neighbors Tab for Network Resources
The user will be able to have context of resource dependencies when troubleshooting network issues.
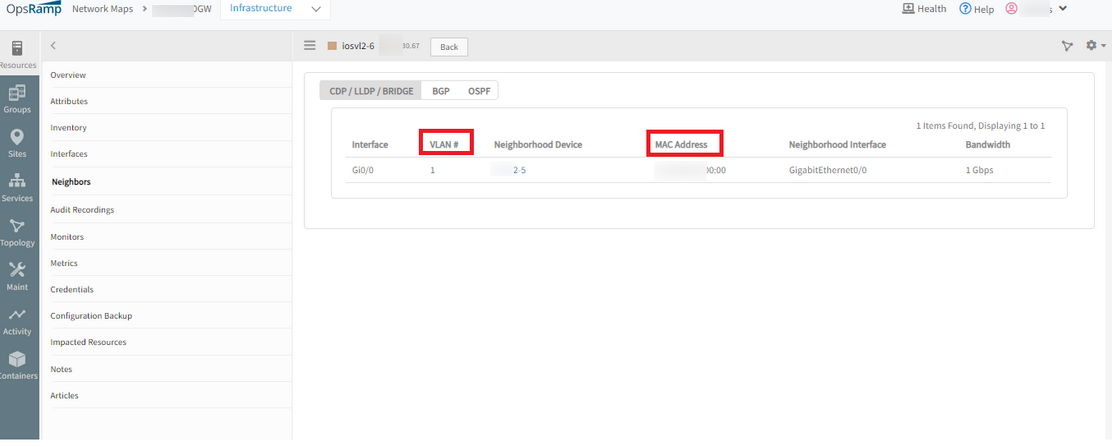
VLAN Number & MAC Address in Neighbors Tab
The user can view the VLAN # and MAC Address columns in Neighbors Tab for Network Resources with CDP/LLDP enabled.
Discovery Profile Completed, but Status shows it is In Progress
The user added an SNMP Discovery Profile, and while the Status was In Progress, there was a Completed TimeStamp.
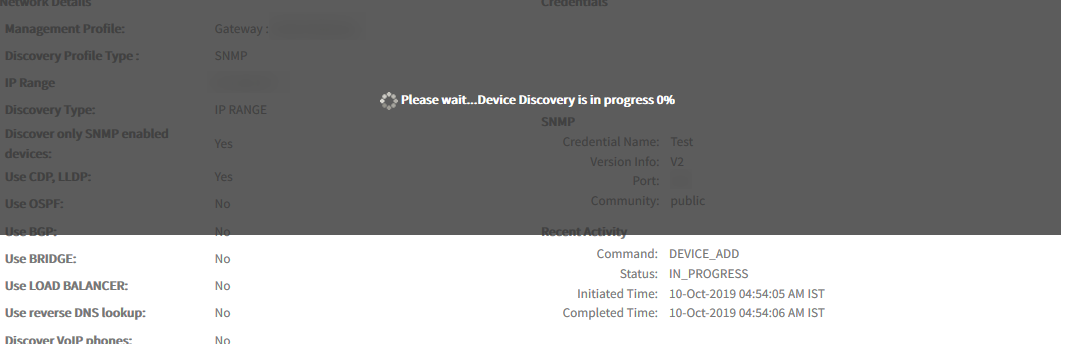
Discovery Profile Completed, but Status shows it is In Progress
Issue is fixed.
Displays the complete time stamp only when the scan is completed.
If the scan fails, then display the last scan Completed Timestamp and the current status as “Scan Failed”.
Hardware/Application details are missing
Hardware and Application details are not getting populated. If the user runs the asset job manually, able to see the details.
Hardware/Application details are missing
Unexpected date format.
Parsing another date format. If any new date format raises, then adding current system time.
Issue is fixed.
Custom attributes are getting applied multiple times on the same device
Custom attributes are getting applied multiple times on the same device
Unable to add devices to an existing scheduled maintenance window
When the user tries to add the device in the Infrastructure page, it does not add the device to the list.
Also, the list of active maintenance windows shows there are 37 devices in the window, but if clicked on it, it shows only 36.
Not removing maintenance resource mappings when resource is deleted.
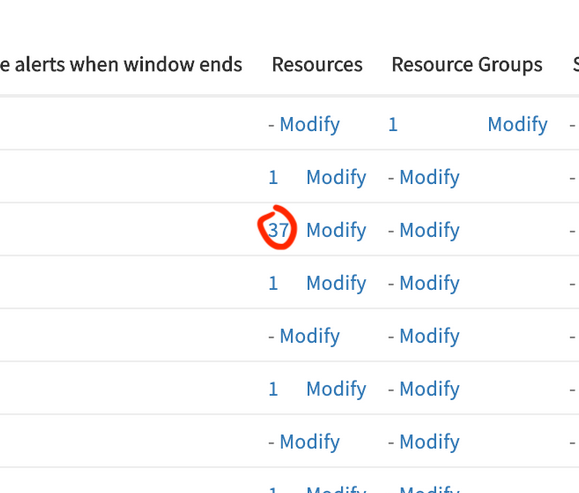
List of active maintenance windows shows there are 37 devices
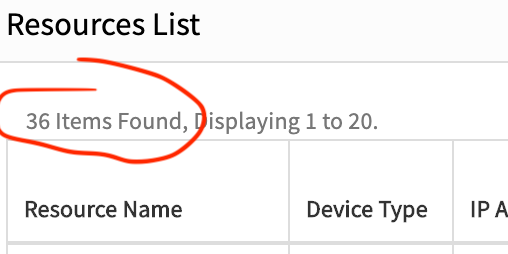
Resources List
Removed the maintenance resource mappings when resource is deleted.
Deleted stale entries. Issue is fixed.
Checked schedule maintenance resources count, it is displaying correctly.
Integrations
Webhook Authentication Support in Custom Integrations
Custom integrations now support webhook authentication. Using this option, you can now use custom integrations to ingest alerts, from any webhook capable tool, into OpsRamp.
Webhook Authentication Support in Custom Integrations
Alert Source in Email-based Event Integrations
Email-based event integrations now support selecting an alert source from a list of predefined alert sources. Using this option, you can track the source of email-based alerts.
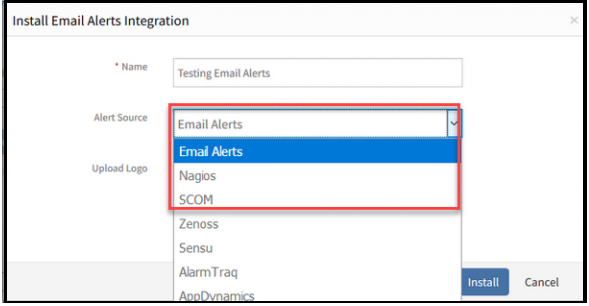
Alert Source in Email-based Event Integrations
VMware integration fails to scan and does not provide list of VMs in the vCenter
All VMs are not visible on the vCenter device. Enabled ‘All resources’ attribute in the ‘Discovery Profile’ for this VMware integration and tried to perform a re-scan. It fails to complete every time the scan is performed.
Credentials are working fine and received no error other than ‘Response processing failed’ error.
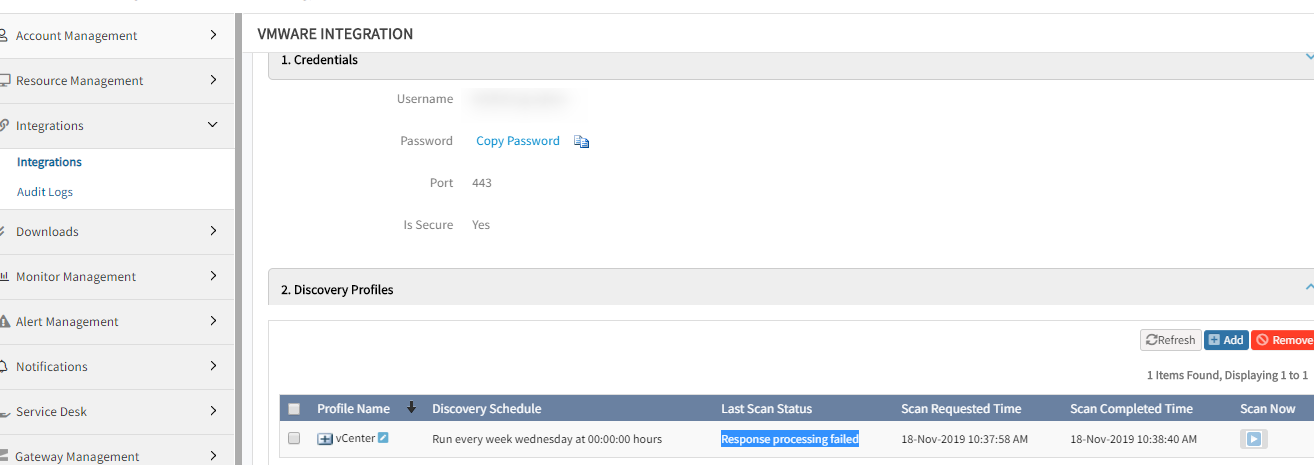
VMware integration fails to scan
Local cache issue. After updating with offline JOB Processor Nodes, this issue is fixed.
All the VMs are displayed properly in the vCenter.
Updated Site name is not reflecting in integration events
The site name is updated in the Site Details page. The updated string is not reflecting when an integration event is triggering from OpsRamp to the 3rd party.
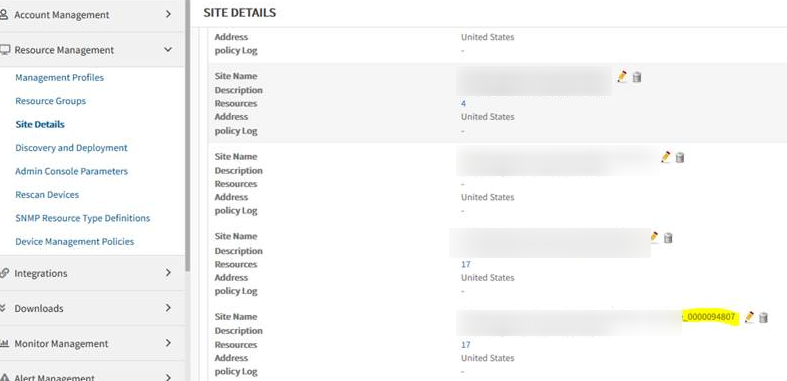
Updated Site name is not reflecting in integration events
Updated Site name is not reflecting in integration events
The memcache key is deleted when the location is updated. Issue is fixed.
The payload is displaying the site details perfectly.
Cannot update ticket by E-mail
Before this POD migration, the user uses E-mail for automatic update in Incident or Ticket change.
After POD migration:
Cannot update ticket by E-mail
Nothing reflecting in ticket as before, the user needs to go to ticket and update in ticket only.
Cannot update ticket by E-mail
Issue is fixed.
Cannot see Patch categorization for Windows servers
Patch integration is not available in Available Integrations.
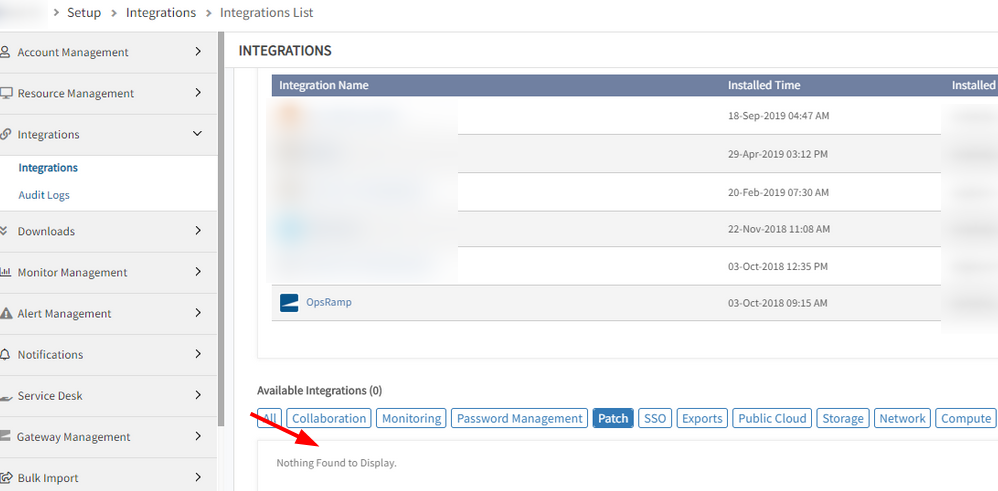
Cannot see Patch categorization for Windows servers
Issue is fixed. Ran the insert query in the Pod.
Able to see the patch app in Available Integrations on Patch category.
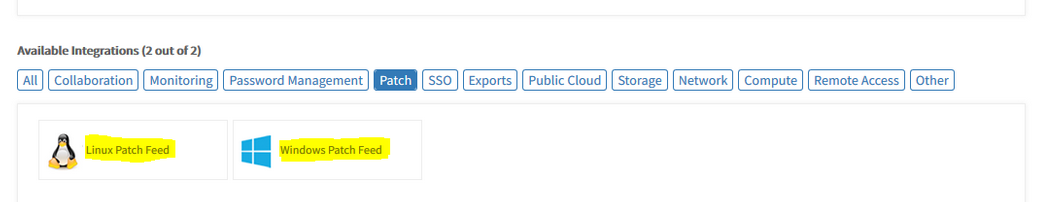
Able to see the patch app in Available Integrations
Knowledge Base
Partner level template monitors are asking to select client while associating a Knowledge Article
Unable to attach article
Issue is fixed. The partner level template monitors do not ask for selecting any client while associating knowledge article.
The user can attach the article successfully.
Service Management
Unable to create Service map if the user has specific clients’ access
After logging in as Partner user, that contains the role with limited clients and limited devices, created a service map by selecting the AWS resources, the list is showing empty, though the rule matches.
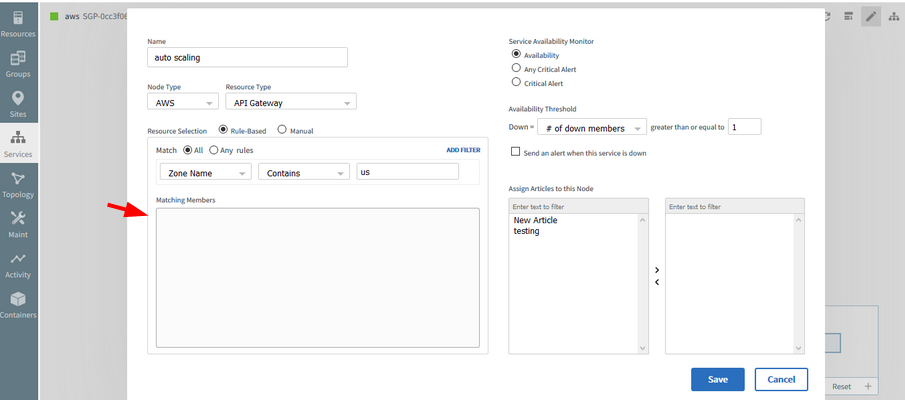
The list is showing empty, though the rule matches
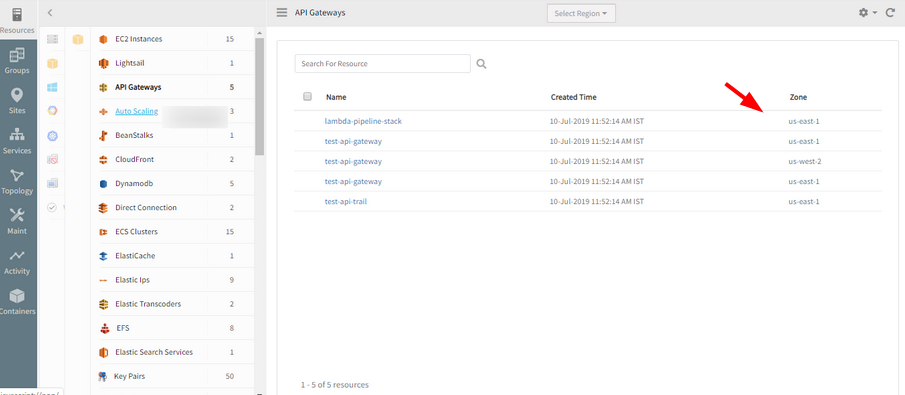
The list is showing empty, though the rule matches
Issue is fixed. The resources list is displayed according to the rule in the service map configuration page.
First Response time shows negative value
Though the user responded within the SLA, the first response time is displayed as -1m 32s.
Only if the user responds after the SLA, the response time should show as negative value.
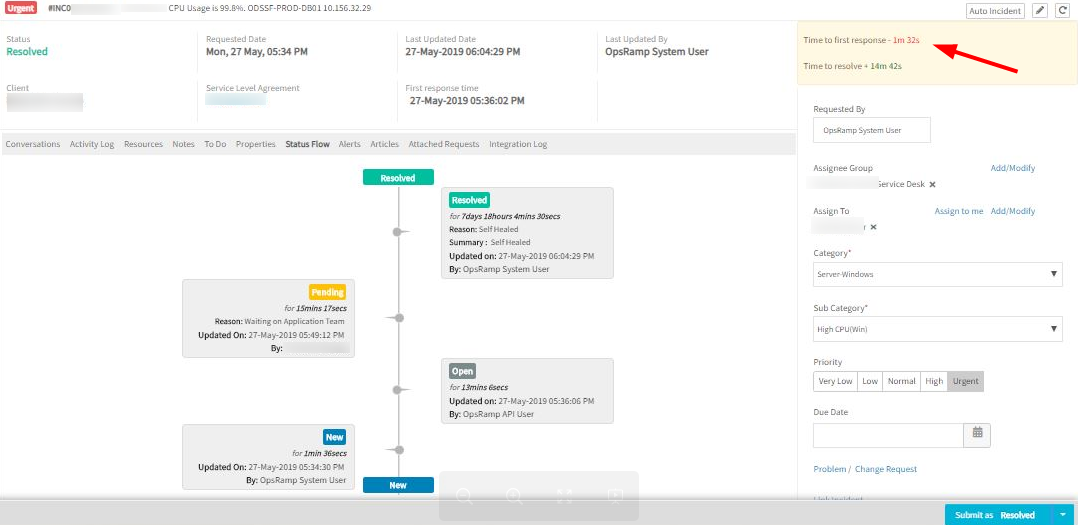
First Response time shows negative value
Issue is resolved. The First Response time is displayed correctly.
API
API that returns only linked child service groups
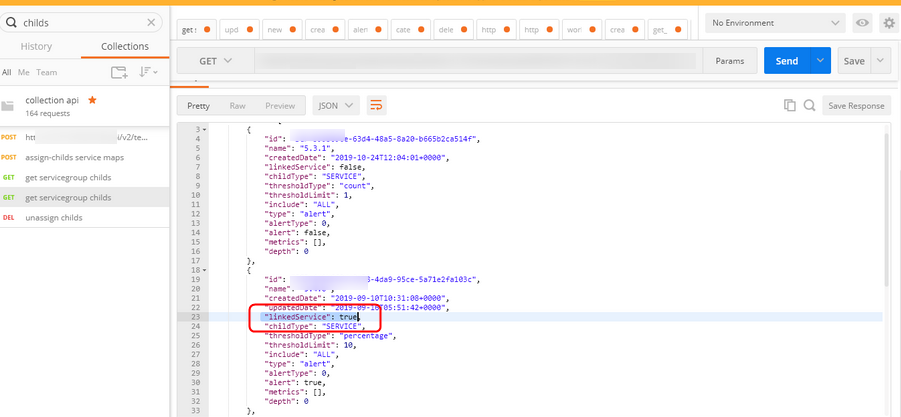
API that returns only linked child service groups
Example: User uses Get Child resources and service groups API to list all the child service groups under a specific parent service group.
The new attribute linked service is a part of Service Groups. The value of linked service is either Yes or No.
The new attribute in response to get service group child’s API “linked service” is true, if the child node is a linked node and false, if not.
Application, Network, and Storage Monitoring
IBM DB2 databases
OpsRamp now includes monitoring templates to monitor IBM DB2 databases through Agentless, Gateway based monitors.
Below is the list of top five metrics that are monitored for IBM DB2 database.
- DB2 Database Status
- DB2 Total Connections
- DB2 Avg CPU Time
- DB2 Maximum Connections
- DB2 Available LOG Size
- DB2 LOG Space Used
Route Information in Synthetics Diagnostics
You can now see information on specific routes behind availability monitoring failures on Synthetics. This enhancement allows you to better triage websites availability issues, by honing in on specific routes and ISPs impacting users’ access to websites.
Route Information in Synthetics Diagnostics
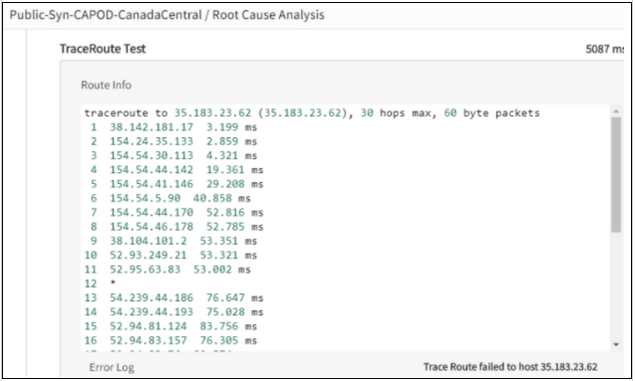
Route Information in Synthetics Diagnostics
Memcached Monitoring
OpsRamp can now monitor Memcached – a common high-performance cache used in modern cloud application stacks.
Supporting Hitachi VSP G200 model
OpsRamp now supports discovery and monitoring of G200 models of Hitachi Virtual Storage Platform G Series.
Cloud Management and Monitoring
Automated Linux Agent deployment for Azure VM Scale Sets
OpsRamp can now automatically deploy the OpsRamp Linux Agent onto auto-provisioned Azure VM Scale Set VMs. With this capability, OpsRamp provides visibility into VMs as soon as they come up.
Automated Linux Agent deployment for Azure VM Scale Sets
AWS
AWS Developer Tools
AWS Developer tools enable teams to create an efficient CI/CD process, and use native integration with other Amazon Web services, such as EC2, Lambda, and EKS. OpsRamp now provides insight into the provisioning and performance of the following AWS developer tools.
- CodeCommit
- CodeBuild
- CodeDeploy
- CodePipeline
Amazon Simple Workflow (SWF)
Amazon Simple Workflow (SWF) is a service offered by Amazon that helps developers build, run, and scale background jobs that have parallel or sequential steps. Amazon SWF can be considered as a fully-managed state tracker and task coordinator in the Cloud. To provide visibility into this service, OpsRamp can now monitor and discover SWF Domains, Workflow Types, Activity Types.
Amazon MQ
Amazon MQ is a managed message broker service for ActiveMQ that makes it easier to set up and operate message brokers in the cloud, helping you migrate your messaging and applications without rewriting code. OpsRamp will now monitor this service and provide visibility into various processes and jobs running within Amazon MQ.
AWS IoT
AWS IoT is a managed cloud platform that lets connected devices easily and securely interact with cloud applications and other devices. AWS IoT can support billions of devices and trillions of messages, and can process and route those messages to AWS endpoints and other devices reliably and securely. OpsRamp will provide visibility into AWS IoT and provide users insight into the availability, connection time, publish time and other critical metrics within the IoT platform.
Google Cloud Platform (GCP)
Event Ingestion from GCP
OpsRamp now provides the ability for users to stream events from their GCP platforms into OpsRamp. This enhancement provides insight into CRUD operations, quota breaches, and other service events that occur with the GCP platform. OpsRamp’s integration with GCP allows users to easily view GCP events within the OpsRamp platform and correlate these events with other alerts generated by the OpsRamp platform.
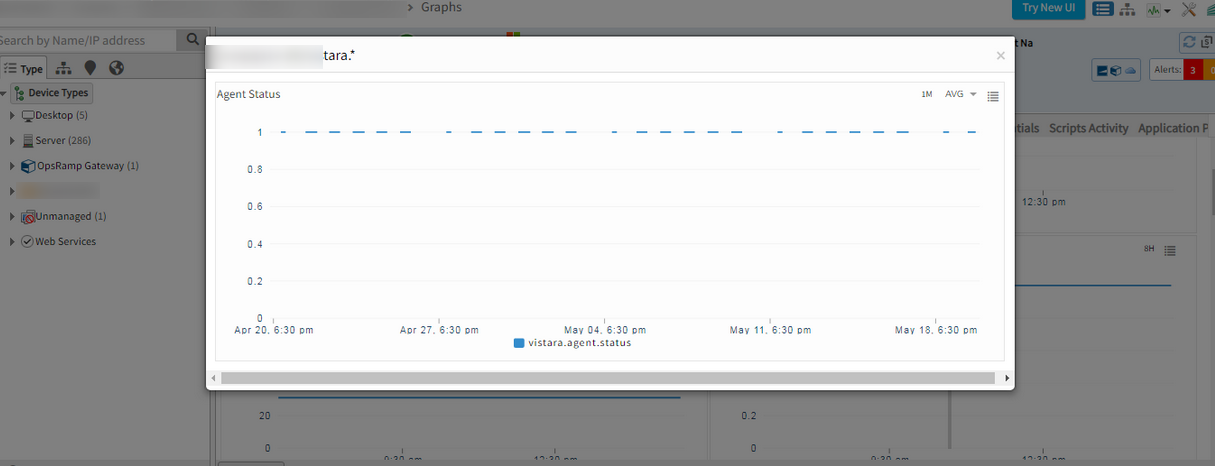
Agent on the device is offline. There is no alert generated for the same
The Agent status monitor is also applied.
Agent on the device is offline. There is no alert generated for the same
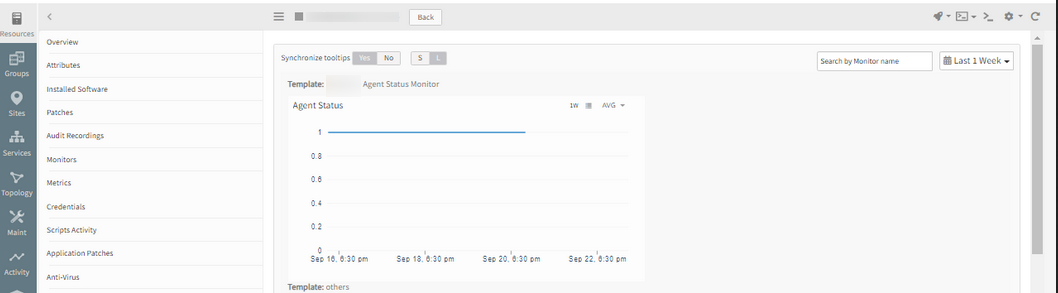
Agent status monitor is also applied
Issue is fixed. The alerts are received when the Agent is offline.
Automation
Issue while running scripts as a System user and Other user
When the user is trying to run some scripts as a System user, it is running as Other user, and while the user is trying to run the scripts as Other user, it is running as System user.
Issue is only while sending data from Cloud to Agent.
If it is System user then sending flag value as 0 and if it is Other user then sending 1 to Agent from Cloud.
Issue is fixed. Changed the code. Values will be sent in the right format.
Remote Consoles
Issue while connecting to RDP
Connection is getting timed out intermittently.
Issue while connecting to RDP
Issue is fixed. The connection node is moved from one firewall to another.
Agents and Gateways
Agent in MSI Format
The OpsRamp Agent is now available as a Microsoft Windows MSI file. Prior to this release, the agent was only available as an .EXE file. The MSI file makes it easier to install the Agent on Windows systems using common software deployment tools.
Agent in MSI Format
Core Platform
Linux Agent not getting installed during Azure API Discovery
User has Azure integration, and from the Discovery, it was configured to install the Linux Agent on the devices, but agent did not get installed. It showed a message.
Linux Agent not getting installed during Azure API Discovery
Issue is fixed. Installing integration while saving Discovery profile.
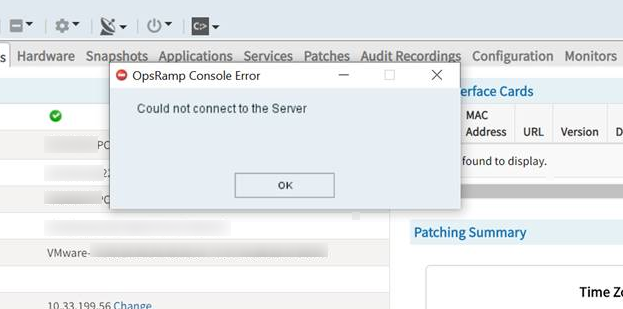
Unable to open alert in the portal
Unable to open alert in the portal
Issue is fixed. Able to view the alert successfully.
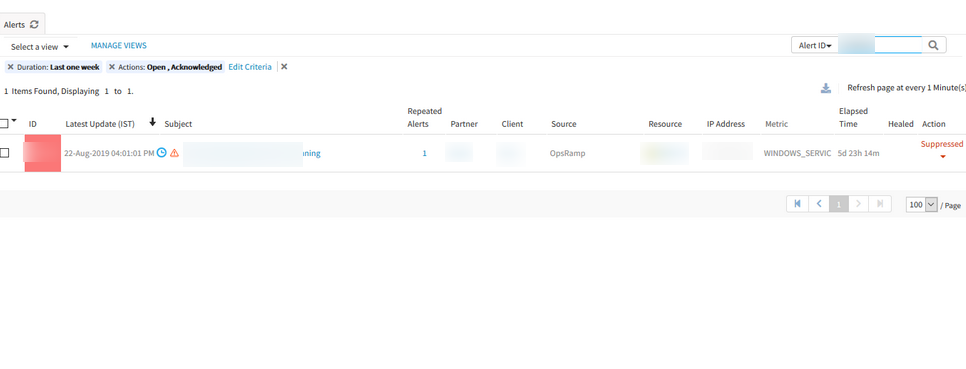
Able to view the alert successfully
Patch Management
Patch compliance visibility at OS patch level
The patches tab for each device now supports baseline as a filter. With this option, you can see the missing patches relative to a baseline.
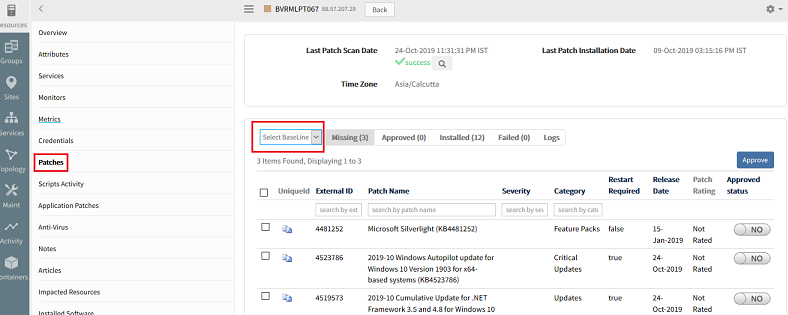
Patch compliance visibility at OS patch level
It will show the included or excluded patches. If suppose the user included 3 patches; 1 is missing, 1 is installed and 1 failed, then the user can see them accordingly as, under Missing tab can see 1 patch, under Installed tab can see 1 and under Failed tab can see 1 patch.
Deprecated Features
The features below are no longer available in OpsRamp:
Classic Infrastructure UI
See Deprecation Notices for more information
SSLv3 and RSA_with_RC4 Ciphers from NetApp Filer
See Deprecation Notices for more information
SNMP Trap Filters
SNMP Trap Filters are replaced with the new SNMP Trap Configuration module available under Monitoring Management in the Setup section. See Deprecation Notices for more information
Removal of Download to PDF option for knowledge articles
Download PDF menu option has now been removed from the knowledge base articles UI. See Deprecation Notices for more information
Bulk Import option
The Bulk Import feature is no longer available. Use resource APIs to add, change and remove resources in bulk.
Alert integrations
The following integrations are removed from the available list and alternatives are recommended.
| Integration | Alternative integration |
|---|---|
| OpsManager | Custom integration |
| DELLCOMPELLENT | Email Integration |
| SAP Solution Manager | Email Integration |
| New Relic Legacy | Use the latest New Relic integration |
User accounts without GDPR consent are disabled
Accounts of users who have not consented to OpsRamp’s implementation of GDPR policies have been disabled. Please contact OpsRamp Support to reactivate your account.
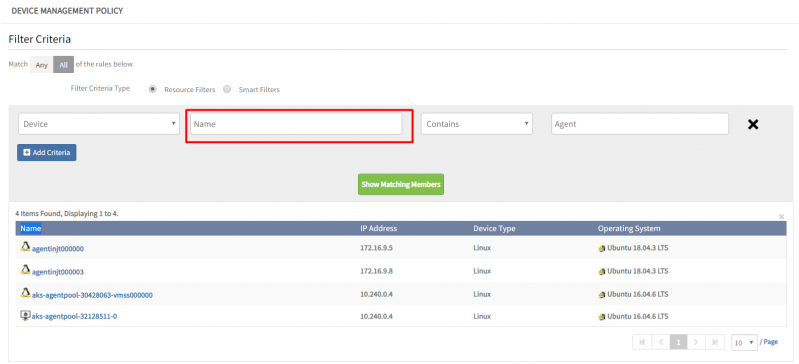
Order of Execution in Device Management policies
The order of execution currently in device management policies will be removed. This change will have no impact on existing behavior or performance of device management policies.
Service Map UI Changes
In accordance with the deprecation of the classic infrastructure UI, there will be several changes to the creation of service maps.