Release Date: December 2020
Introduction
We are excited to announce our 7.0.0 update! Our focus for this release has been for end users to find and manage resources. For administrators, we have provided visibility into the algorithms status and extended the depth of our hybrid monitoring.
Highlights include:
- Improved synthetics with breakdown of transaction latency and HTTP header logs.
- Expanded support for Amazon AWS, covering twenty-two new services.
- New Advanced search on the managed resources.
- New process automation framework that includes integration with Ansible.
- Browser based console to simplify logging into devices. Visibility into how the underlying algorithms work and their operational status.
Dashboards and User Interface
Advanced button on the Templates page does not work for the second time

Advanced button on the Templates page does not work
When the user performs a search action the style attribute values are not changing.
Changed the style attribute values. Issue is fixed.
Unable to view the Automation scripts
Scripts and categories are not visible.
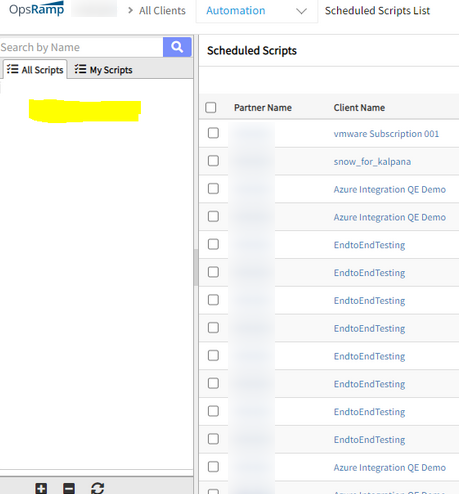
Unable to view the Automation scripts
Issue is fixed. Scripts and categories are visible on the SP, Partner and Client users.
Unable to view Active Directory (AD) Dashboard tab in the portal
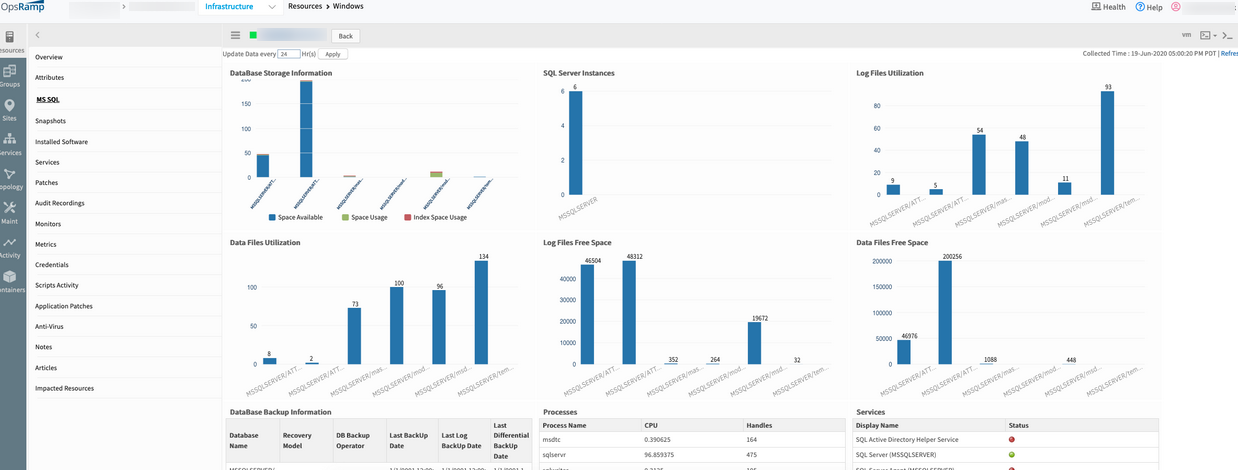
Unable to view Active Directory (AD) Dashboard tab in the portal
During bundling changes, AD got missed from hybrid discovery and monitoring module. Added AD to the hybrid discovery and monitoring module.
Issue is fixed. AD tab is visible in the Infrastructure tab.
Metric graph data is not populating data when clicked on it/Zoom/Scroll over
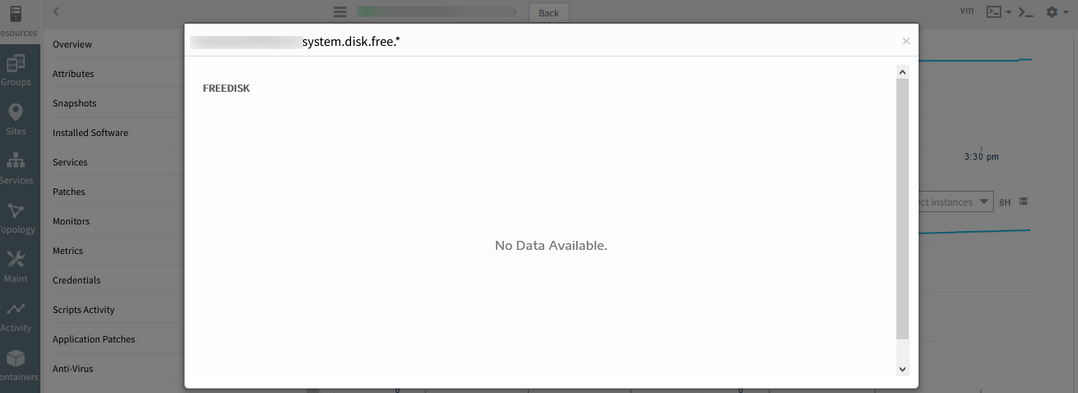
Metric graph data is not populating data when clicked on it/Zoom/Scroll over
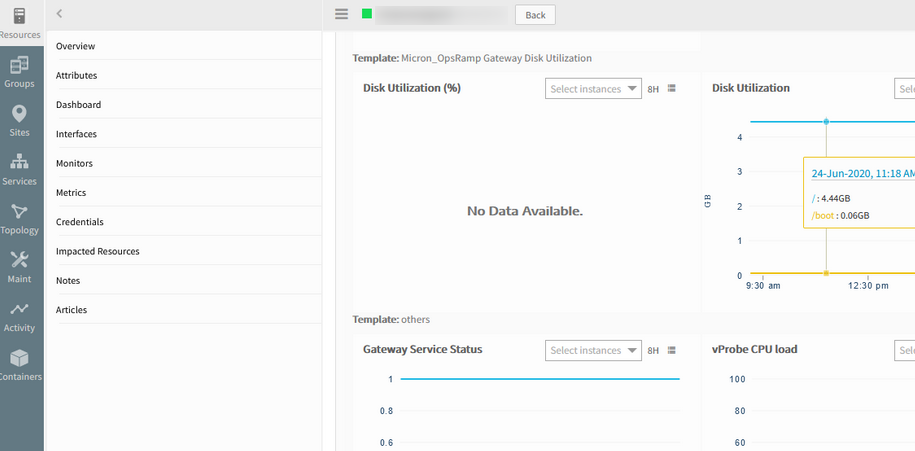
Metric graph data is not populating data when clicked on it/Zoom/Scroll over
Issue is fixed. Metric graph data is populating properly on all the above actions.
In Alert Browser, when setting time to 12 PM and applying, it reverts to 12 AM
If the user sets the criteria and specifies a time and chooses 12 pm (or any time between 12 pm and 1 pm), and clicks Apply, it will set the time to 12 am instead.
Set From Date to 12:30 pm:
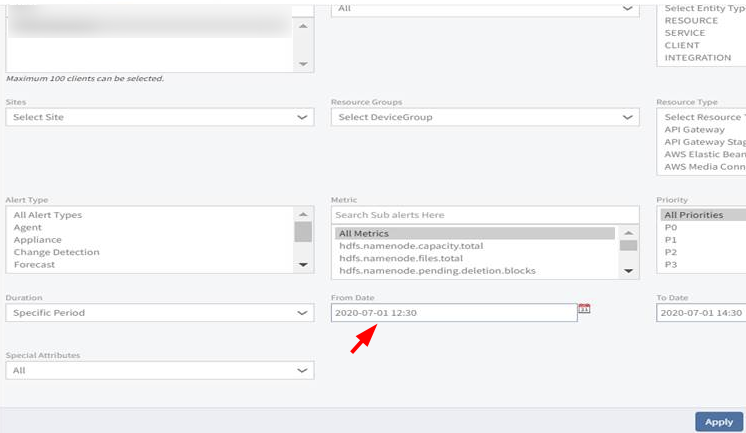
Set From Date to 12:30 pm
After clicking Apply:
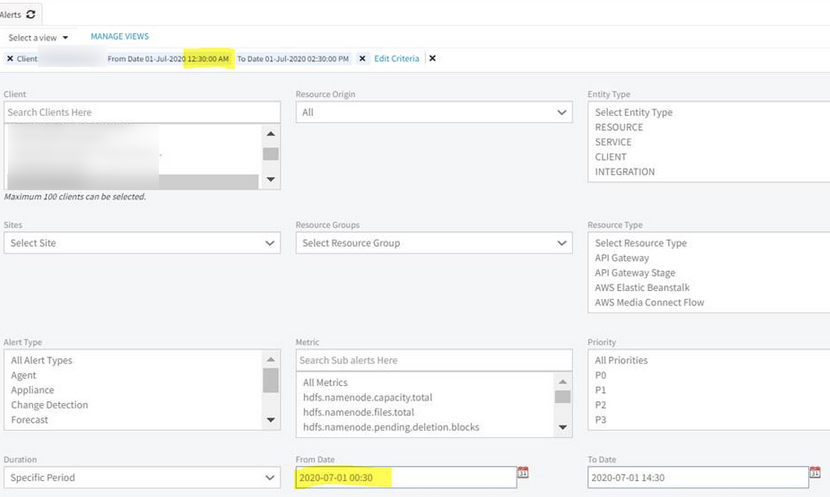
After clicking Apply
Alert browser filter was working fine for all hours’ criteria, except 12:00 PM to 12:59 PM.
Because of browser filter time zone (24 hours format) it is converting to UTC with wrong date (that is, it is considering wrong conversion when Time zone is between 12:00 PM and 12:59 PM).
Set the converter for 24-hour format. Able to set the specific time.
Issue is fixed.
Dashboard metric instance selection not showing results
User creates or edits a dashboard widget metric list or metric series and tries using the “select instance” option. There are no results for instances.

Dashboard metric instance selection not showing results
It supports only for Devices/Resources but does not support Device Groups/Service Groups.
Given support for Groups as well.
While adding a widget, there is an option to select “All Resources” in ResourceType dropdown. Given support for the remaining Resource Types in the dropdown and Groups, but not for “All Resources”.
Issue is fixed.
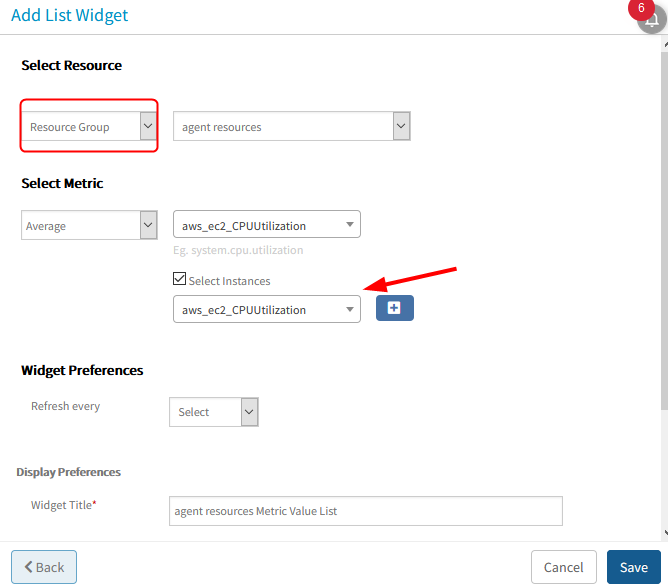
Dashboard metric instance selection is showing results
Global Asset by Resource type widget shows two types
The Global Asset by Resource type widget is showing two types, namely Other and Others, which is not clear, or creates confusion.
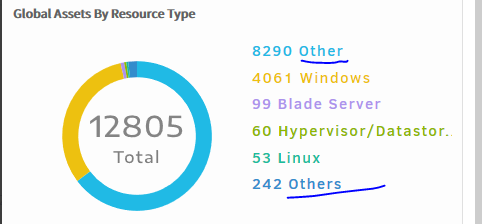
The Global Asset by Resource type widget is showing two types, namely Other and Others, which is not clear
“Other” is one of the resource types, in which unknown device types are available. “Others” is provided in Global Asset By Resource Type widget to show Other available resource types count.
Issue is fixed. “Others" is changed to “All other Resource Types”.
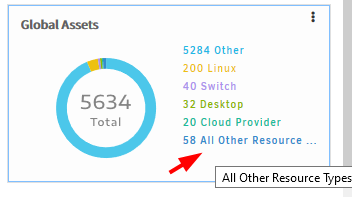
Others” is changed to “All other Resource Types
Monitoring Management
Template-based monitoring
Template-based monitoring is enhanced to support filtering at the component-level including:
- Filtering components for monitoring purposes.
- Setting up differential thresholds based on the component type.
Note
Both agents and gateways support component-level filtering and thresholds.See Using Templates, Component filters and component level thresholds for prerequisites and more information.
Agent-based G2 custom monitoring
Agent-based monitoring supports the creation of new G2-based templates including the following application types:
- Application type: Script Executor (also called: Remote Script Executor)
- Supported programming languages: Shell, Powershell and Python
- Supported operating systems; Windows and Linux
The new RSE type monitor:
- Allows the collection of multiple metrics with a single script invocation at the monitoring-level.
- Brings parity between agents and gateways in defining new custom monitors and templates.
Agent-based process monitoring templates
New monitoring templates are introduced to monitor various system and application-level processes present in Windows and Linux resources. These templates support monitoring of various processes with different thresholds.
See Monitoring using Agent-based Windows and Linux Processes for more information.
Note
SQL-managed instances are a new resource in Azure.Automatic deployment of agents on Amazon WorkSpaces
Linux agents are automatically deployed on auto-provisioned Amazon WorkSpaces instances. Automatic deployment allows instances to be onboarded as soon as they are live.
Devices status is showing Unknown
Ping stopped. “Nothing found to display”. Ping graphs are showing up when the ping template is reassigned or when the Gateway management profile is reassigned at the Device Edit option.
Also, there are 343 unknown resources where ping monitor data is not received.
Issue is fixed. For unknown devices there is no monitoring configuration in Gateway db. So, monitoring failed. Devices went to unknown state.
Found thread blocking in Gateway. To avoid this problem, Gateway thread pool size has been increased and the Jar replaced in Customer’s gateway.
Alerts are generating for alarms whose alerting has been disabled with Gateway 5.4.0
Alerting has been disabled on metric vmware.vcenter.alarm.VCServerHealthAlarm. Still alerts are being received.

Alerts are generating for alarms whose alerting has been disabled with Gateway 5.4.0
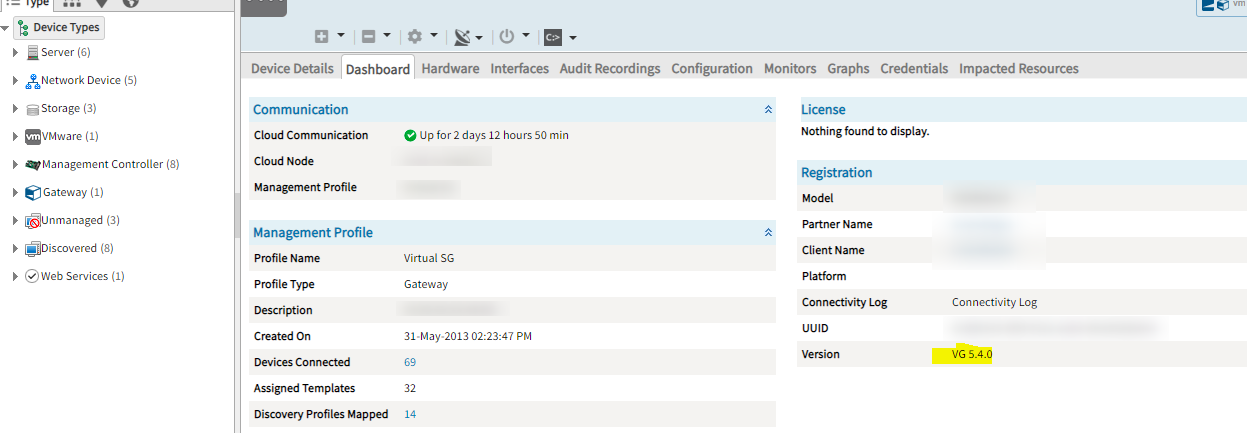
Alerts are generating for alarms whose alerting has been disabled with Gateway 5.4.0
Issue is fixed.
Alerts are not generated now.
API
Device Management Policy created via API with invalid template names does not throw any error
While creating a Device Management Policy through API, the ASSIGN MONITORINGTEMPLATE action was added in the payload and used invalid template names. The request was processed successfully, and the policy was created. There is no error generated for the invalid templates.
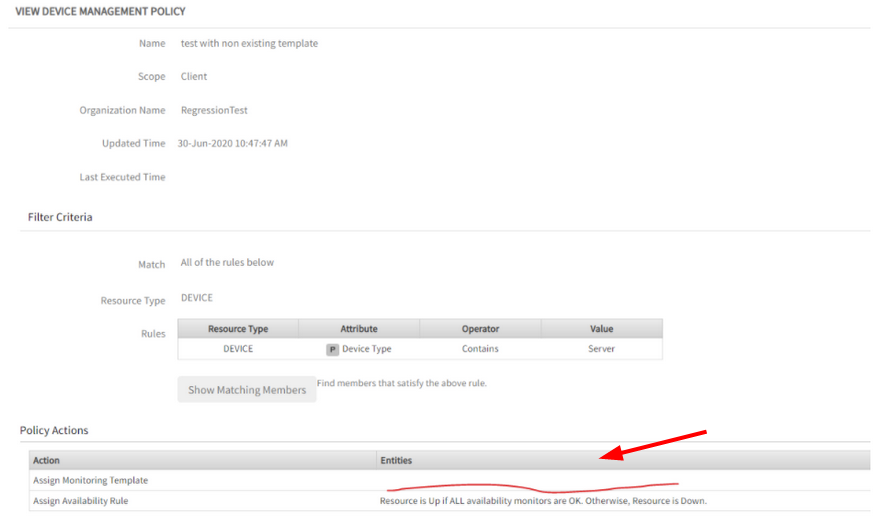
Device Management Policy in the UI with an empty area in the templates section
The above screenshot is showing the created Device Management Policy in the UI with an empty area in the templates section.
Existing validation of ASSIGN TEMPLATE action fails to check the invalid template name.
Issue is fixed. The policy cannot be created with invalid template name/id, and an error message will be displayed.
API is failing to retrieve metrics
API for providing metrics information from OpsRamp is failing to retrieve metrics details for most of the devices whose classCode is device.
Added a null check to two metric management APIs.
Issue is fixed. Receiving the API response.
Alerts Search API is returning 500 Error
Returning 500 Internal server error with below error message:
{“code”: “0005”, “message”: “java.lang.NullPointerException”}
Issue with null pointer exception. Handled null pointer exceptions.
Issue is fixed.
API Enhancements
Improved create alert API
Create alerts functionality now returns the event ID (as a reference) to alerts that will be created after OpsRamp processes the event. Alerts associated with an event ID can be retrieved by using the get alerts by event ID API.
API response for process monitoring
The search template API has been enhanced to display details about the process monitors that are applied to a resource.
Search Resource API
The Search Resource API provides a consistent experience when using the attributes, AliasName, HostName, and Name. When those attributes are used as the search query, the API searches for the respective attributes on the resource.
Integrations
Improved Integration Events for ServiceNow
Sites have been enhanced to consistently send Integration events when resources are managed within OpsRamp and ServiceNow. As a result, actions like delete or update performed in OpsRamp are reflected more accurately in ServiceNow.
Monitoring Integration update
The Cradlepoint monitoring integration has been enhanced to display an error when invalid credentials are provided. OpsRamp’s AWS, Google Cloud Platform, and Microsoft Azure integrations have been enhanced to validate credentials that are either not valid or contain spaces. This improves visibility of validation-related errors.
Webhook-based integration is added for:
- Zendesk
- Freshservice
Patch Management
Patch Management Enhancement
The Patch Approval page has been enhanced to show Severity of the patch to let administrators have a high-level view of the patches to be approved (or unapproved).
Unable to view Application patches in the Portal
Two entries were created for 7-Zp 64-bit in App Audit XML. But from the Agent logs able to capture application information from the device.
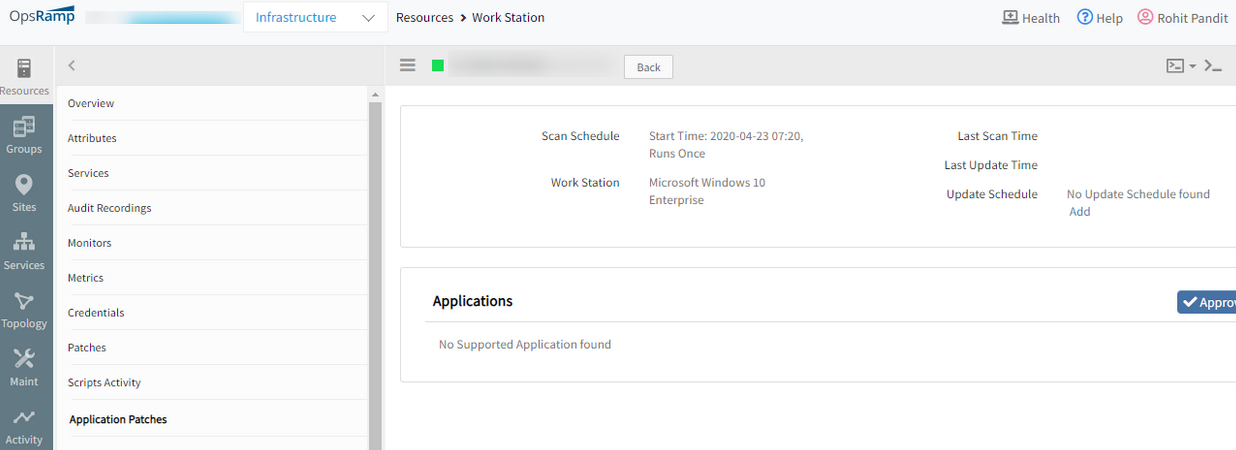
Unable to view Application patches in the Portal
Issue is fixed. Eliminated duplicate entries in app audit XML for 7-zip 64-bit.
Now the application patches are displayed in the Application Patches tab on the portal.
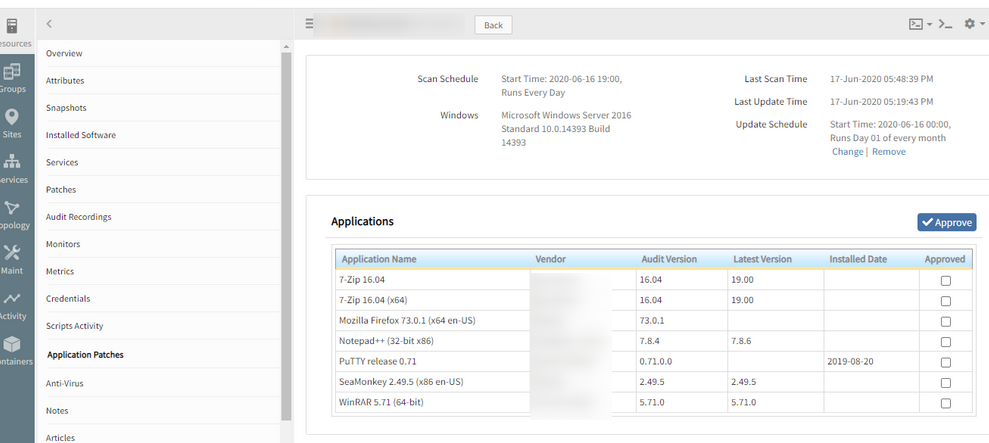
Now the application patches are displayed in the Application Patches tab on the portal
Manually installed patches are not getting categorized
Patches that are manually installed in the servers are not getting categorized.
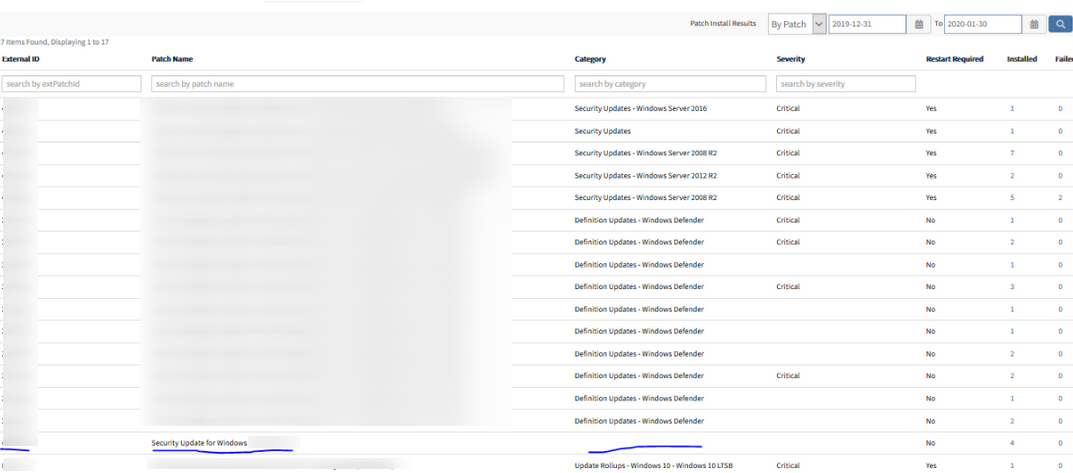
Manually installed patches are not getting categorized
Issue is fixed. Category name is displayed.
Discovery and Monitoring
Unable to discover HPUX servers using Private keys as credentials
Uploaded private keys as credentials and created a discovery profile by attaching those keys to the profile. After scanning the resources, SSH is showing as not connected, though correct keys have been provided.
Issue is fixed. Able to discover the HPUX servers.
Previously, the order is: Password, Keyboard Interactive and Key Pair. Null is sent, if no password is found, and due to which there is null pointer exception.
Now, changed the order of preferences of the Arguments, to Public key, Password, Keyboard interactive.
AWS discovery scan has not run properly
Gateways are not getting attached to new AWS instances that are being created. Custom attributes not getting assigned.

AWS discovery scan has not run properly

AWS discovery scan has not run properly
Getting into infinite loop in case of pagination. Fixed infinite loop.
Issue is fixed. The scan is completed, and custom attributes populated.
Device Interfaces are missing in the portal
Enabled monitoring interfaces are not populating in the portal for two devices after Discovery.
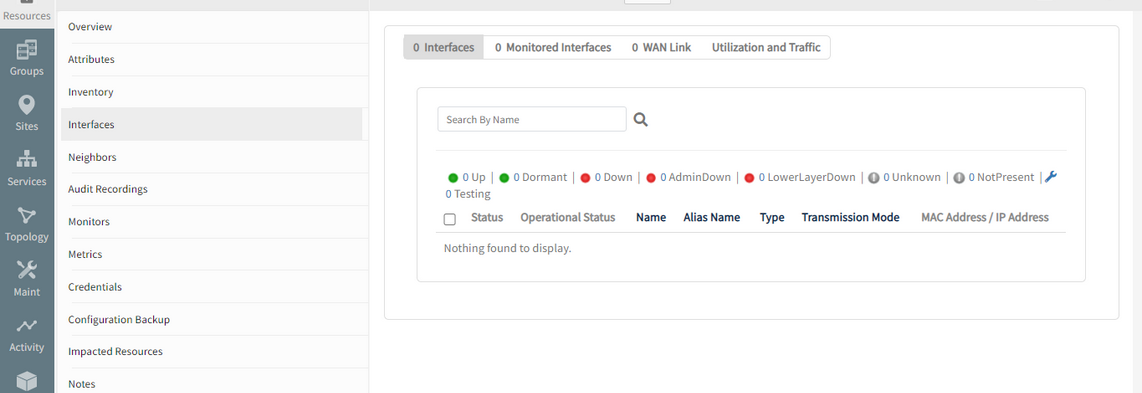
Device Interfaces are missing in the portal
Issue is fixed. Discovered devices are sent to cloud every 30 seconds before and after Topology discovery.
Able to see the interface details for the devices.
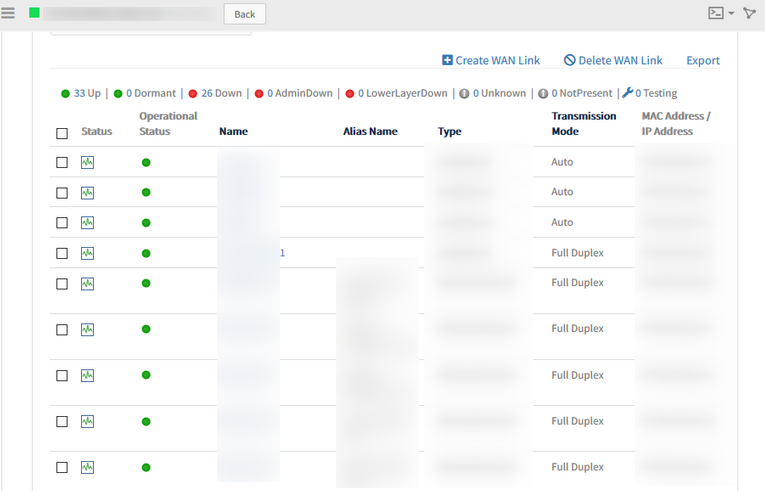
Able to see the interface details for the devices
Improved synthetics
For more information:
- See SCRIPT – HTTP Synthetic Transaction Web Service Monitor for more information.
- See SCRIPT Transaction Steps for more information.
Latency breakdown by step
Building off OpsRamp’s 5.5.0 Release, synthetics now include a breakdown of transaction latency by each step in the transaction. Administrators can now get insight into synthetic transaction performance and easily identify steps that contribute to latency.
This identifies and resolves issues much faster.

Latency breakdown by step
Customizable transaction steps
The name of each step in a recorded transaction can be customized. Administrators can name transaction steps to denote logical steps that a real user would take in interacting with a website. This helps administrators to easily relate transaction performance to user experience.
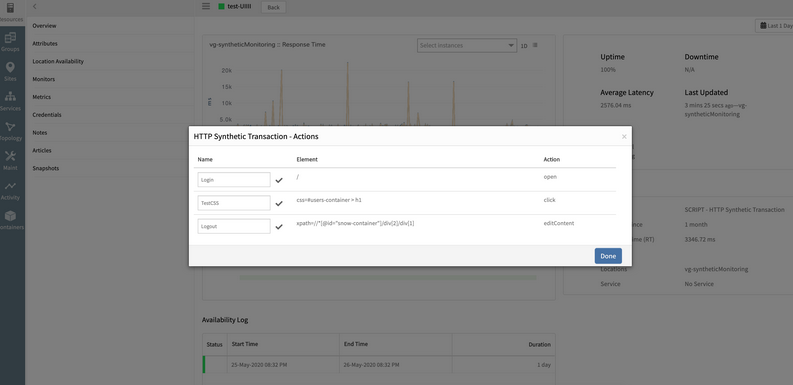
Customizable transaction steps
HTTP response header logs
Synthetics automatically capture HTTP response header information on failed transactions. This quickly identifies the root cause of failures.
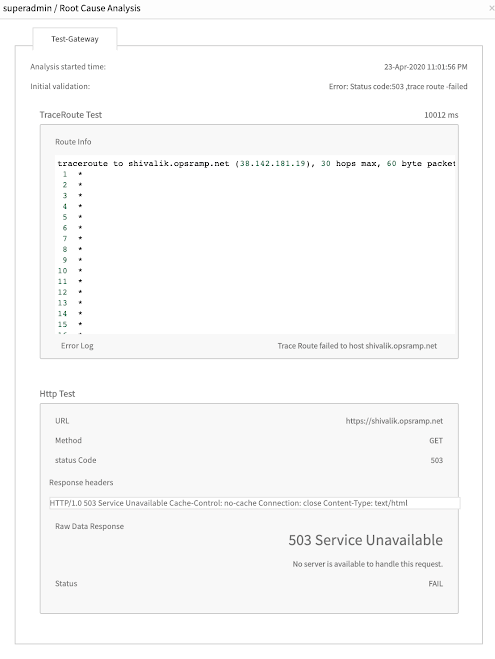
HTTP response header logs
Credentials store support
Credentials in OpsRamp’s credentials store can be used within script-based synthetics. This protects against the risk of accidental exposure of website passwords through transaction recordings.
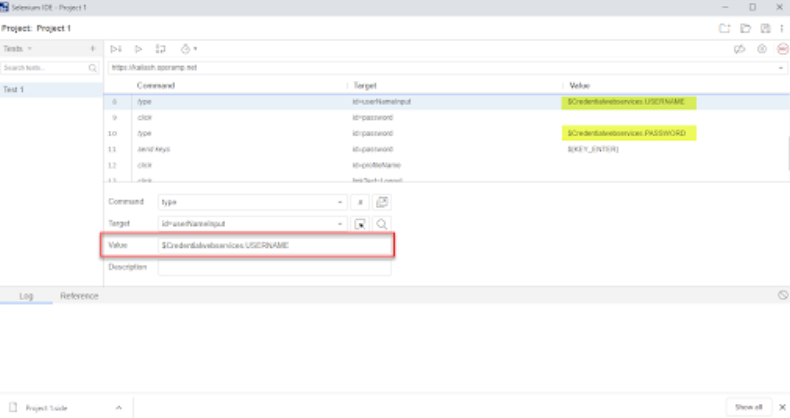
Credentials
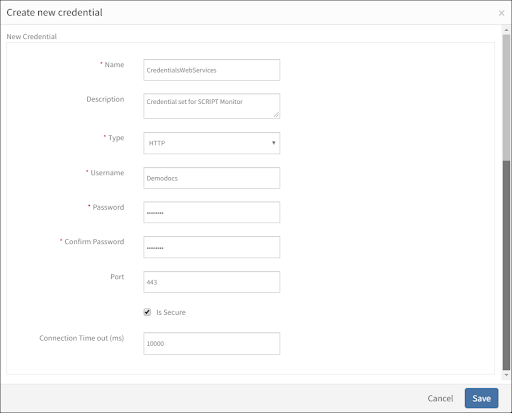
Create new credential
Cloud monitoring / Cloud native monitoring
AWS Services
OpsRamp can discover and monitor more AWS services. Additionally, existing monitors for all AWS services have been updated to collect newly published metrics.
See the Support Matrix for more information.
| Services | More Services |
|---|---|
|
|
Canonical metric names
OpsRamp’s monitors for AWS and Google Cloud Platform services present metrics in a new canonical naming convention. This makes it easy to interpret metrics and configure dashboard widgets.
See Deprecation Notices for more information.
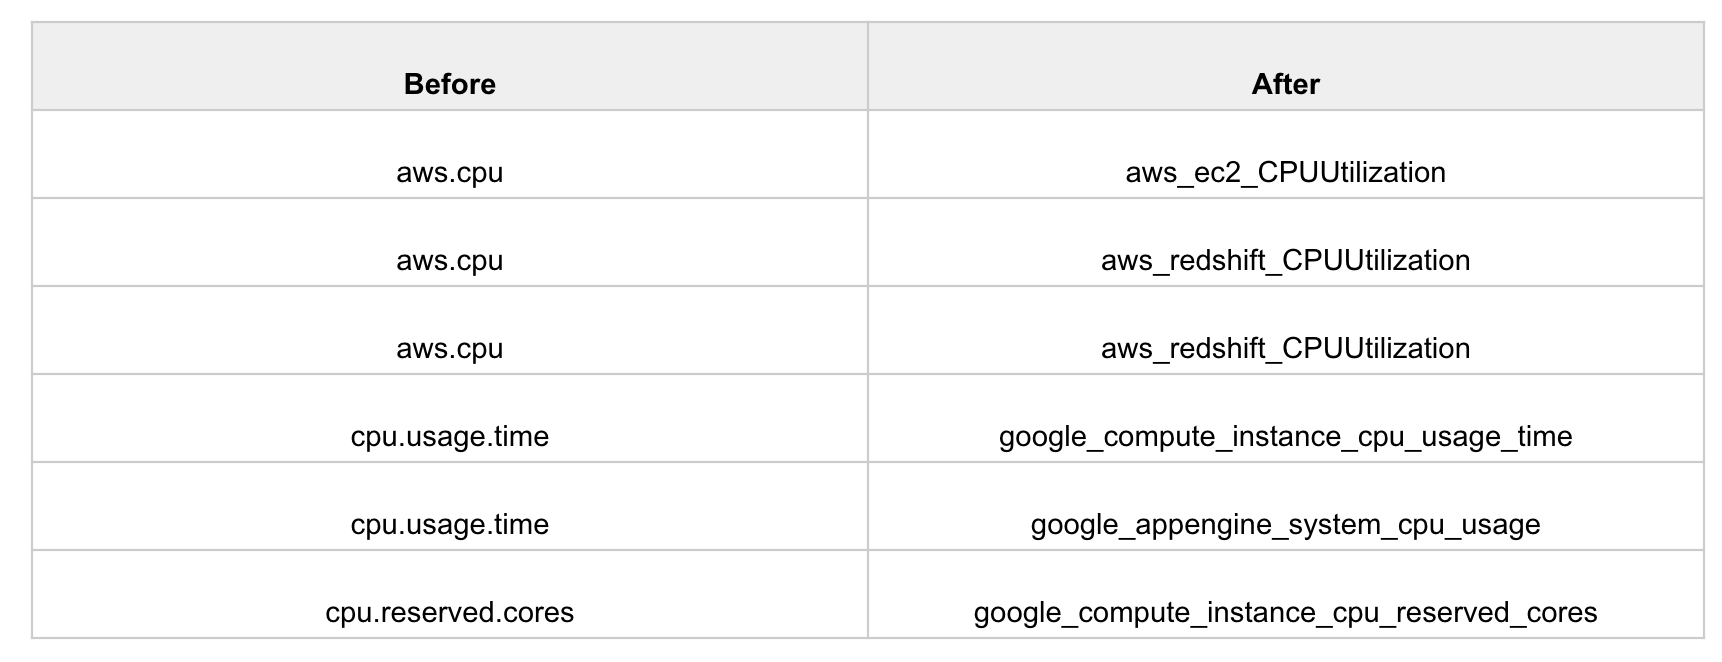
Metric Notation Change
Advanced resource search
Advanced search is available on the managed resources. This includes:
- Composition search criteria using AND and OR.
- Search by native attributes.
- Search by custom attributes.
- Listing page for search results.
See Advanced Resource Search for more information.

Advanced Search Example 1

Advanced Search Example 2
Improved navigation between topology and service maps
This improvement builds on the last release. See 5.5.0 Release for more information.
Improved pivoting between service maps and topology maps includes:
- Adding topology maps nodes from within a service map.
- Switching to a topology map from a service map.
See Service Maps Overview, Topology Explorer Overview, and Topology Explorer UI Overview for more information.
Improved agentless custom monitors
Agentless (gateway-based) custom monitors can use custom attributes and resource credentials from OpsRamp’s credentials store.
Generic agentless custom monitors can be written that automatically collect the right metrics, based on custom attributes assigned to a resource. Additionally, credentials no longer need to embedded within custom monitors.
See Setting up Agentless Monitors for more information.
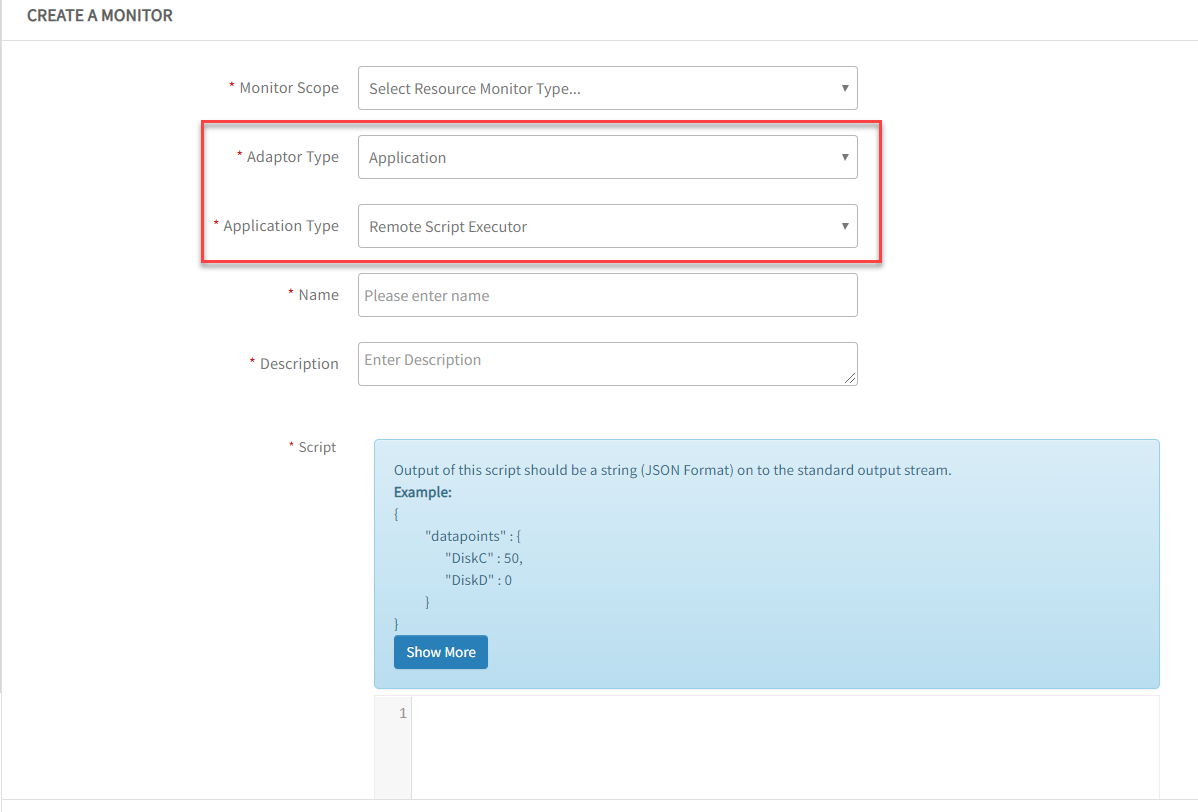
Create a Monitor
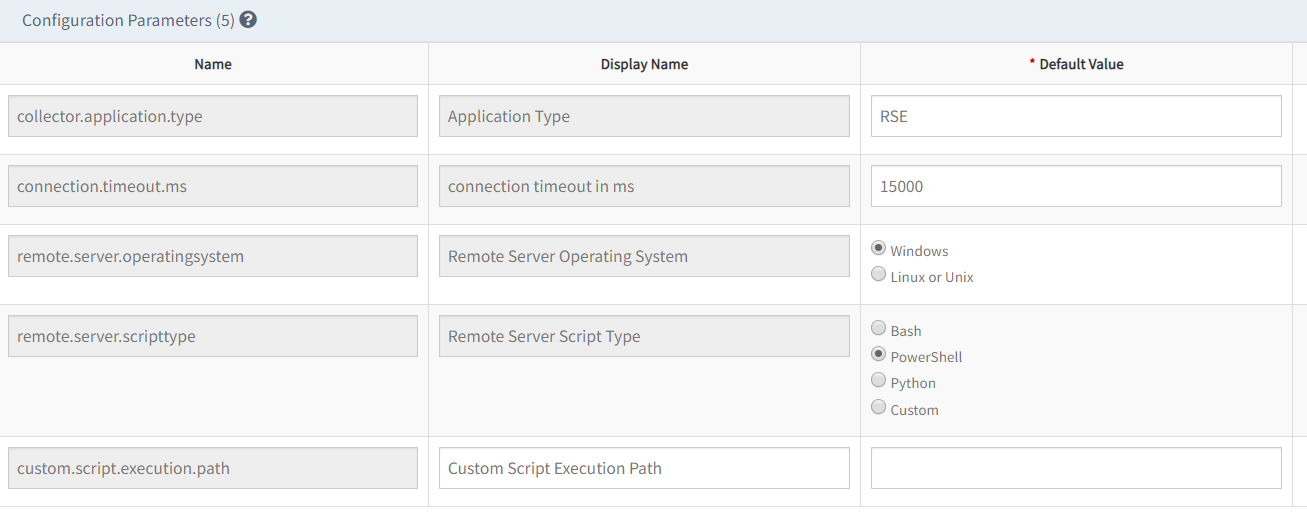
Monitor Configuration Parameters
Improved ServiceNow CMDB integration
Filter out resource group and custom attribute changes as triggers for CI updates in ServiceNow. This helps optimize CI updates in ServiceNow.
See ServiceNow for more information.

CI Attributes on Update Event
Public Cloud Monitoring
OpsRamp’s public cloud monitoring is enhanced to follow the AWS best practices. OpsRamp calculates AWS Lambda metrics using Sum as the statistical aggregator, instead of Average.
OpsRamp-Agent is continuously pushing jobs in MySQL servers
OpsRamp-Agent is continuously pushing jobs in MySQL servers that is affecting the server/source Filer performance. This happens for every 5 minutes.
Issue is fixed.
AWS Autoscaling is not working
User has tested Autoscaling functionality and observed that the instances are not being managed based on the application scale up and scale down.
The instance is not deleted when the user has scaled down, and it is created by the Agent.
Only the instances created through AWS Discovery are getting deleted.
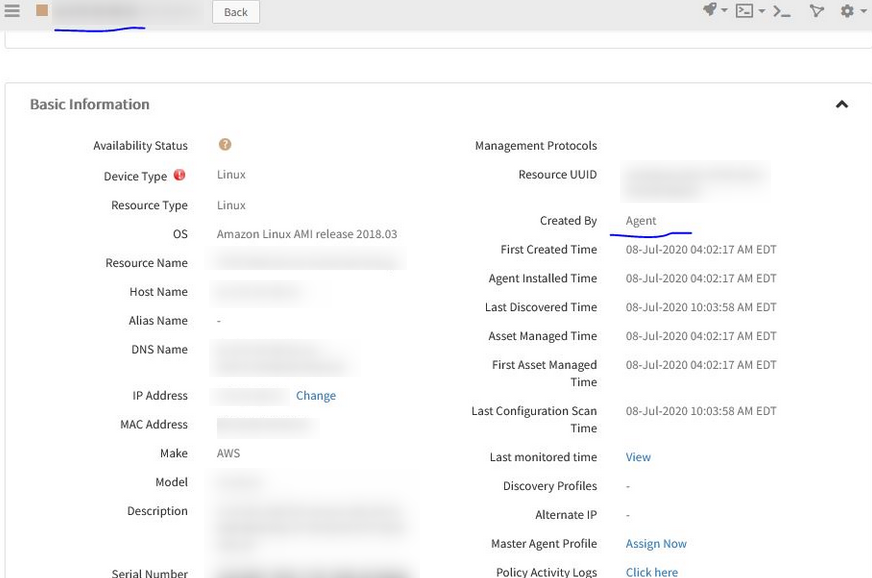
AWS Autoscaling is not working
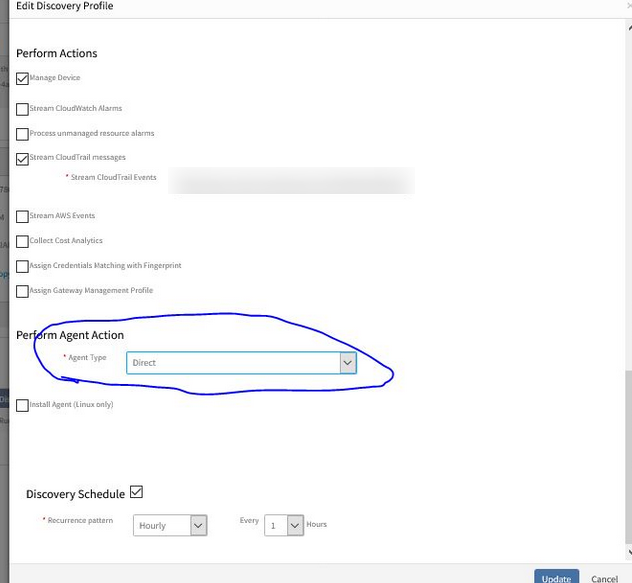
AWS Autoscaling is not working
Deletion of resources is working fine when every rescan happens.
Issue is fixed.
StatsD Monitor is not returning Monitoring Data
The “TLS-StatD Monitoring” is not returning any monitoring data
The user had initially tried to configure port 85 but got the bind error and then tried using default port 8125, but it is not working as well.
Issue is fixed.
Now the user is able to get the data properly.
Agents and Gateways
Agent manageability improvements
Configurable agent logs
The size of agent logs and the number of log files to retain is configurable. This is helpful in troubleshooting intermittent agent connectivity issues.
See Agent Log Reference for more information.
Links to gateway appliance images for cloud
The Downloads page includes links to gateway images for AWS, Azure, and Google Cloud Platform.
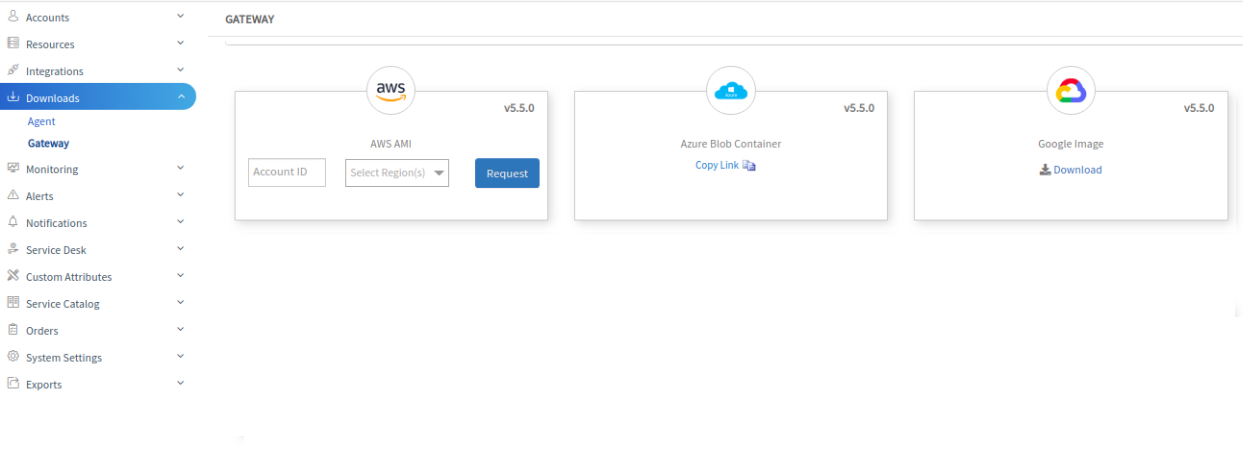
Gateway Cloud Downloads
Security controls on gateway appliance
Simplified gateway appliance accounts
To further improve the security of the gateway appliance, starting with firmware version 7.0.0, an administrator user account and a system user account are available for the gateway appliance. Prior to this release, there were three user accounts with different privilege levels.
See Managing Login Accounts for more information.
Key-based authentication for gateway appliance account
Key-based authentication can be used for the gateway system user account. By default, the appliance system account is configured with password-based authentication, however, the account can be changed to use key-based authentication. This feature increases security and follows industry standard practices.
See Managing Login Accounts for more information.
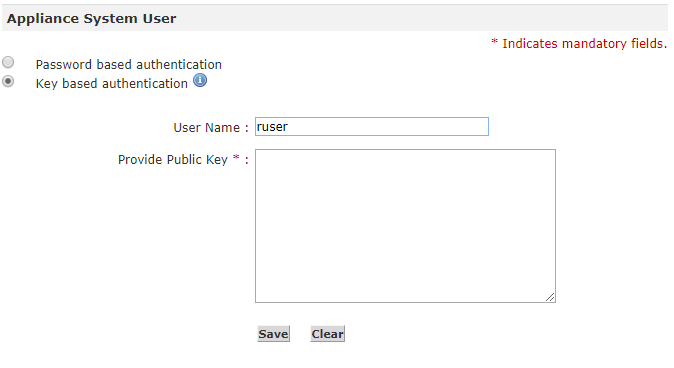
Key-based Login
Custom SSL certificates for gateway appliance
The gateway administration web interface can be secured with an organization’s issued SSL certificate. Prior to this release, the gateway only supported an OpsRamp signed certificate.
See Using SSL Certificates for more information.
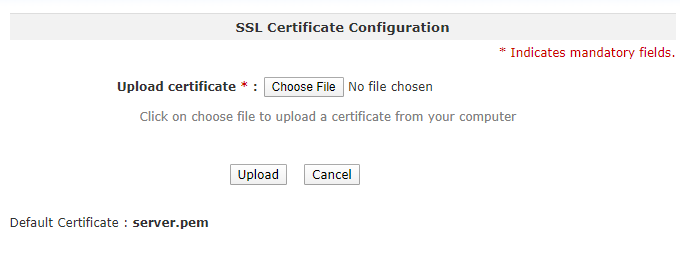
SSL Certificate Configuration
Proxy controls in gateway appliance
The built-in proxy in the gateway appliance can be configured to do the following:
- Enable authenticated access
- Restrict outbound URLs
With these controls, the built-in proxy is used only to access OpsRamp.
See Managing Proxy Settings for more information.
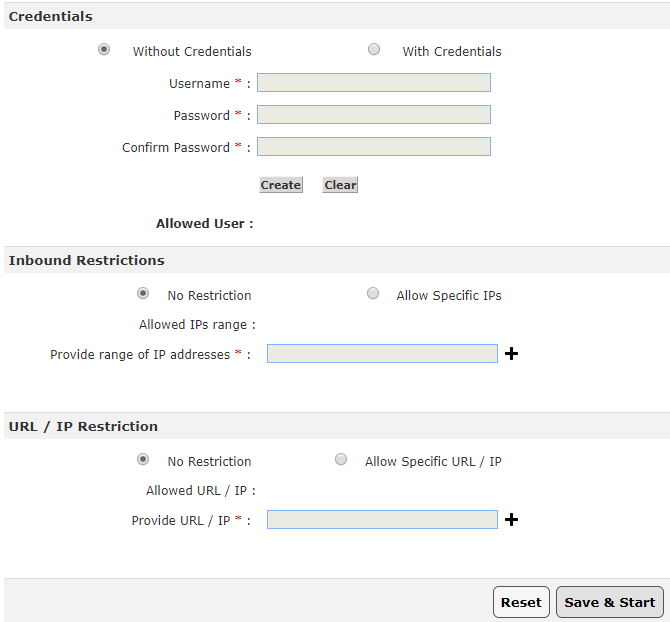
Proxy Configuration
Enhanced support for scripts is provided to manage agent configuration
OpsRamp’s automation library includes scripts to reconfigure agents to connect to OpsRamp directly or to connect via a proxy. Scripts for Windows and Linux are available at Automation > Scripts > OpsRamp Agent from the OpsRamp Console.
APIs for the gateway
APIs to download gateway images: Download gateway images securely via APIs.
APIs to manage gateway configuration: Manage settings on your gateway appliance through an API. This new API helps to manage settings such as host details, network, proxy, NTP, and static routes.
Event and Incident management
Ingest events from syslog
OpsRamp supports ingesting events sent in the RFC-5424 - Syslog Protocol.
Syslog-enabled devices can send syslog events to the OpsRamp gateway. Rules can be defined to parse syslog events and trigger alerts in OpsRamp. Syslog parsing and alert rules can be defined and managed centrally from the OpsRamp UI.
See Monitoring Syslog Configuration for more information.

Syslog Configuration
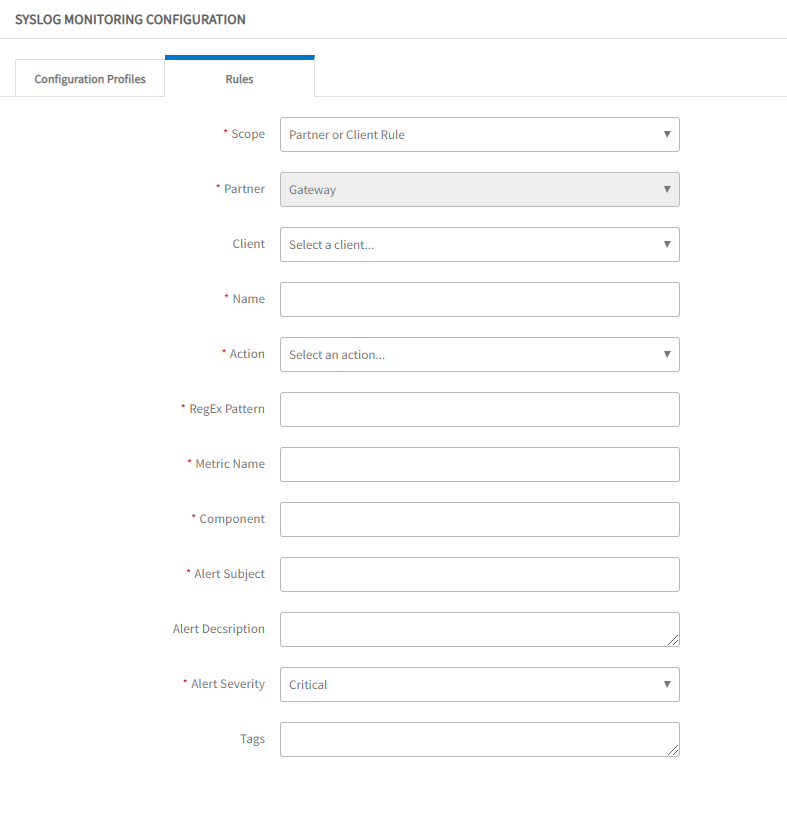
Syslog Rule Definition
Create incident from alert browser
Incidents can be created from a generated alert. Once an incident is created, the status of the alert changes to ticketed and the incident ID appears in the ID column.

Create incident from alert browser
Alert sequencing explainer
When configuring a new alert correlation policy, a link is provided that is labeled: How does it work? The link gives users an overview of how OpsRamp alert sequencing works to automatically correlate alerts.

Alert sequence explainer
Alert sequence policy status
Included in this release are the various stages an alert correlation policy goes through for machine learning to provide users with the current status and information about what each stage means.
See Alert sequence information for more information.
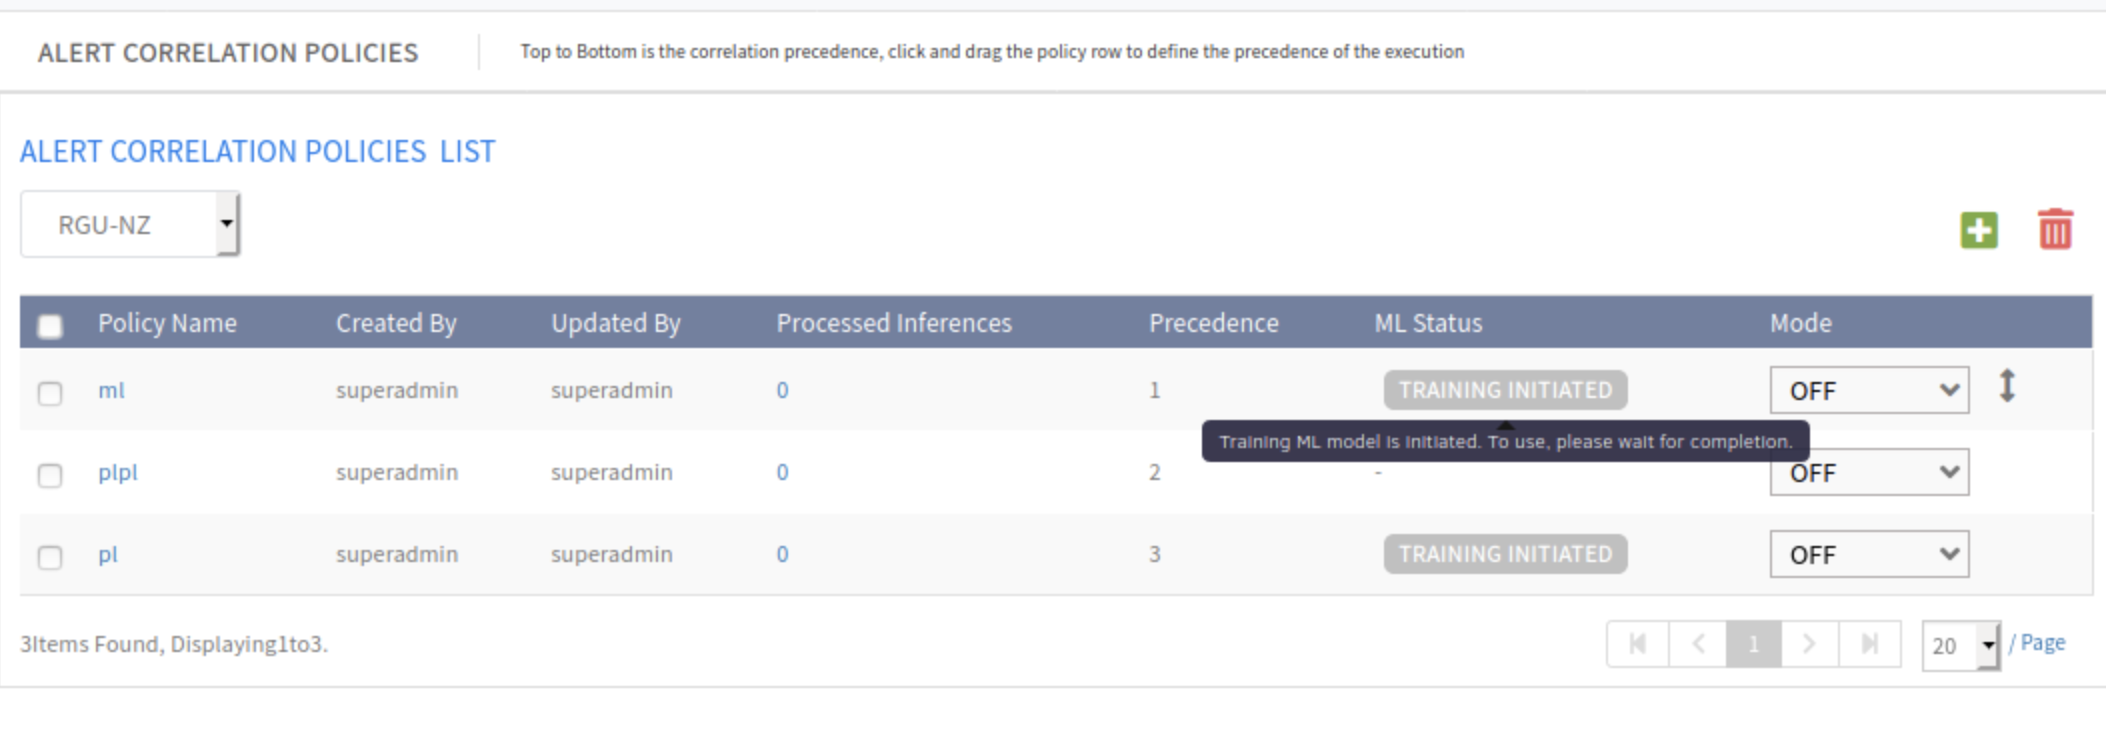
Alert sequence policy status
Undo actions taken on alerts
A critical alert can be unacknowledged after it has been acknowledged if it needs to be reprioritized.
Additionally, an alert can be unsuppressed once it has been suppressed. Once the button is clicked, a prompt requests a comment on the action and the alert is moved to either Open status or Ticketed status depending on if there is an incident ID associated with the alert or not.

Undo actions on alerts
Snooze action on alerts
Alerts can be suppressed for a specific amount of time.
Suppression allows prioritization for critical alert responses and snoozing for non-critical alerts deferred responses. Further, with the First Response policy, OpsRamp can be trained to automatically snooze specific types of alerts.
- See Alert First Response Overview - Snooze action on alerts for more information.
- See Managing First Response Policy - Creating first response policies for more information.
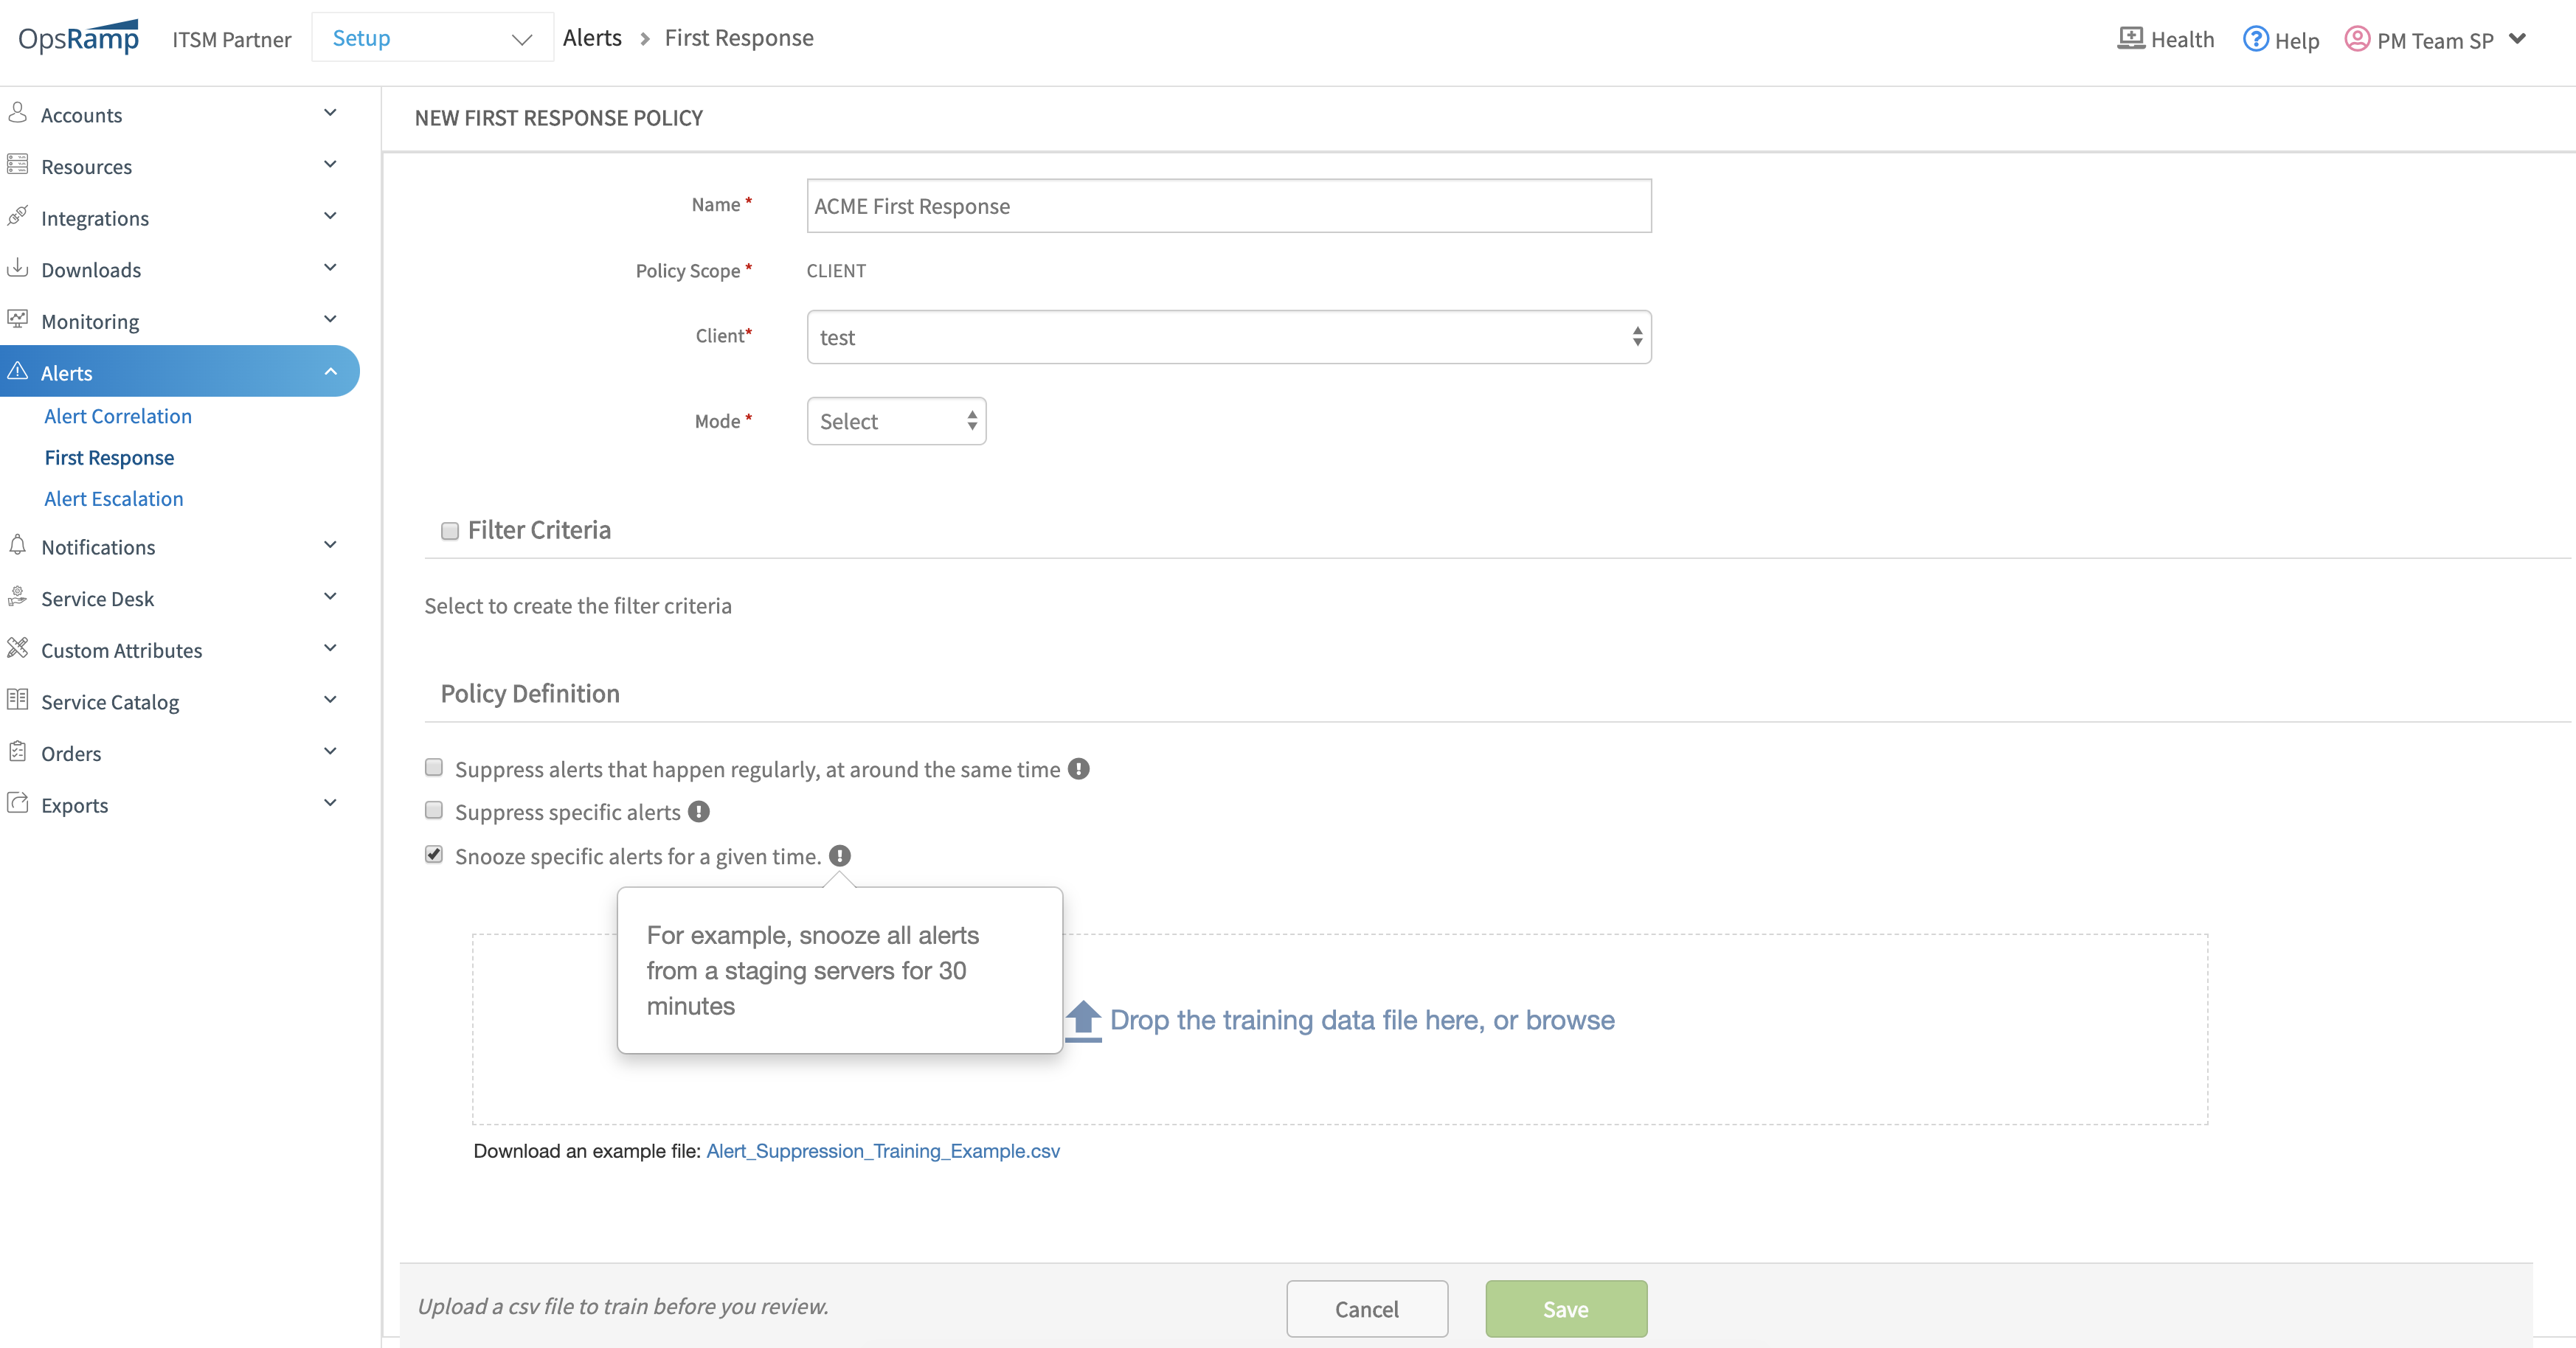
Snooze action on alerts
Inference notifications with alert details
Details of alerts correlated to an inference can now be embedded in a notification. This includes impacted resources, alert ID, alert subject, alert metric and alert time.
See Managing Inferences for more information.
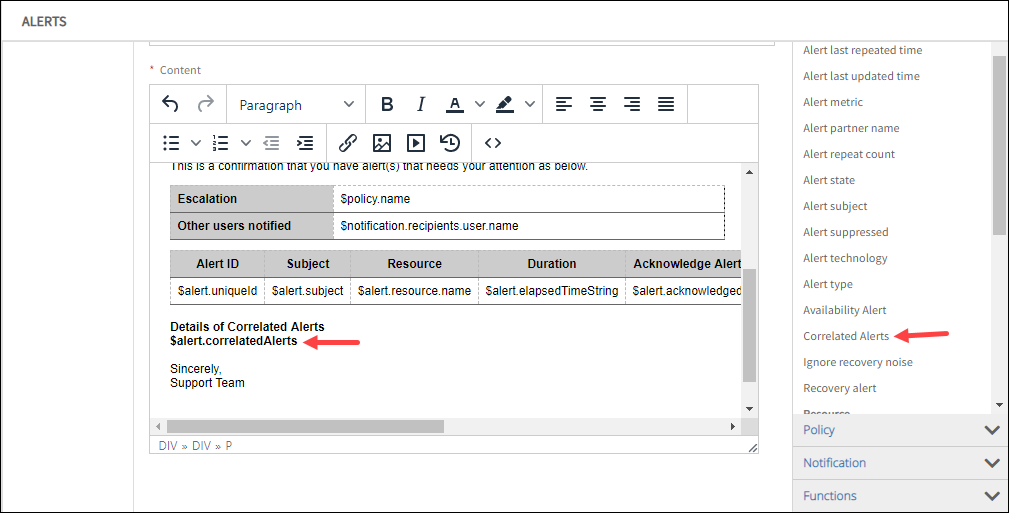
Inference notifications with alert details
Streaming alert exports
In addition streaming alerts from OpsRamp to an external event bus, alerts can be streamed to AWS EventBridge.
Alerts can be collected from OpsRamp for online or offline analysis in an external system.
For more information:
- See Streaming Export Overview for more information.
- See Managing Streaming Exports for more information.
Note
This feature is an optional module that is enabled for accounts upon request. Please contact OpsRamp account manager for more information.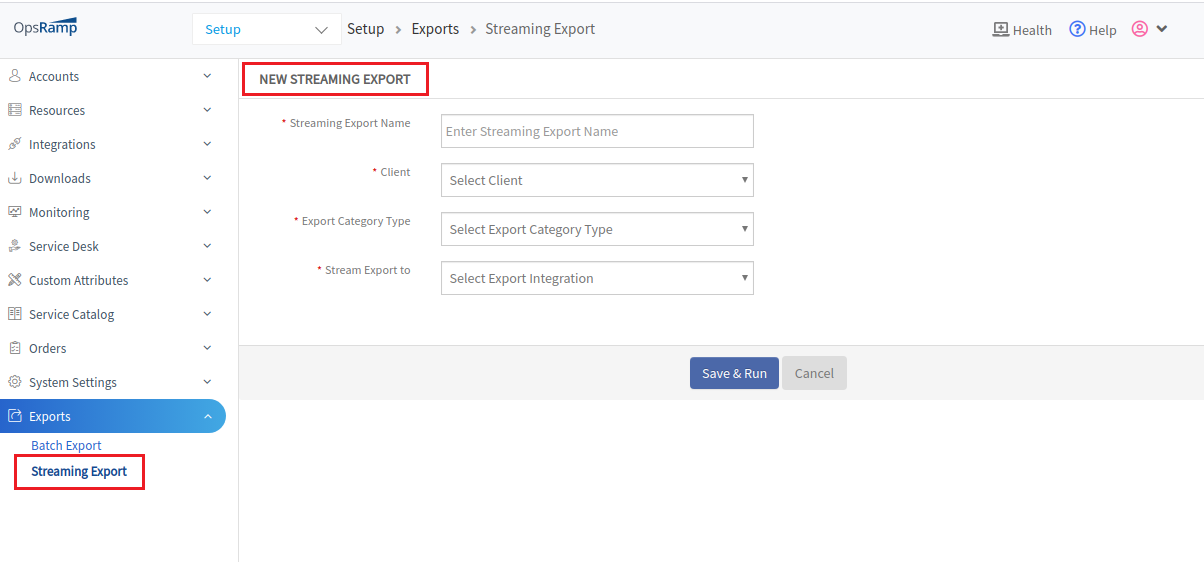
Streaming Export
New event integrations
Pre-defined webhook integrations ingest events are available from the following:
Reverse Alerting Condition
Enhanced the Change Detection Monitor type to consider non-zero integers in the alert processing. This enhancement allows teams to treat the change detection monitor as a reverse dead man’s switch to generate an alert when a resource that is supposed to stay down turns Up and starts reporting data.
Storage Volume Update
Storage Volumes have been enhanced to present the parent storage array as an attribute. This enhancement allows:
- Improved querying of a storage volume to display the parent storage array as an attribute.
- Easier discovery of the parent resource after accessing the component from the Alert page.
Alert Correlation
A new condition, Alert Component is added to the Alerts Similarity field on Create Alert Correlation Policy.
Training file
The Alert correlation training file is enhanced to use the wild card character * (asterisk) to group alerts when the exact metric name is not known. If multiple metrics start with the same name, then using an asterisk with the name of alert in the training file helps to correlate all alerts.
For example, with metrics named vmware.vcenter.x1 and vmware.vcenter.x2, use vmware.vcenter.* to correlate all alerts starting with vmware.vcenter.
Alert and Incident are healed, but still escalation notifications are sent
The incident is healed in 6 minutes.

Alert and Incident are healed, but still escalation notifications are sent
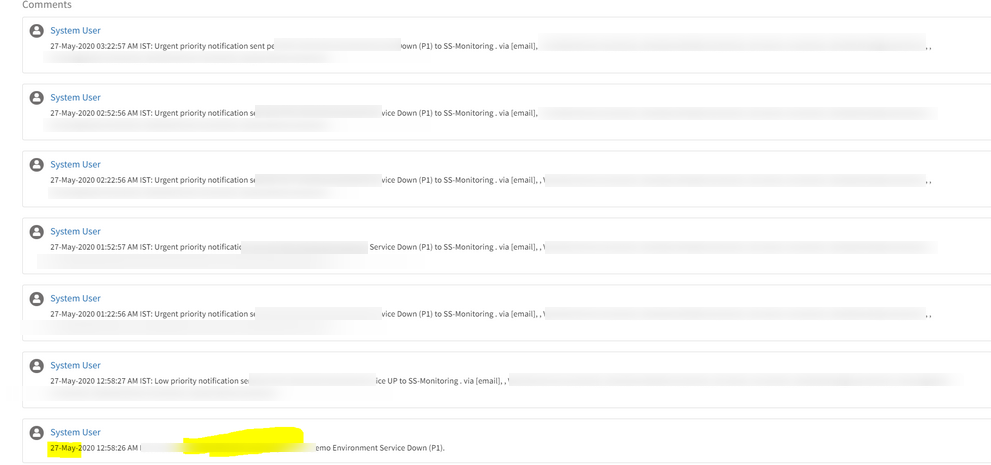
Alert and Incident are healed, but still escalation notifications are sent
According to the AEP’s escalation rule, it is continuously sending Email notifications every 30 minutes. The alert has not been acknowledged and the incident has not been closed.
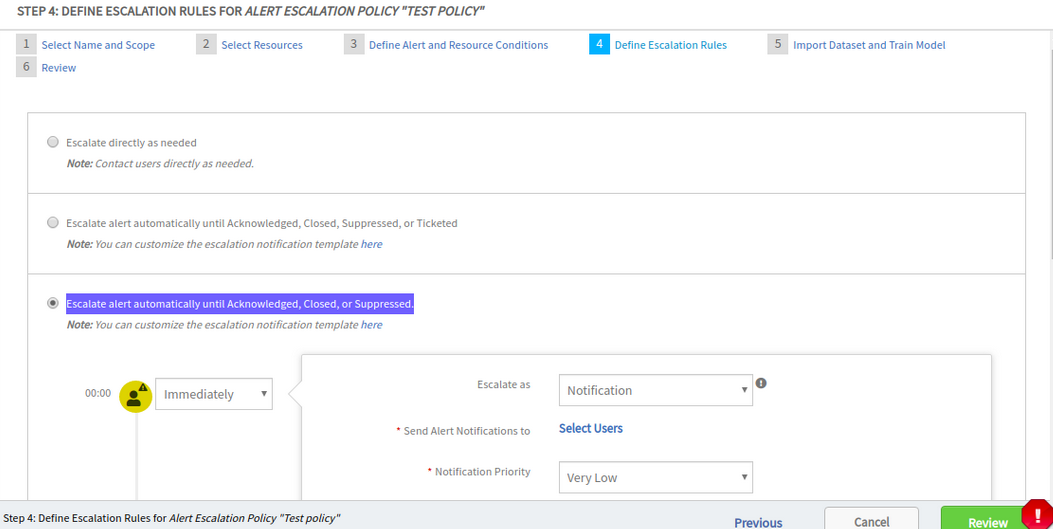
When the newly added option Step 4: DEFINE ESCALATION RULES FOR ALERT ESCALATION POLICY, “Escalate alert automatically until Acknowledged, Closed, or Suppressed” in the Alert escalation policy is used, this issue happens
When the newly added option Step 4: DEFINE ESCALATION RULES FOR ALERT ESCALATION POLICY, “Escalate alert automatically until Acknowledged, Closed, or Suppressed" in the Alert escalation policy is used, this issue happens.
Issue is fixed.
The repeat escalation notifications are not sent when there is a heal alert.
Incident created when device is in the maintenance window
Created a maintenance period that will suppress alerts during this time on the reported device. Still incident was created during the maintenance window.
Actual scenario: The maintenance windows started at 6:00 am to 6:00 am CDT; it started at 6:00 am CDT and on the next day at 6:00 am CDT schedule maintenance has stopped and started again at 6:00 am CDT. When schedule maintenance stops all alerts are moved to the monitoring in a fraction of second before schedule maintenance started again. So this alert matched with the alert escalation policy and created an Incident.
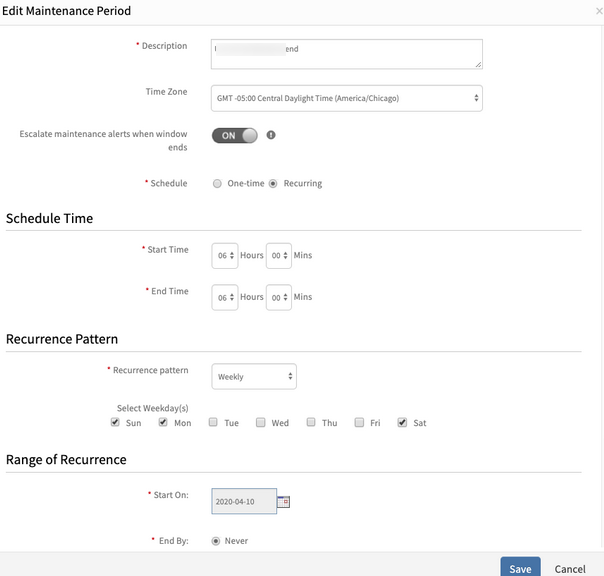
Incident created when device is in the maintenance window
Issue is fixed. Did not have support for continuous schedule maintenance for more than one day.
Provided the fix to get this schedule maintenance window in maintenance more than a day if user sets the same end time and start time and selected continuous days in recurring.
Also, found one issue related to the day overlapping time zone conversion. Need to calculate this in User Time zone, but it calculates this in GMT. It is now calculating this day overlapping in the User Time zone.
Alerts getting appended post maintenance period for Unmanaged device
Alerts with maintenance information are popping up in the Alert browser once the maintenance ends, causing escalations.
The resource is in maintenance state. After the alerts started popping up, the user unmanaged the device.
As per the flow, if the user unmanages the device, then only monitoring type alert is moved to Obsolete state. The schedule maintenance alerts are not moved to the Obsolete state. After completion of the window, it changes to monitoring state.

Alerts with maintenance information are popping up in the Alert browser once the maintenance ends, causing escalations
Issue is fixed.
When a resource is unmanaged, all the alert types (Monitoring, Schedule Maintenance, Forecast, Change Detection) become Obsolete.
Alerts are getting escalated during patching window
Even when the resources are in maintenance mode, alerts are triggering.
As per the Patch configuration, maintenance was enabled for 4 Hours. However, alerts are directly moved into the Monitoring queue. This is happening across all clients.
RCA: End time is saving wrong date, when creating maintenance window for patch jobs.
Fix: Corrected the date and time for end-date and end-time.
Getting the alert type as “Scheduled Maintenance” for the alerts generated during Patch installation maintenance window.
After the maintenance window ends, the alert type changes to “Monitoring”.
Phone calls and text not working with escalations after upgrade to 7.0.0
After being upgraded to 7.0.0, the user has not received any Phone calls or SMS messages for escalation policy. This has caused to miss several alerts.
Issue is due to wrong validation while performing the Alert escalation scheduled notification actions. Made some changes.
Handled resource and required validations to perform elapsed alert escalation notifications.
Issue is fixed.
Alerts received with lag
Facing lag issue with respect to alerts and its Intermittent. Suddenly alerts were triggering to queue with 25 to 40 minutes elapsed time but by default elapsed time should be 0 when alert triggers to queue. Today this alert was triggered to queue 28 mins elapsed time.
Did some enhancement to replace service calls with APIs and added those APIs to the Alerts Cache. Here some cache calls have 1-hour TTL, so it is resulting in lag on alerts.
Analysed and increased some cache calls TTL, so this can improve alerts’ performance.
Issue is fixed. The alerts are received with no lag.
Device is not showing as under Maintenance
Entire site is kept under maintenance.
Observed that all devices under this site are showing under maintenance. However, a device does not show that it is under maintenance on the ‘Overview’ page. Yet, it shows the ‘wrench’ icon in the Resources page.
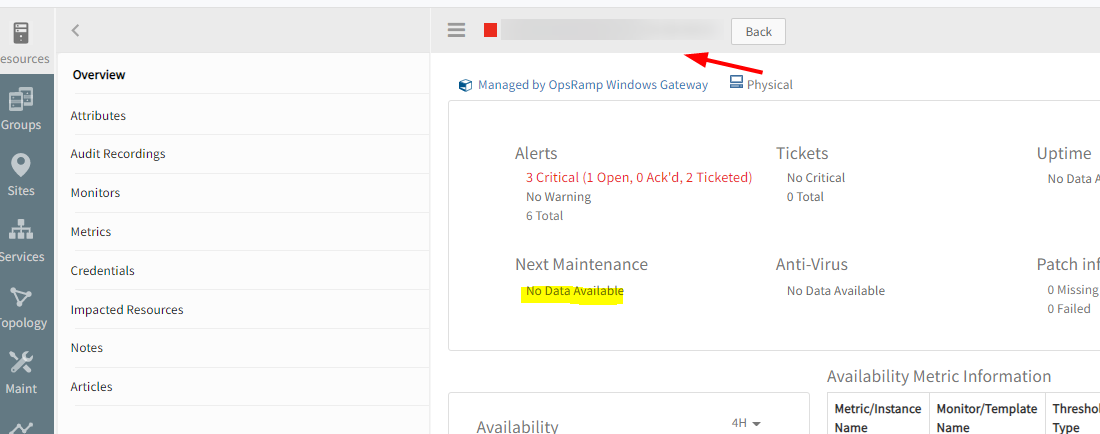
Device does not show that it is under maintenance on the 'Overview page
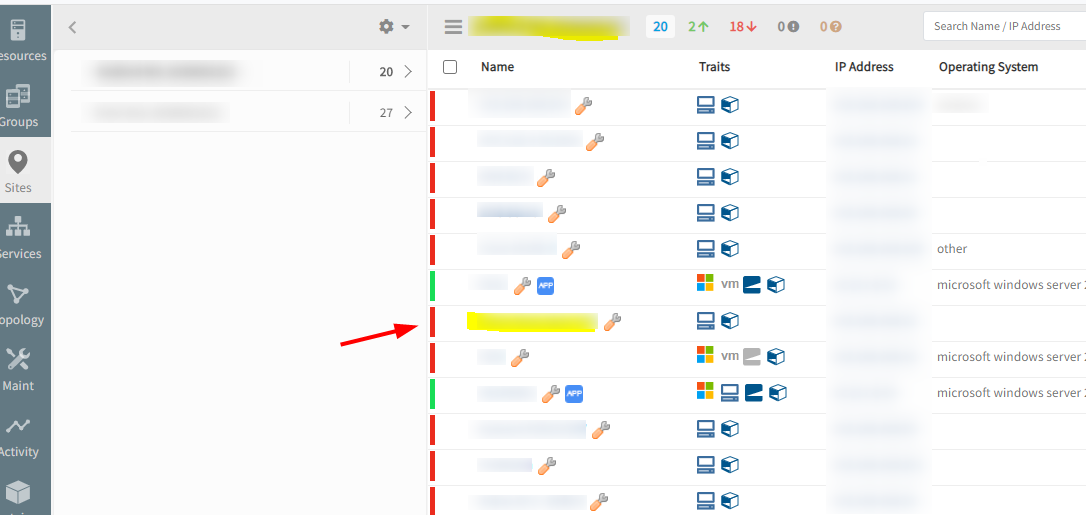
Device shows the 'wrench' icon in the Resources page
Alerts are being generated in ‘monitoring’ queue.
While loading scheduled maintenance windows for the resources not including the “Sites”, so not getting Next Maintenance data in Resource overview page.
Included Sites also to get schedule maintenance windows.
Issue is fixed. The device is showing in the Overview page as under maintenance. Also, no alerts are generated.
Remediation and Automation
Process automation
OpsRamp introduces a flexible and powerful new process automation engine.
Using this capability, sequences of automation tasks can be executed. Workflows can be triggered by alerts, on updates to resources, or on a recurring schedule.
The workflow supports the following types of tasks:
- Send a notification to users.
- Call a RESTful API.
- Run a runbook script on a server managed by the OpsRamp agent.
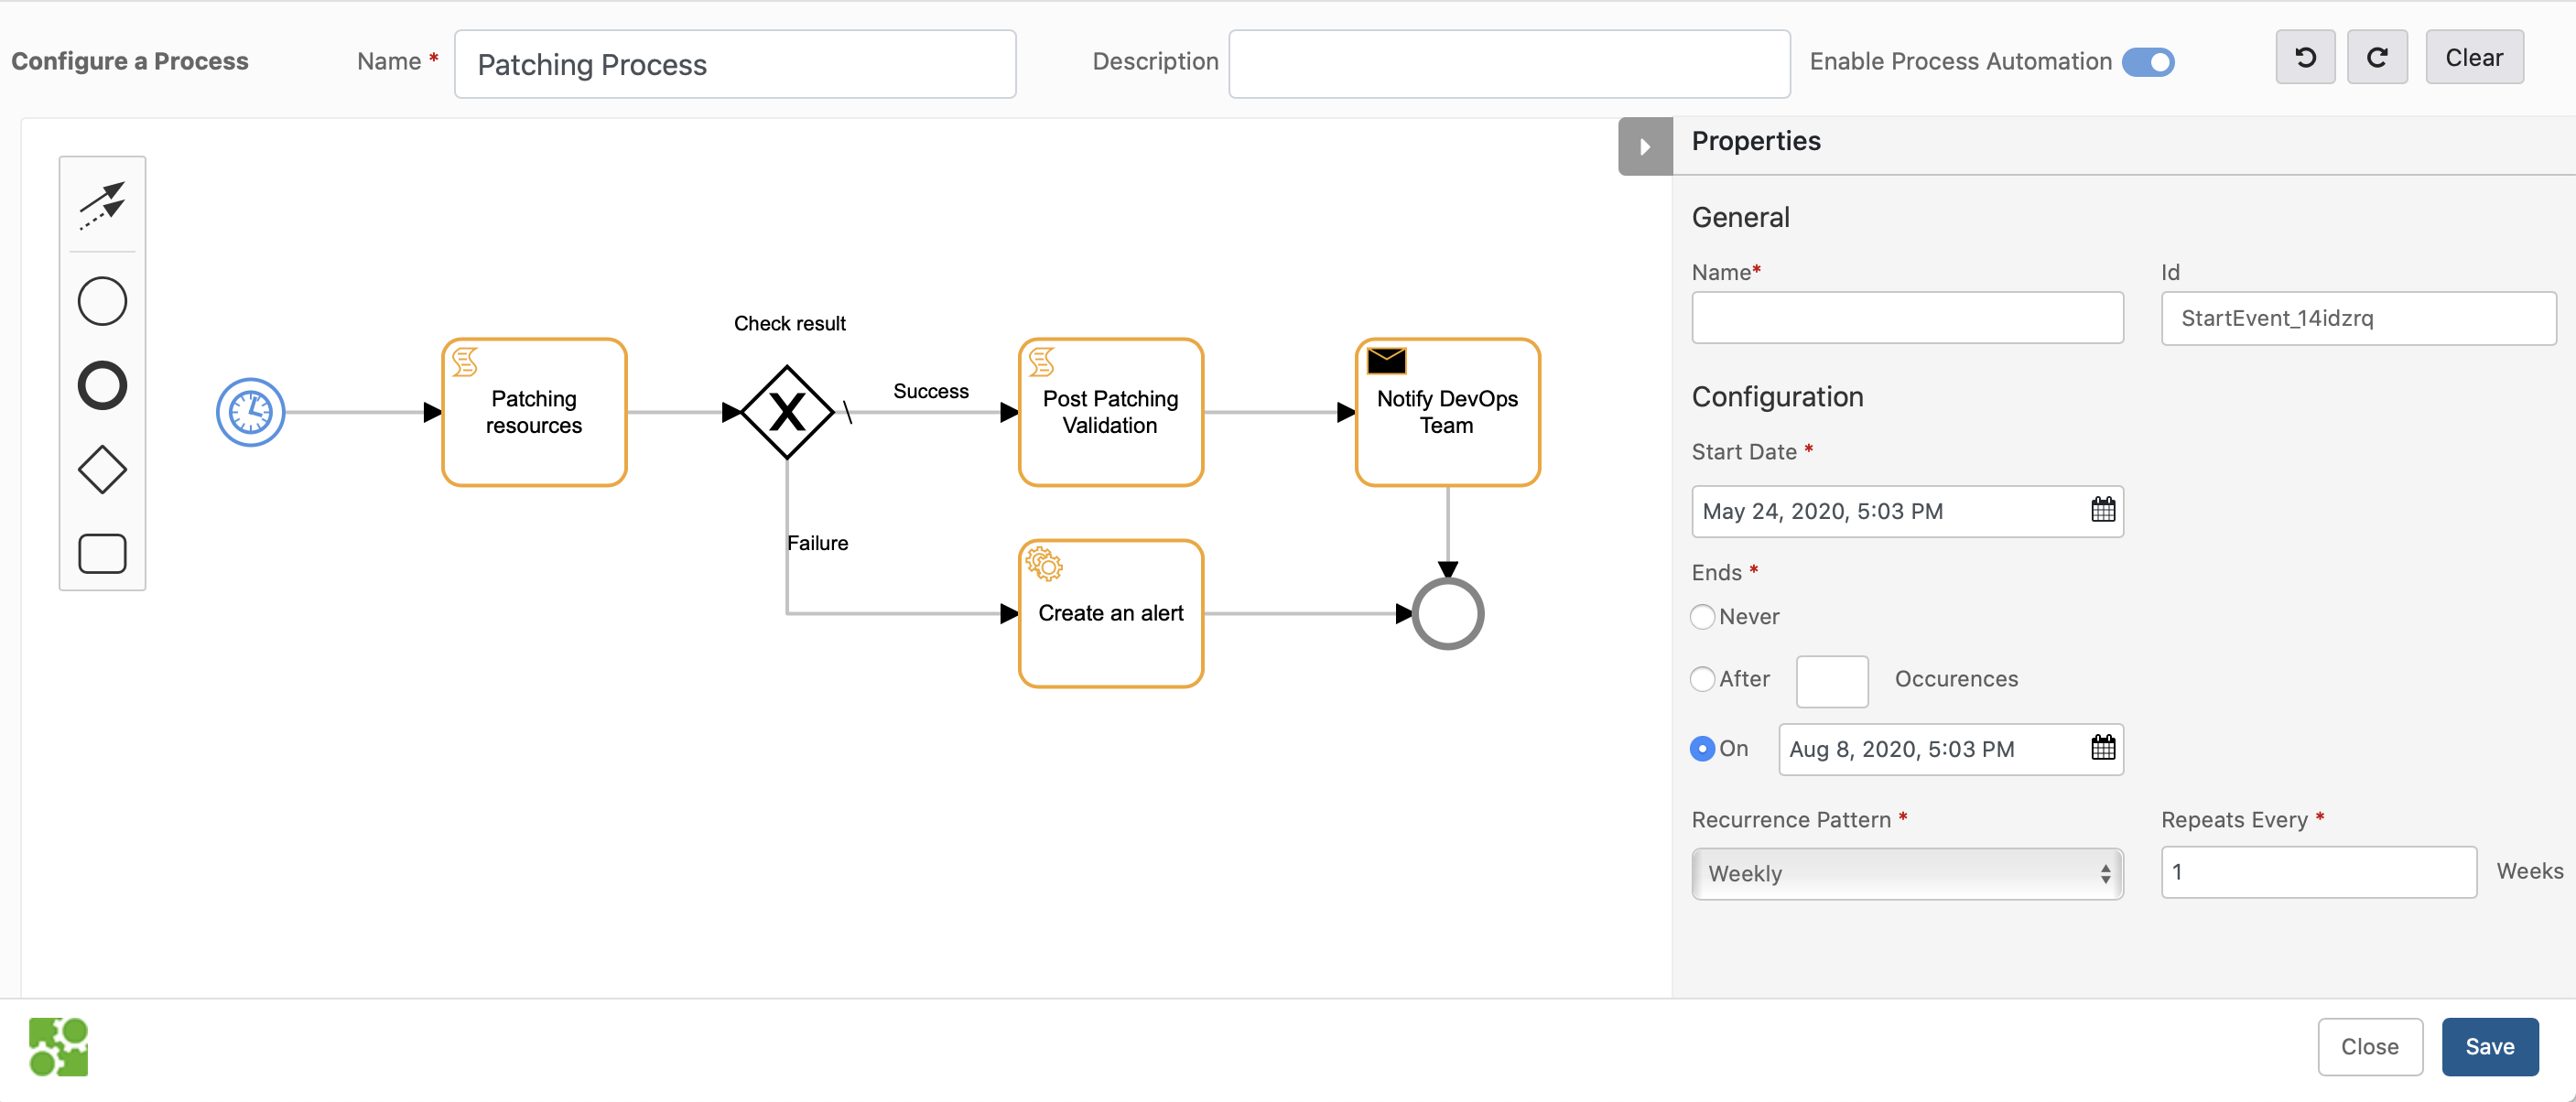
Process Automation Workflow
Ansible integration
OpsRamp now integrates with Ansible, a commonly used automation framework.
With this integration, playbooks can be triggered on an Ansible control node through the OpsRamp agent. This feature allows integration of the vast ecosystem of Ansible playbooks into automation processes.
Browser-based remote consoles (BETA)
Launch remote consoles that run directly on web browsers.
Beta Notice
The Browser Console feature is BETA.Note
Prior to this release, remote consoles required that Java on the desktop and consoles run as a separate Java applications.Browser-based consoles support the following capabilities:
- Console protocols: RDP, SSH, Telnet
- File transfer
- Session recording
See Launching Browser Consoles for more information.
Java-based remote consoles are now deprecated and will not be available in future releases. See Deprecation Notices for more information.

Java-based remote consoles are now deprecated
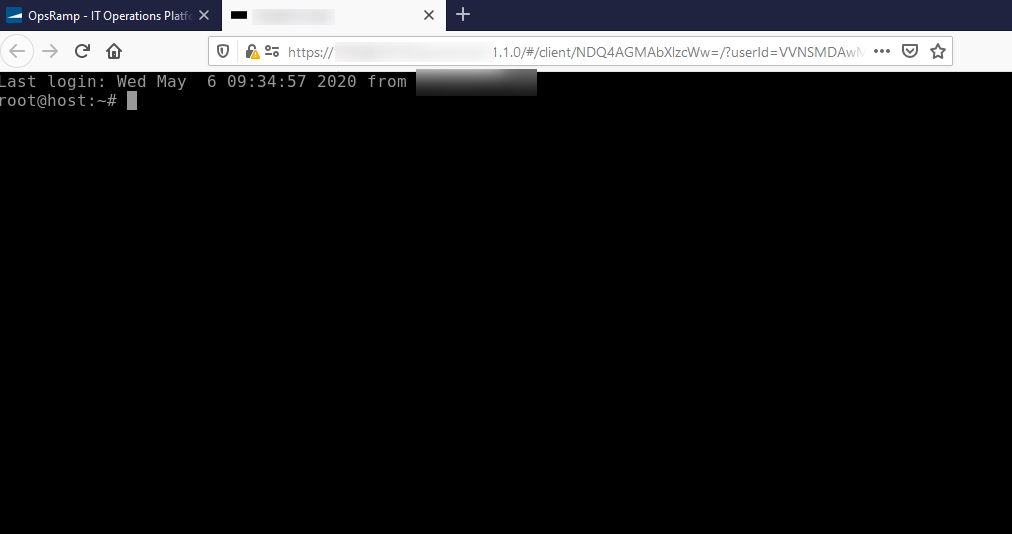
Java-based remote console
Reports
Improved custom reports
Custom reports for metrics now have improved graphs. All metrics graphs for a metric are grouped together and graph visualization is improved.
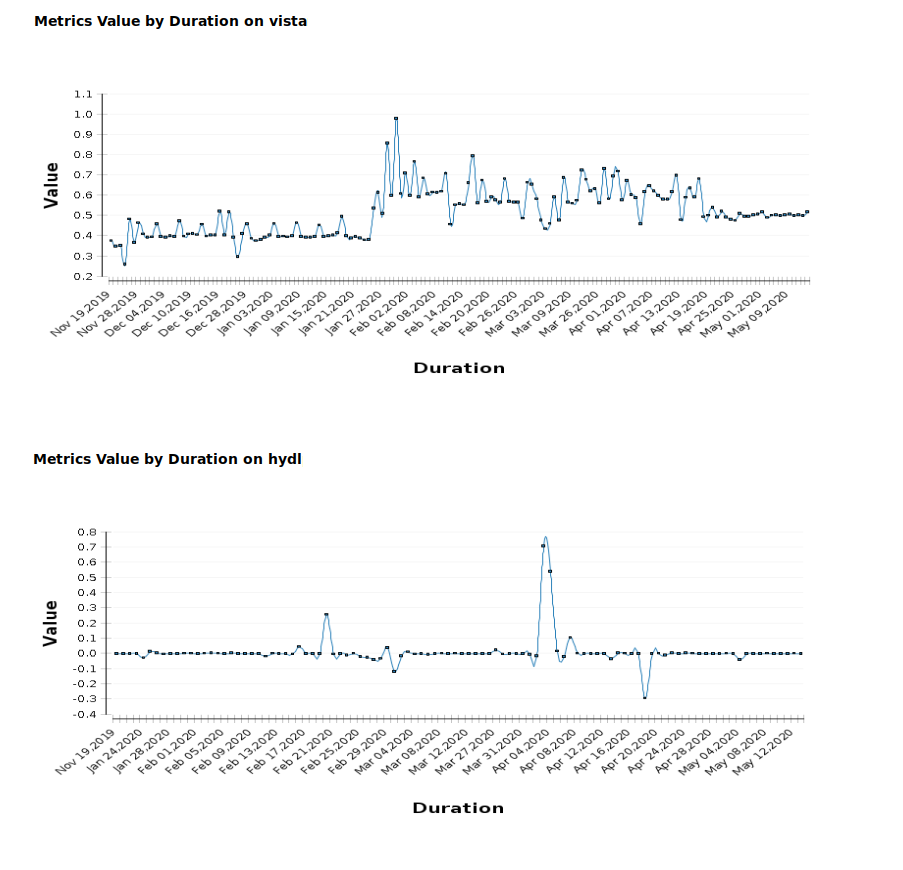
Custom reports for metrics now have improved graphs
Alerts report
The Alerts report is enhanced to support Cloud Provider » Resource Type Filter. This enhancement makes it easier to access alerts generated from Cloud Providers monitored by OpsRamp.
Other enhancements
- The Alert Export details is enhanced to include the Resource Unique ID.
- The Custom Inventory report is enhanced to display Web Synthetic as a Type attribute. The generated report, now displays the type of Synthetics resource if Web Synthetic is selected as the resource type.
- The Standard Inventory report is enhanced to include the version and model of the gateway.
Unable to move to the desire page - Custom report on metrics
User must enter the page number in the Go to page text box to move to the desired page.
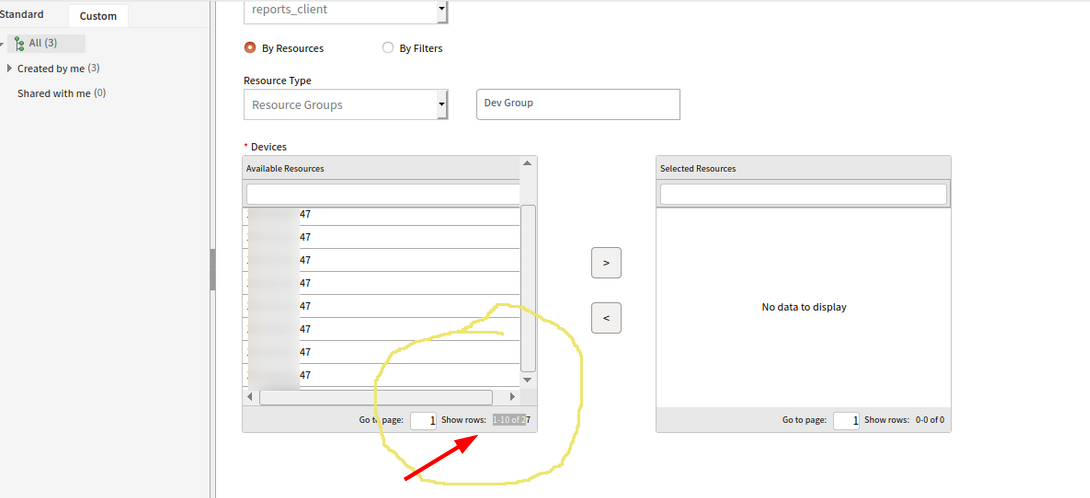
User must enter the page number in the Go to page text box to move to the desired page
Issue is fixed.
Navigation buttons added with page size 20.
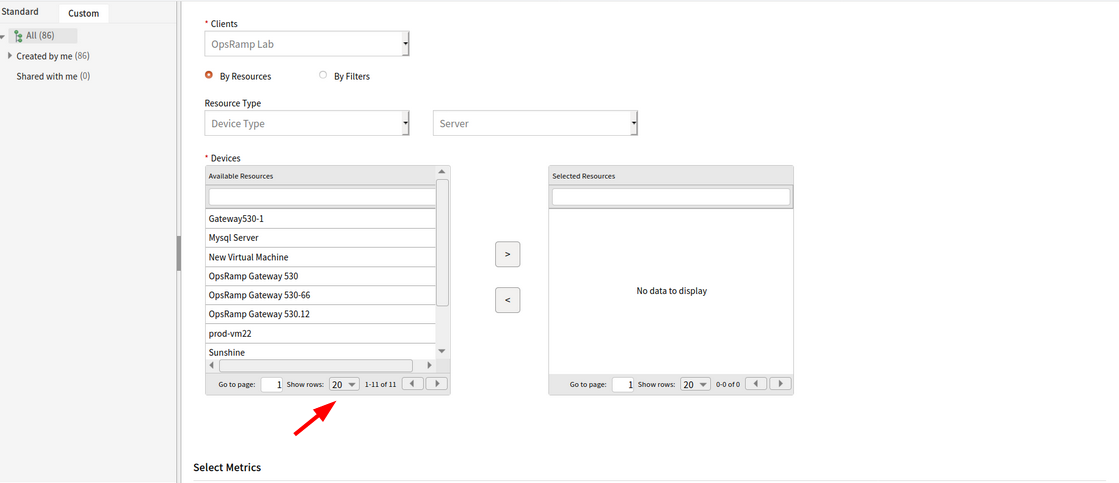
Navigation buttons added with page size 20
Recurring report – Schedule maintenance failed
The user has scheduled a report for daily basis, and it stopped sending notifications from the last 10 days.
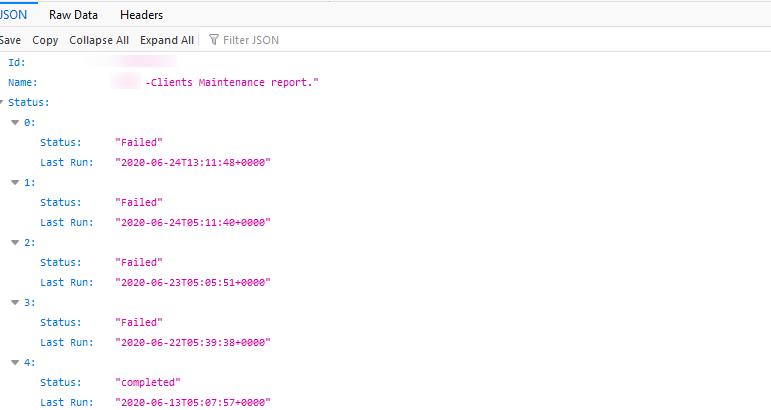
Recurring report – Schedule maintenance failed
Issue is fixed. Made the changes to load the schedule maintenance details which is configured with Locations.
Issue with pulling up reports
Unable to go to the second page of the Ticket Report. Also, unable to increase the report number from 20 in the Search page.
While selecting a client to check for pre-scheduled/old reports, it shows the below page:
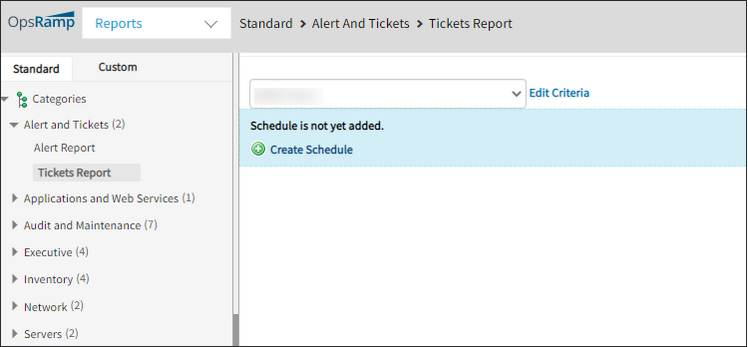
While selecting a client to check for pre-scheduled/old reports, it shows this page
Issue is fixed. Required changes are done to fix it.
Web Services Monitoring
Graphs are not populating, neither is the RCA
SCRIPT - HTTP Synthetic Transaction monitor created, but graphs are not populating, neither is the RCA.
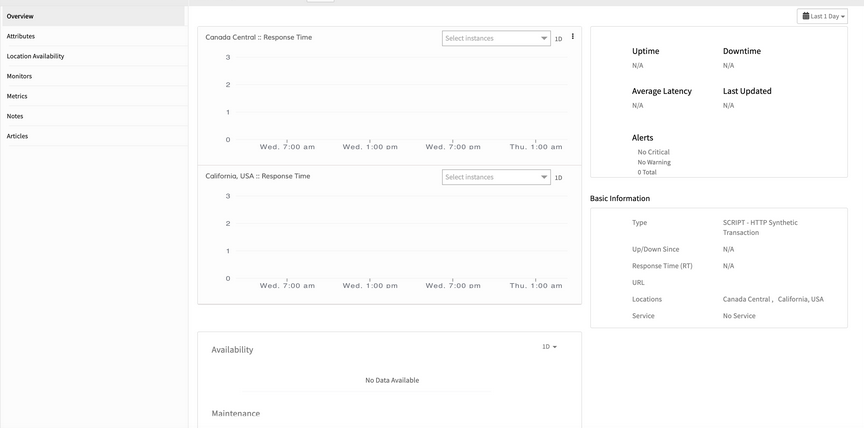
SCRIPT – HTTP Synthetic Transaction monitor created, but graphs are not populating, neither is the RCA
The collector is getting the Configs and monitoring is being done, but RCA is not seen in the UI.
Issue is fixed. RCA is showing fine for the script synthetics, though there is no data point for response time.
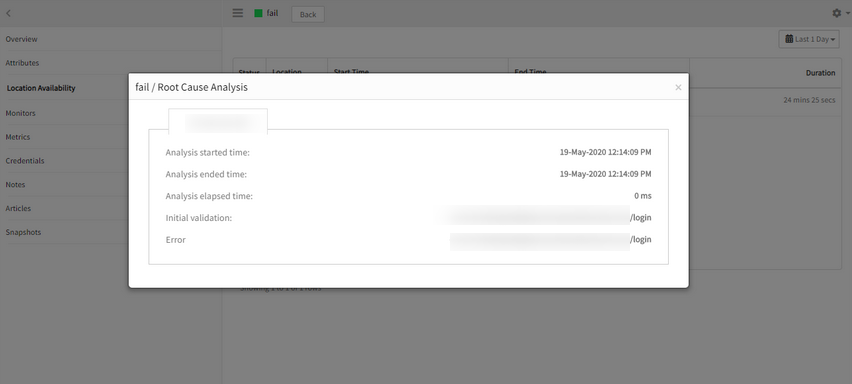
RCA is not seen in the UI
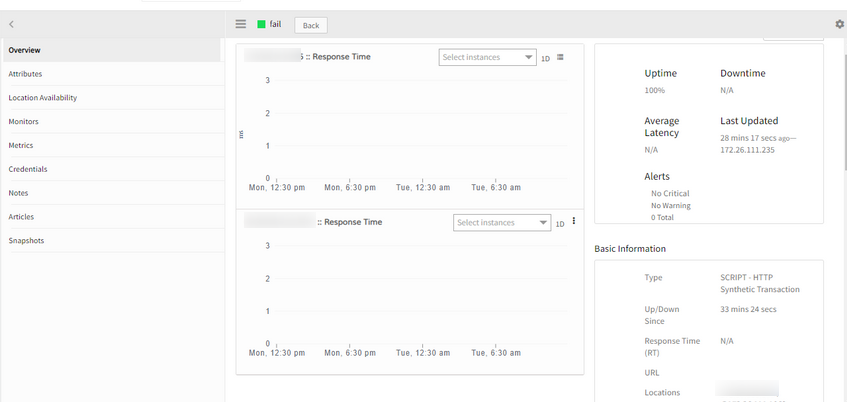
RCA is showing fine for the script synthetics, though there is no data point for response time
Selenium based Web Service Monitor is not working
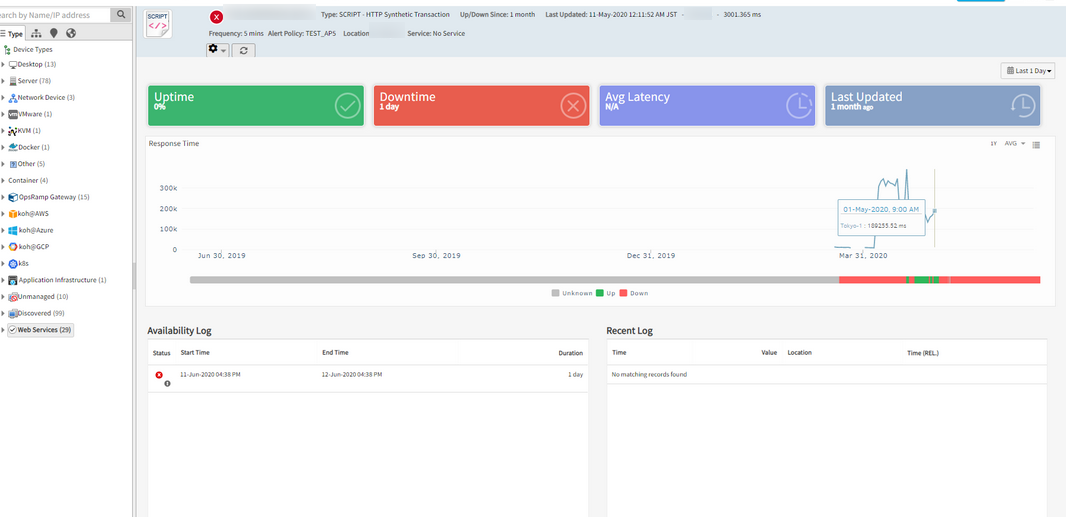
Selenium based Web Service Monitor is not working
Issue is fixed. Collector is new and did not have any packages to run the Script monitors. Updated the collector. Data and graphs are plotting for the resource.
Schedule Maintenance
Schedule Maintenance Enhancement
Schedule details is enhanced to allow maintenance duration of 24 hours.
Devices are showing as ‘Currently Under Maintenance’ even though the window is suspended

Maintenance windows is suspended
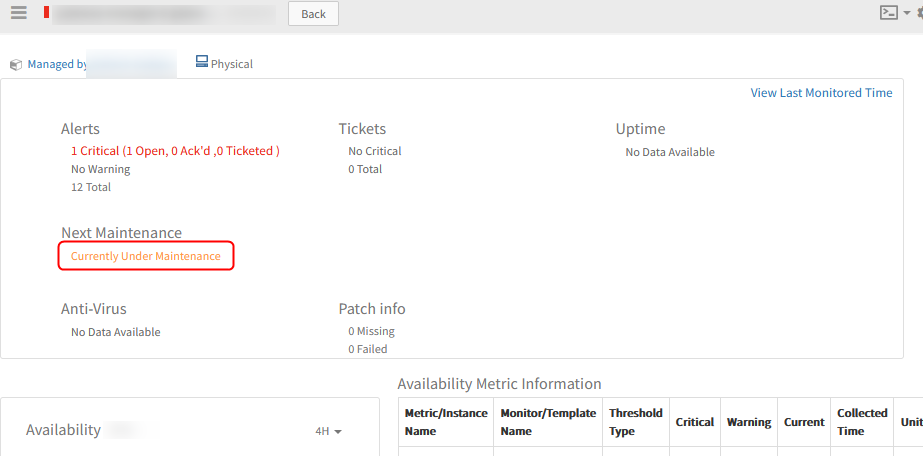
Showing Currently Under Maintenance even though the window is suspended
Issue is fixed. The resource will not show anything, till the time the maintenance window is Resumed, in the resource details page. It will come back under maintenance if the suspended end time is within the maintenance period.
So, when the maintenance period is suspended, nothing is displayed in the Resource details page.
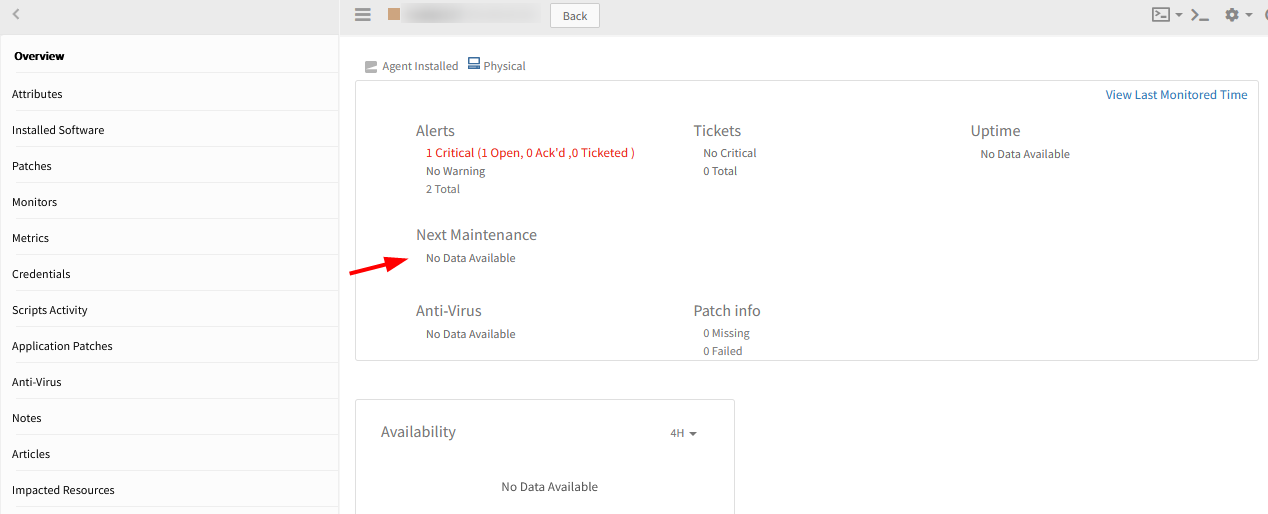
Will not show anything when maintenance period is suspended
Service Management
Service Desk Widget
The Service Desk widget is enhanced with the Service Desk View option. This option helps to easily track and follow issues based on metrics, such as Clients, Group, Priority, and Status.
Duplicate Incident notifications (Email notifications being sent 2 times) received
There are incidents that were notified for a few alerts where:
Metric name is “vmware.cpu.usage.average”
vmware.cpu.usage.average 100 % (>= 90)”
There were few other alerts where the incidents sent duplicate notifications.
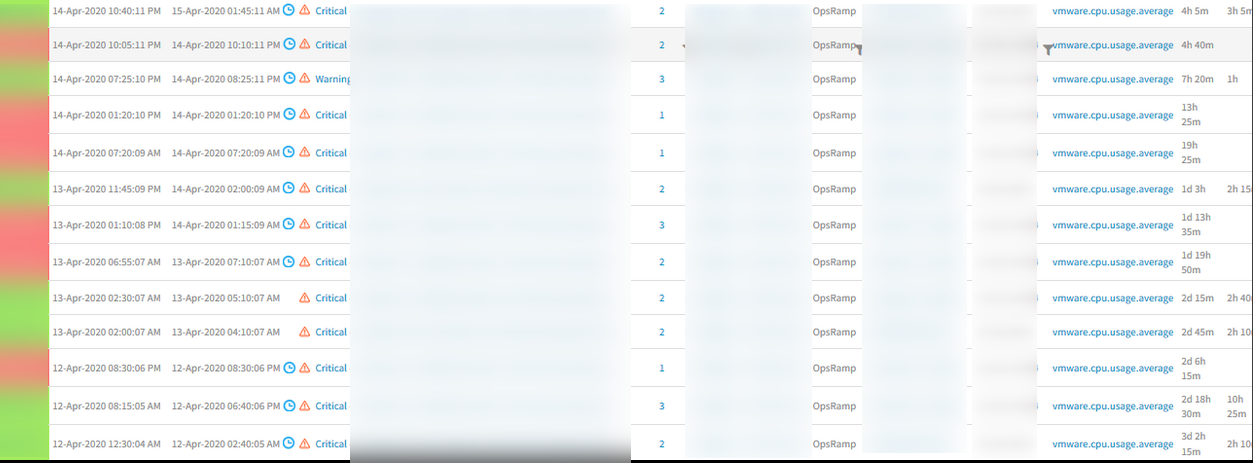
Duplicate Incident notifications are received
Issue is fixed.
Receiving only one Email when incident is created with Escalation policy for Immediate and Wait time cases.
Clicking on Ticket Subject the last ticket on the page gets opened
On searching the ticket conversation, the results of tickets which match are displayed. In the given list, Client should be able to open the ticket by clicking on the TicketID/Ticket Subject. Tickets are opening when the user clicks on TicketID.
When user clicks on the Ticket Subject, instead of last ticket on the page being opened, the actual ticket should open.
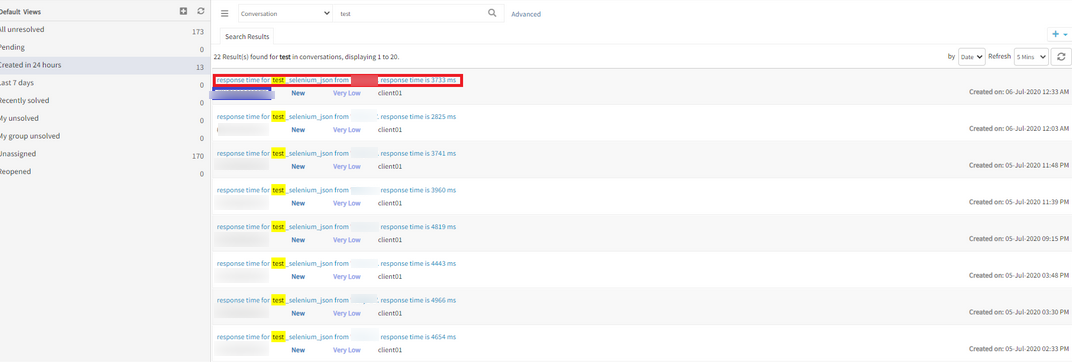
Clicking on Ticket Subject the last ticket on the page gets opened
Issue is fixed. Prepared individual URL links for the respective matched responses.
First Response time is not getting updated after updating the ticket
The user creates an Incident. After creating the incident, the user updates the status as Open. The first response time should update accordingly in the ticket.
Also, the user updates the ticket, so in the Conversations tab comments like ‘Open’. The user then switches to the Resources tab to assign the incident to the appropriate team. After doing this, the user updates the ticket by clicking the status as ‘Open’. Now the Time to First Response should stop. But the timer does not stop. Activity log also does not capture anything. It sends a reminder notification as SLA breach. Only when the user clicks in the Conversations tab and clicks Open submits, the first response time gets updated and stops.
Sometimes, even after the Incident is resolved, the Time to First Response does not stop, and the user receives SLA reminder notifications.
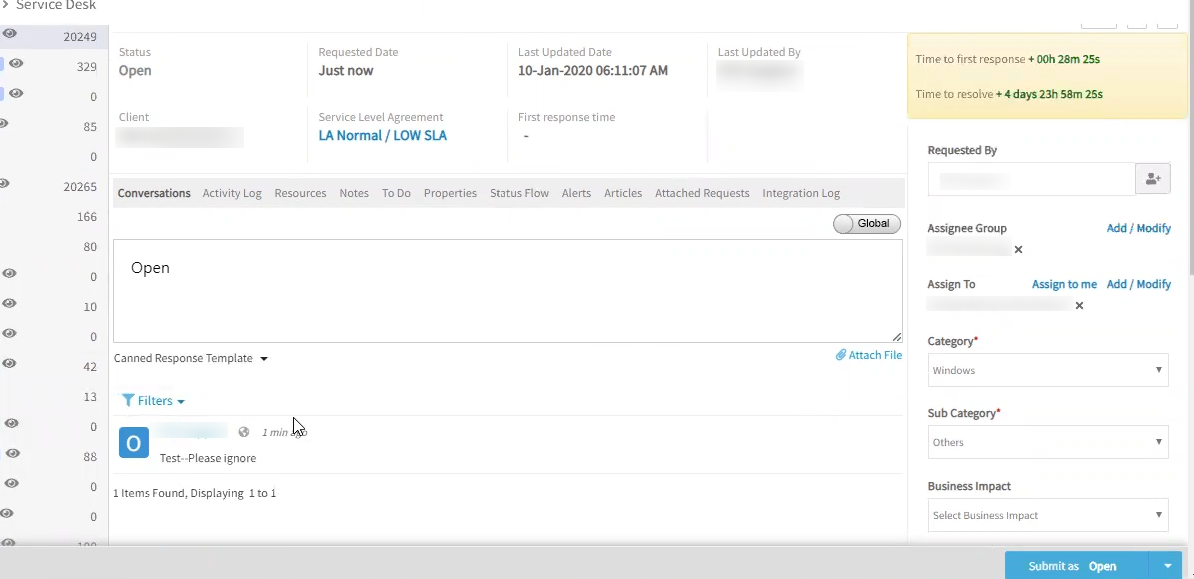
First Response time is not getting updated after updating the ticket
Issue is fixed.
When there is description or content and user switches to another ticket tab, showing an alert message, “You will lose the description once you move to another tab, do you want to continue?”

When there is description or content and user switches to another ticket tab, showing an alert message
Once the status is updated, the Time to First Response stops. The activity log captures the data. The SLA reminders are not sent.
Also, after the Incident is resolved, and there are no SLA reminder notifications sent.
Removed blocked E-Mail address from Blocked List issue
User configured 1 E-Mail address in “Blocked Mail IDs”. Then sent an E-Mail to “Email Incidents Integration”. As a result, ticket creation got rejected from the E-Mail address. It is working fine. Next, the user removed the E-Mail address in “Blocked mail ids”. The ticket of the rejected mail was created after 10 minutes.
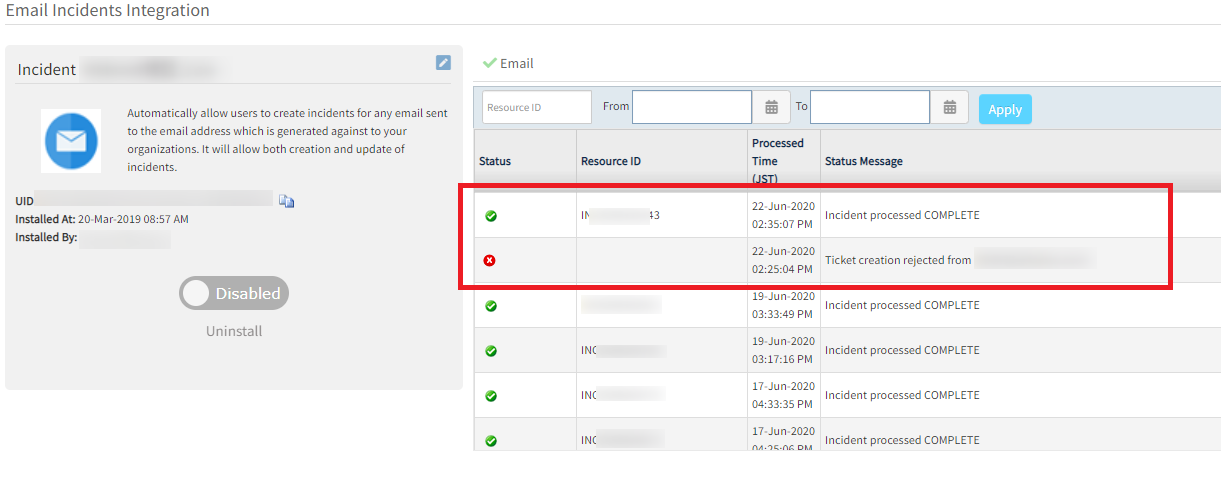
Removed blocked Email address from Blocked List issue
Wrong exception class being called when invalid exception is invoked.
Issue is fixed. Correct class with right status code will be returned.
Resource Management
Advance Search times out or provides results after a long period of time
The user has tried multiple queries with no success. It takes more than 1 minute or even more to provide the results.
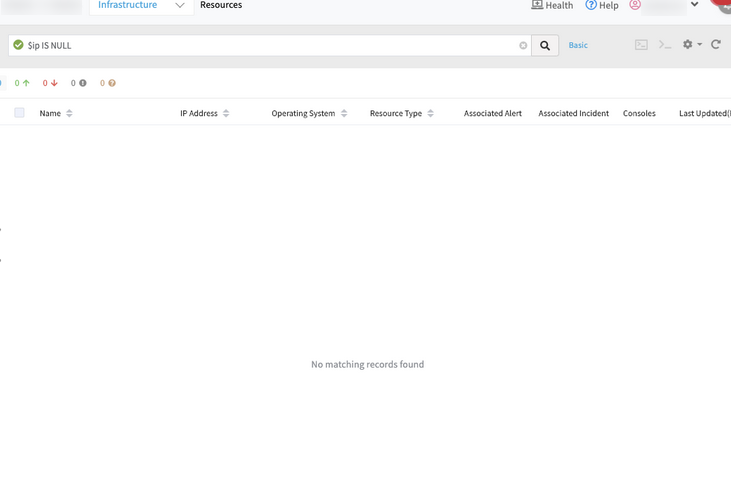
Advance Search times out, or provides results after a long period of time
The default page size value of 40 was not set to the Elastic search query builder. So, the search API takes huge time for large number of resources. It results in 504 Gateway timeout error.
Issue is fixed. Made changes to pass the default size to the query builder. Advance search is working perfectly.
Device Management Policy is not applying to the resources
When a new device is created with un-managed state, if this device matches any policy, this policy is not applying to the given device when changed the state from un-managed to manage.
It is happening because whenever user moves the device from un-managed to manged state manually, getting concurrent modification exception. So, templates are not getting assigned.

Templates are not getting assigned
Whenever a device comes to the IndexHandler.java, checking the device state is changed or not; if this happens raising an event to rules engine.
Issue is fixed.
Created a device and unmanaged the device manually. Created a policy which matches the criteria and ran the policy. As the device is in unmanaged state the policy did not apply on the device. Managed the device and the template got assigned automatically.
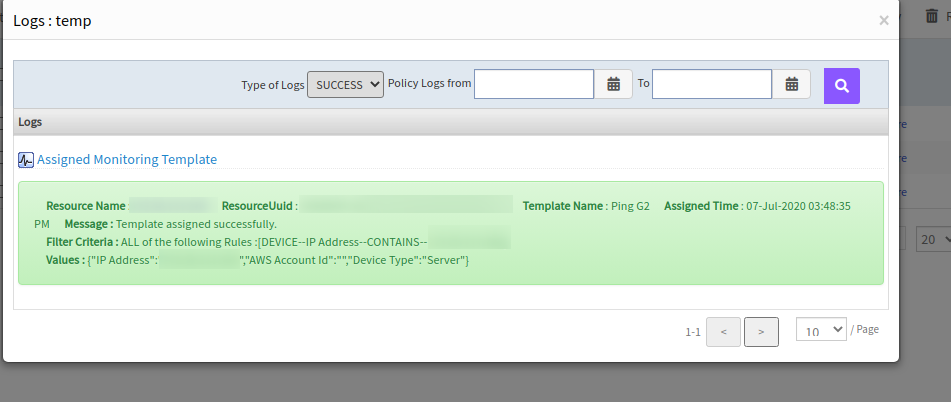
The template got assigned automatically
Tenancy and RBAC
Assign / Unassign buttons are not displayed in the Monitors Tab
The users have Admin roles with Monitor manage and Metrics manage permissions, but still unable to view the buttons.
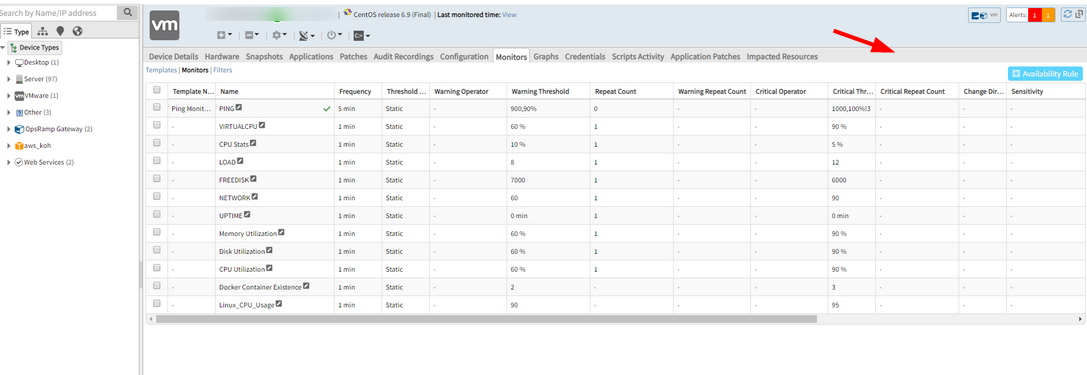
Assign / Unassign buttons are not displayed in the Monitors Tab
Issue is fixed. The Assign and Unassign buttons are displayed both in the Old and in the New UI.
Re-authentication on changes to profile details
Changes to the following pages now require re-authentication with two-factor code while using mechanisms such as FIDO U2F, TOTP, and YubiKey. This feature is for added security. Navigate to My Profile, Setup > User Details | Partner Details | Client Details.
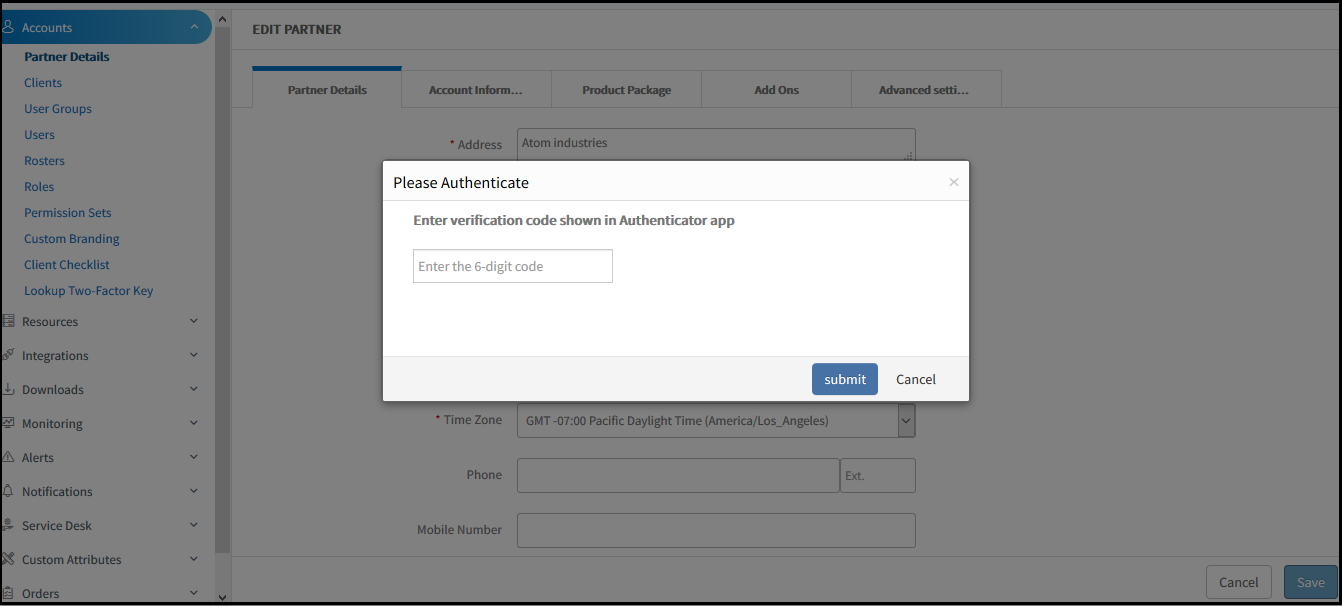
Re-authentication on changes to profile details
Remote Console
Garbled characters in Notes of Audit Recordings
If the user adds a comment in Japanese when connecting to the remote console, the characters are garbled in Notes of Audit Recordings.
This issue is happening after upgrading SAAS 5.3.1 in JP POD.
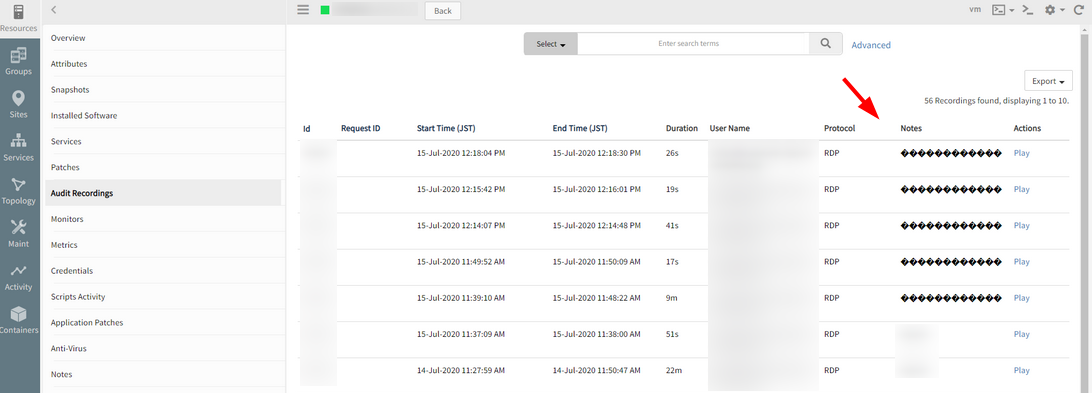
Garbled characters in Notes of Audit Recordings
Validated the garbled characters in Notes of Audit Recordings with a new test console connection. CS Nodes were restarted. Issue is fixed.
Package Management
Partners can now see the packages that they have subscribed to on the partner details page.
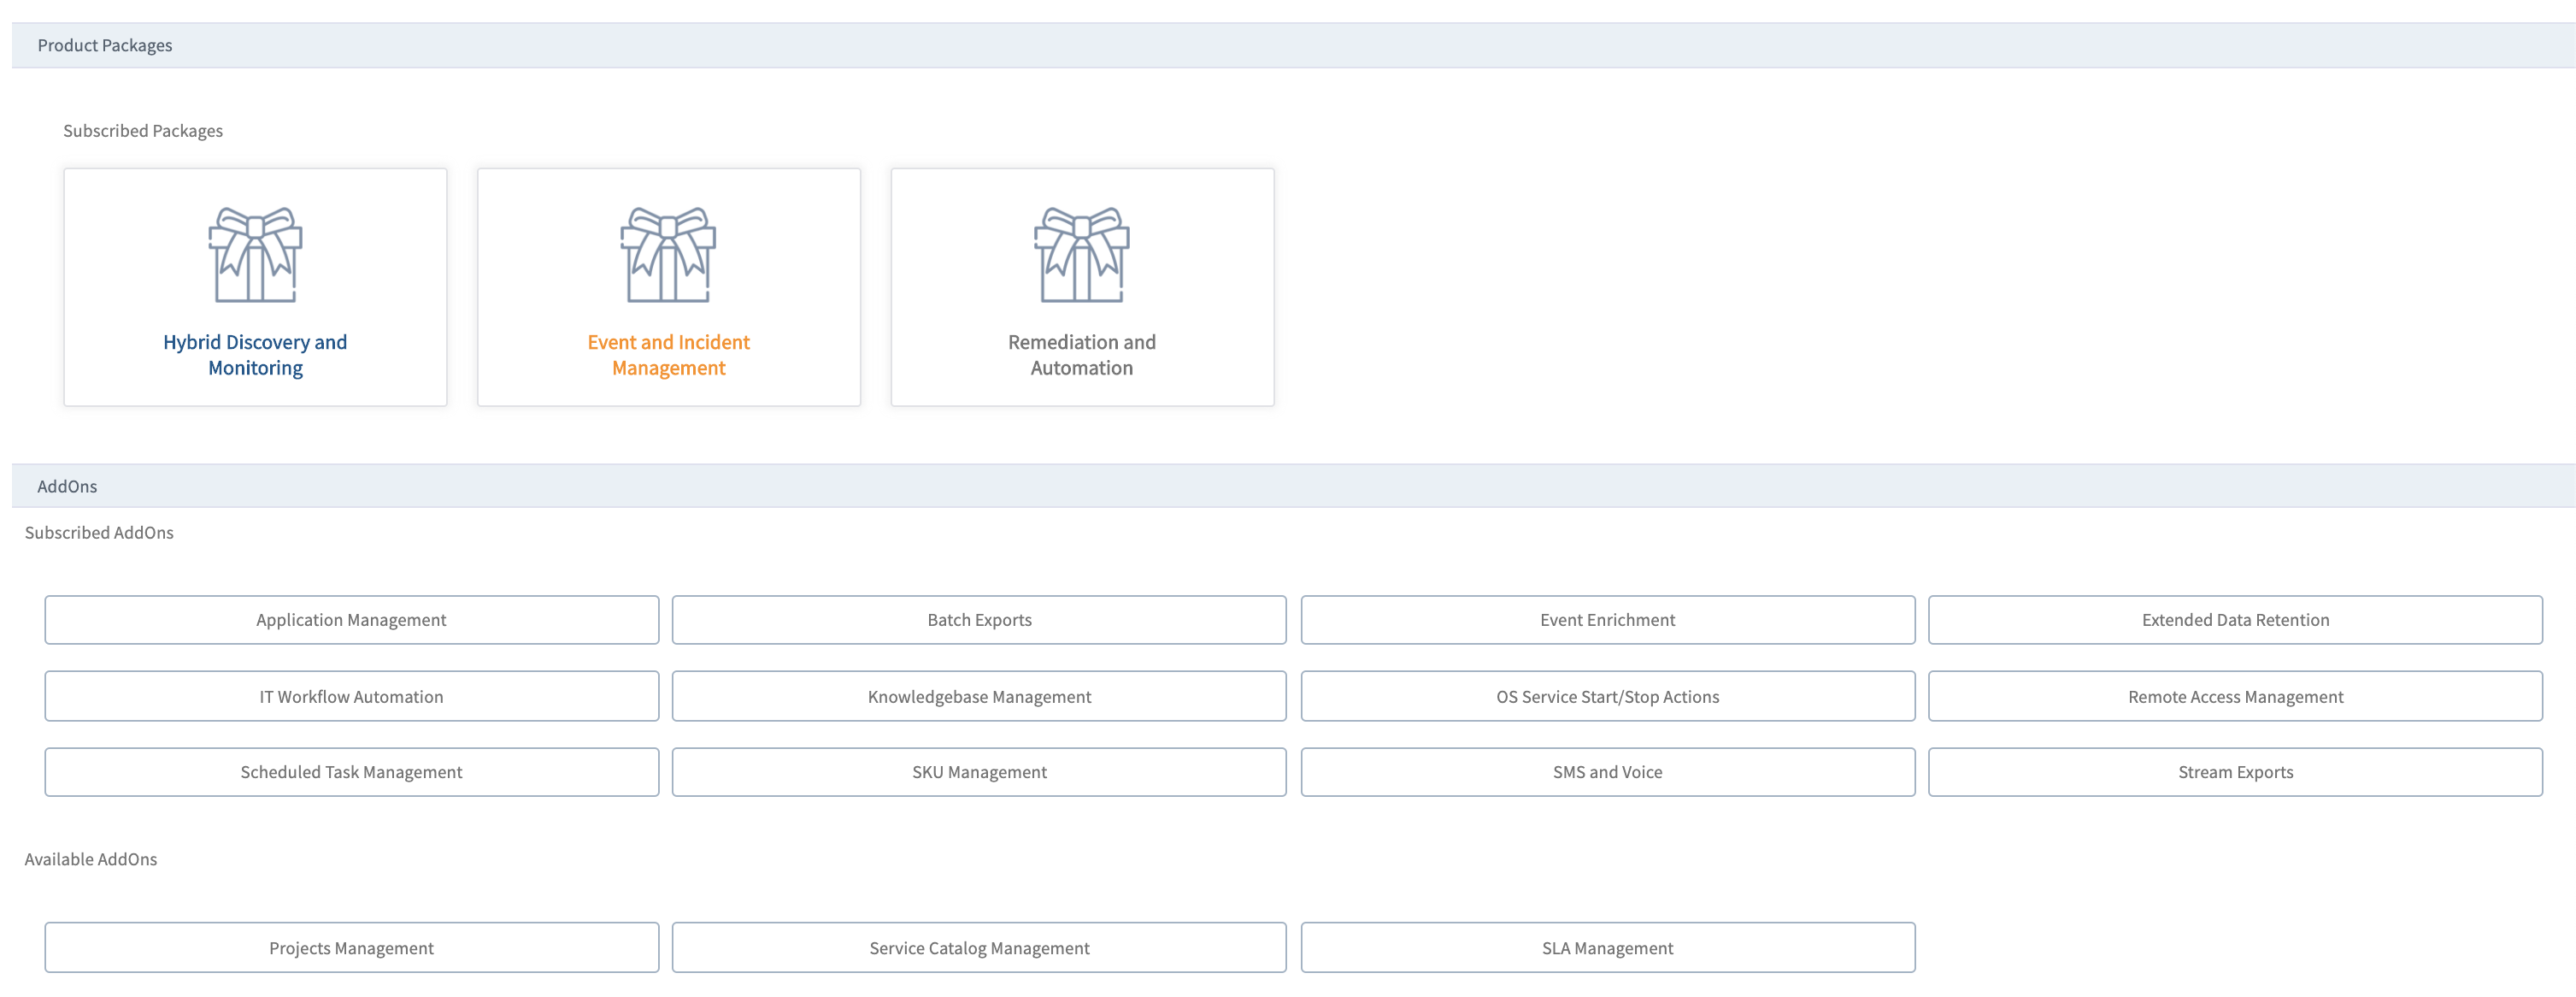
Package management
When a partner administrator is configuring a client, packages to which the partner has subscribed are available to the partner to offer their clients. With this option, a partner can offer select packages or modules to different clients.
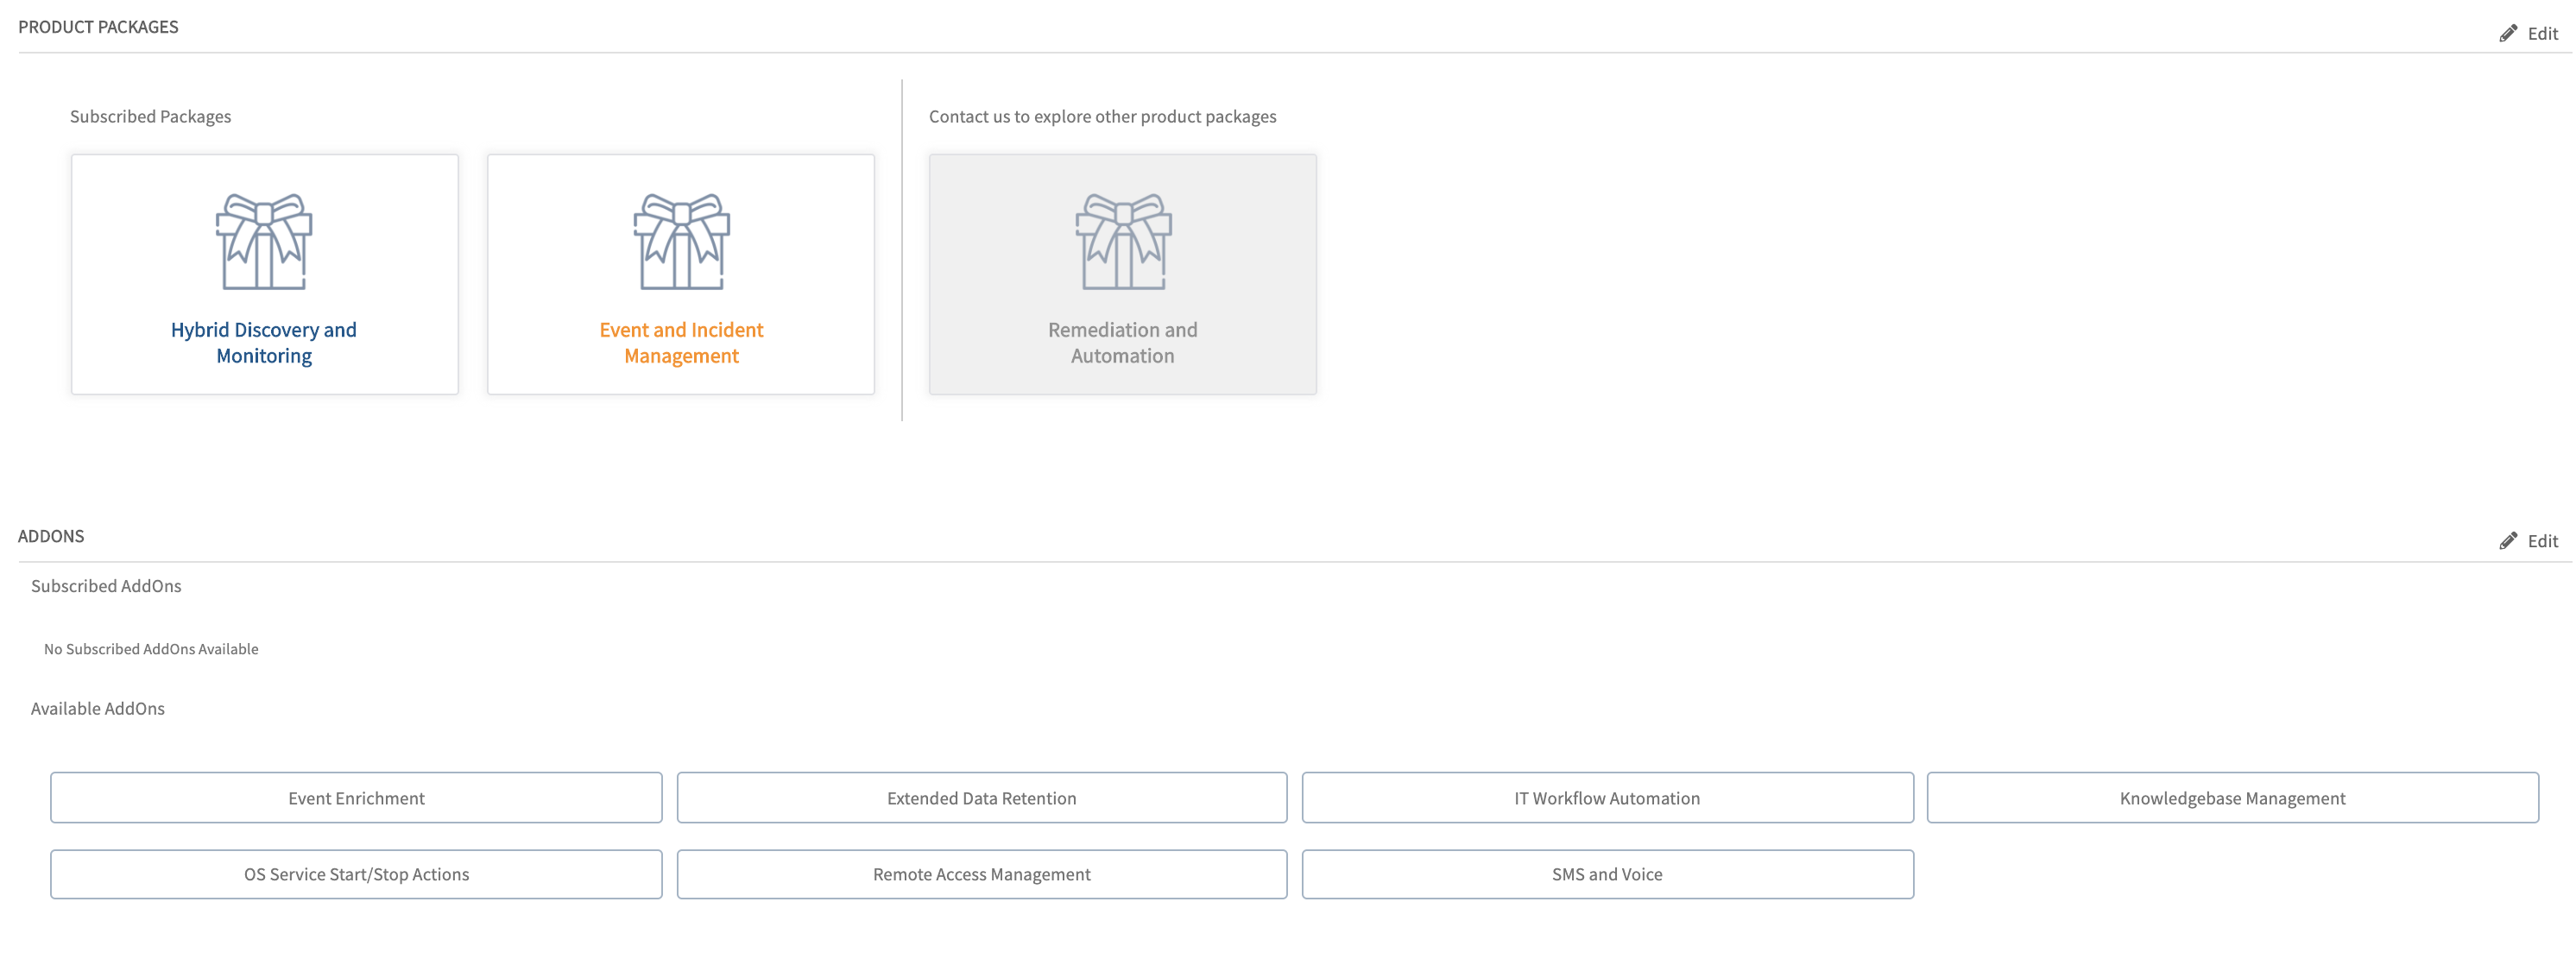
Package management
Documentation site changes
The product documentation site is now improved to include:
- Simplified topic layout and navigation.
- Improved search.
- Improved API documentation.
- New topics focused on conceptual overviews, getting started, and onboarding the managed environment.
Deprecated features that are no longer available
As announced earlier, the following features are no longer available in OpsRamp. See Deprecation Notices for more information.
- Runbooks in legacy scripting languages.
- Neustar event integration.
- Auto user creation in email-based integrations.
- Post-install access to integration key and secret.
- Permanent suppress action on alerts.
- Canonical metric names