Release Date: September 2021
Introduction
We are excited to announce our 8.0.0 update!
This release is heavily focused on our Discovery and Monitoring solution. Our goal is to provide a streamlined monitoring experience for teams looking to gain visibility into Public Cloud and Kubernetes-based applications and workloads.
Dashboards and User Interface
UI tours
The UI includes feature tours that educate you about new features. These tours either take you through the steps of a process or highlight a feature with a short description.
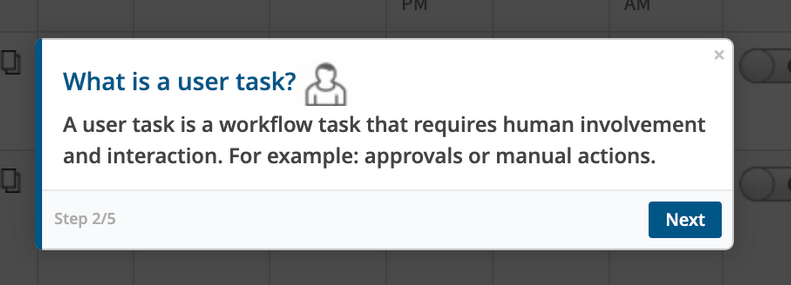
UI Tours
Unable to export all the client information from Setup
Getting timeout exception when exporting the clients information, due to unusable code (suspected). Export is not working only with Service Provider login and in 8-0-0 build. When tried exporting the clients information again, getting empty report; org instance of service provider does not work as expected.
Timeout exception when exporting the clients information
Will use Authentication context to check for service provider login.
Issue is fixed. Client export is working properly.
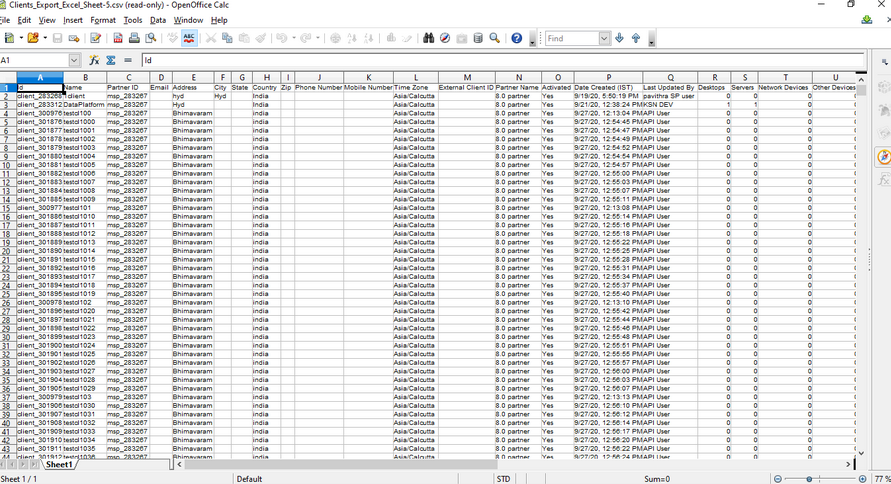
Export is working perfectly
Gateway Timeout Error when clicked on “Interfaces” tab
Unable to see any interfaces under the Interfaces tab.
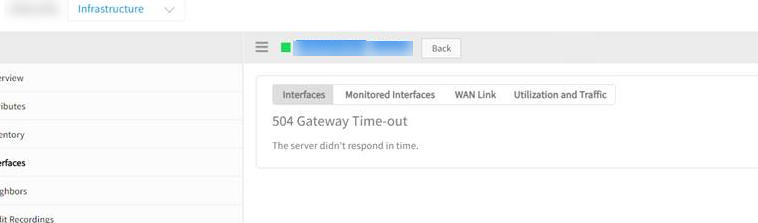
Gateway Timeout Error when clicked on Interfaces tab
Issue is fixed. Removed the G1 monitoring engine dependency in the below areas:
- Interface listing page
- Interface details page
- Interface popup
- Interface utilization and traffic
Dashboard graphs are not plotting
Graphs are not populating for network in and network out metrics.
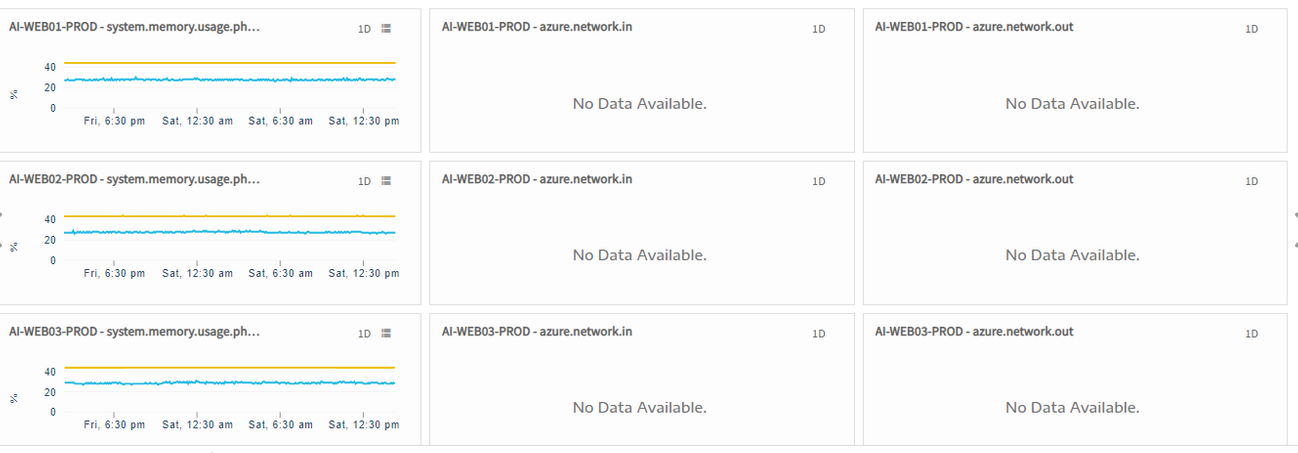
Dashboard graphs are not plotting
Issue is in migration script for azure metric names. Not all entries which require migration are matching the condition in the script. Changed that condition and ran the new queries.
Issue is fixed.
Sites are not loading
Sites information is not loading. Tried to access it from various browsers and cleared the cache as well, but found that sites are not populating.
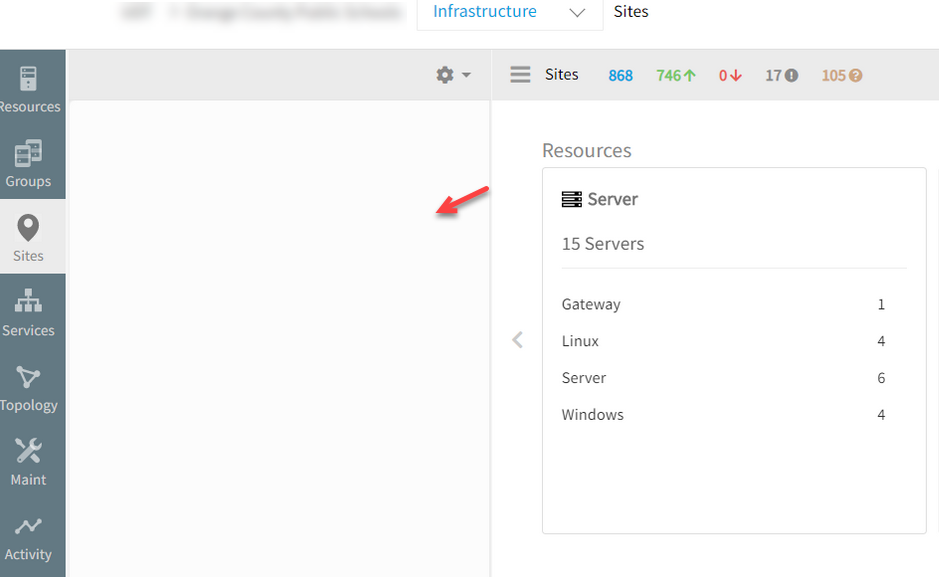
Sites information is not loading
RCA: When clicking on Sites tab in infrastructure, unable to load the information.
Avoided two DB calls to get all root and child locations and used one call to get all locations and checked in for loop, if it is parent or child. Replaced DB call with memcache to get location in loop.
Issue is fixed. Sites are loading perfectly.
Unable to export CSV/Image from Metrics tab
The user is unable to export to CSV/Image graph data, for any of the VMware devices.
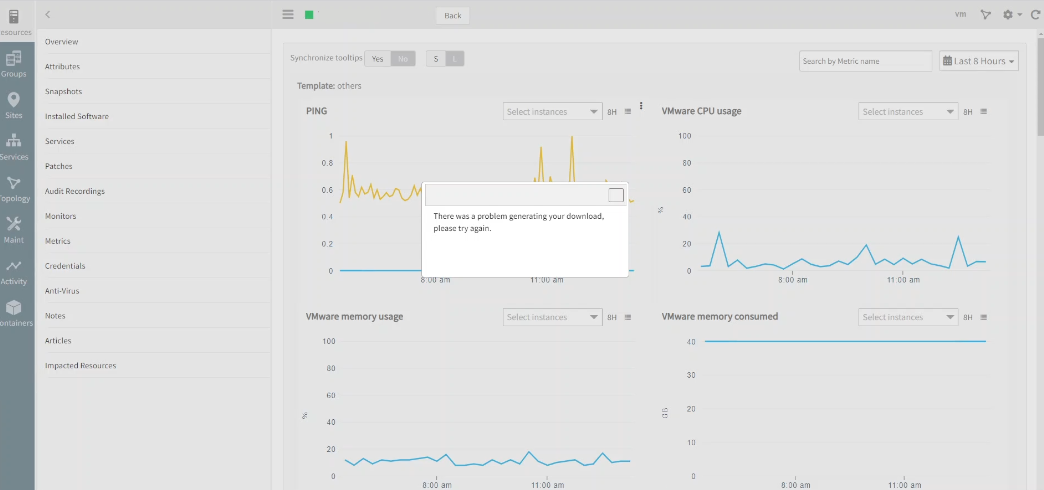
Unable to export to CSV/Image graph data
While adding time duration to file name casting exception was thrown due to recent changes of json library.
For timestamps, handled the fix accordingly to avoid casting issues. Issue is fixed. Able to export perfectly.
When exporting Custom Range graph to csv, the specified time shifts by 9 hours
Customer encountered an issue with Metric Graph Export option. When exporting Custom Range graph data to CSV, the specified time shifts by 9 hours.
The Custom Range selected is from 01-Jul-2020 12:00 AM to 31-Jul-2020 11.59 PM. But the csv file name is “_system.ping. _AVG_Wed 09 00 00 UTC 2020_Sat 08 59 00 UTC 2020.csv”. And the time in the csv file is from 9:00 AM.
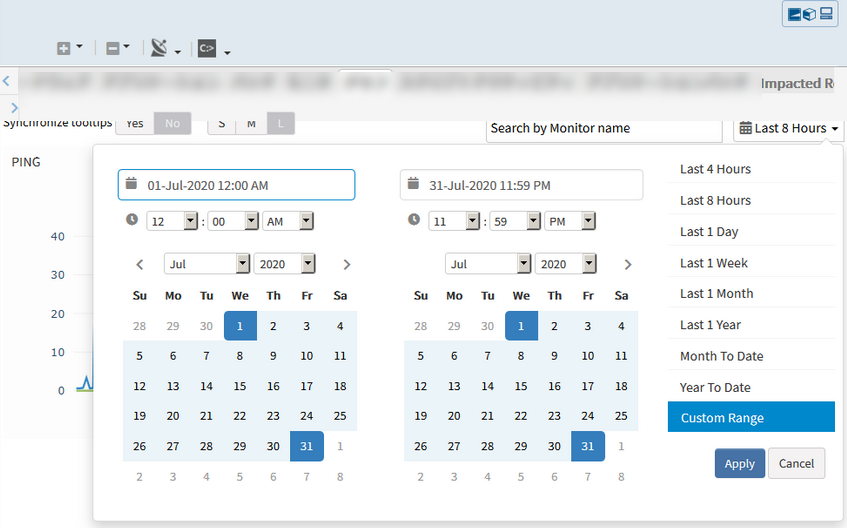
Custom Range selected is from 01-Jul-2020 12:00 AM to 31-Jul-2020 11.59 PM
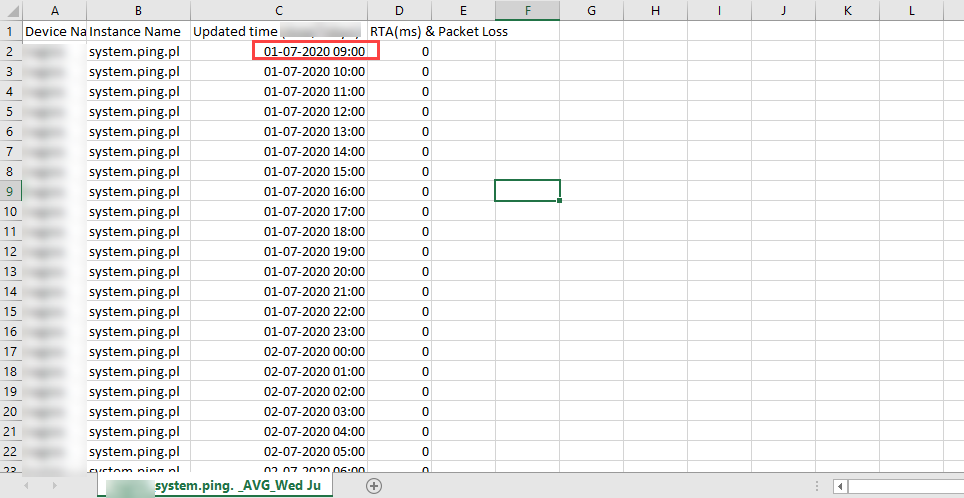
Time in the csv file is from 9:00 AM
When exporting the csv report in metrics tab, the data has a mismatch with whatever is seen in the graph due to the custom range start and end dates that are not same as we pass when we click Apply in UI.
Issue is fixed. As the start and end dates are getting replaced with different values while exporting, removed the intermediate code that is replacing the correct values in jquery widget js.
Start and End dates are displaying fine in .csv according to user timezone.
Device Group not showing CPU, Storage and Memory metric values
System CPU utilization for new Agent G2 monitoring which is no longer showing in the group system.cpu.* / system.memory.* / system.disk. The metric values are not showing in device groups page. This is affecting all groups.
No graph is displayed
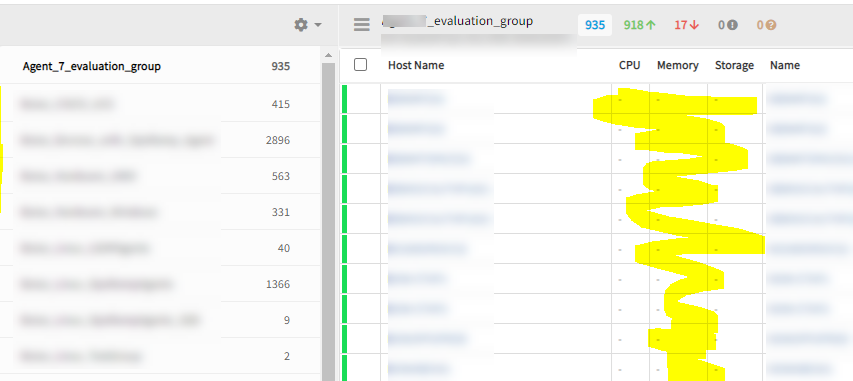
Device Group not showing CPU, Storage and Memory metric values
Group names for G2 monitors in metric types schema cause this issue.
Metric APIs issue resolved with disable tls protocol configuration in load balancer. Group name updated in metric types tables for G2 monitors.
CPU, Storage and Memory metric values are displaying perfectly at device group level.
Discovery profiles are not getting removed
Unable to delete the discovery profiles of unregistered gateways. Got an error Request failed with the status code 404.
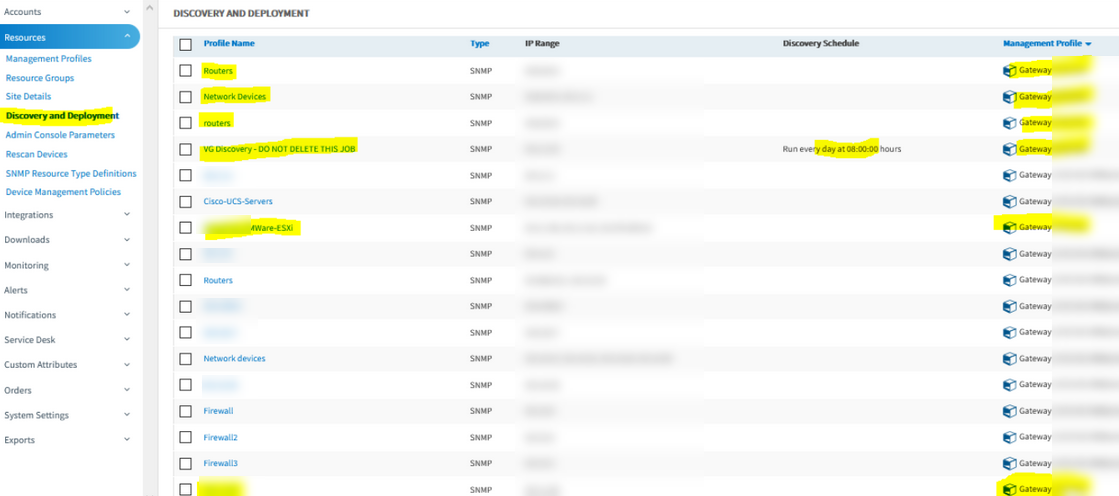
Discovery profiles are not getting removed
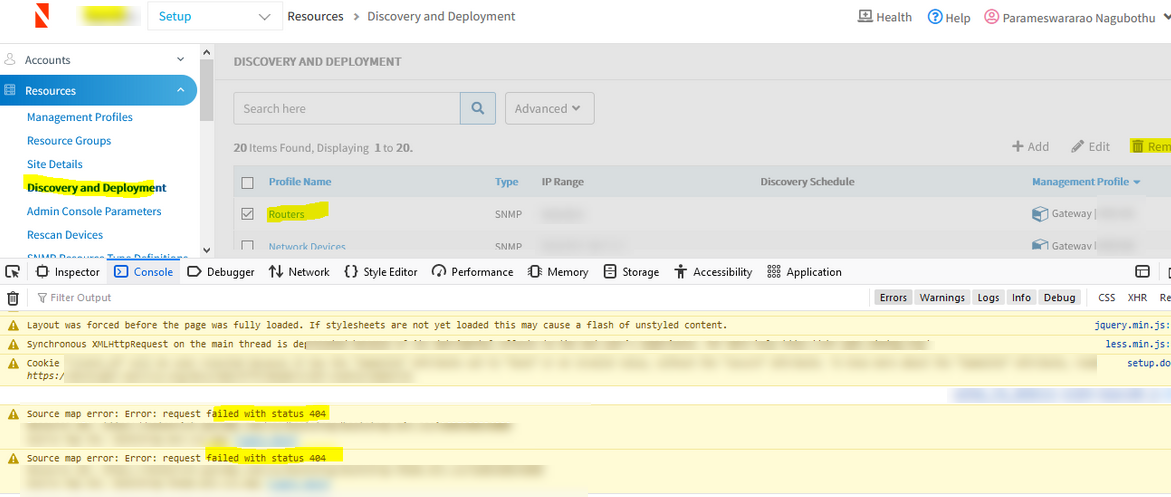
Request failed with the error status code 404
Not validated in null condition. Added null check. Issue is fixed.
Able to delete discovery profiles from unregistered gateways.
Inference stats widget is not showing data
In partner dashboard, Inference stats widget is not populating any data.
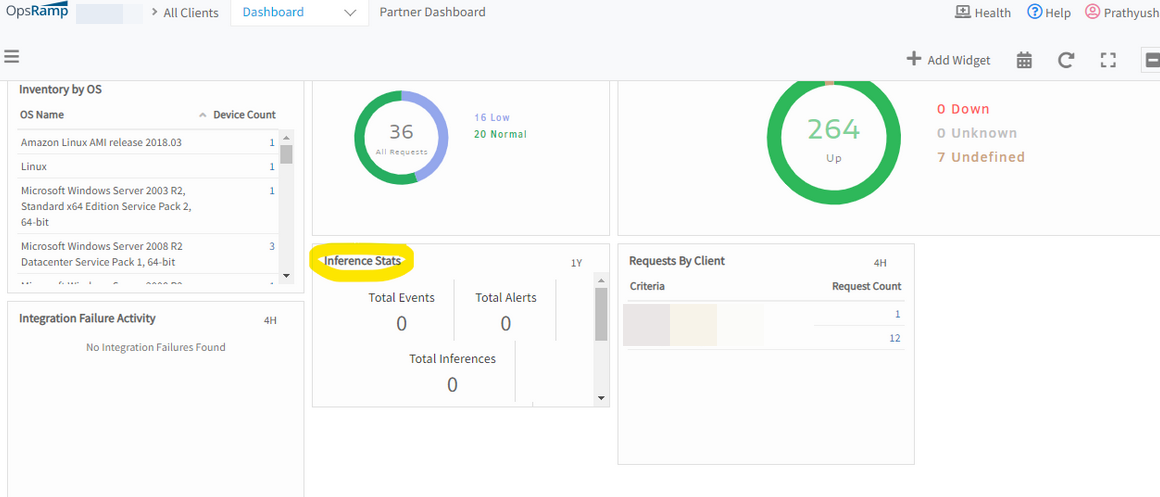
Inference stats widget is not showing data
Inference stats widget is not showing data in partner level dashboard. Inference stats widget is showing data in client level dashboard. The root cause of this issue is partner level stats did not get saved into DB.
Saved the partner level stats into the DB. Issue is fixed.
Able to view data in inference stats widget for partner level dashboard.
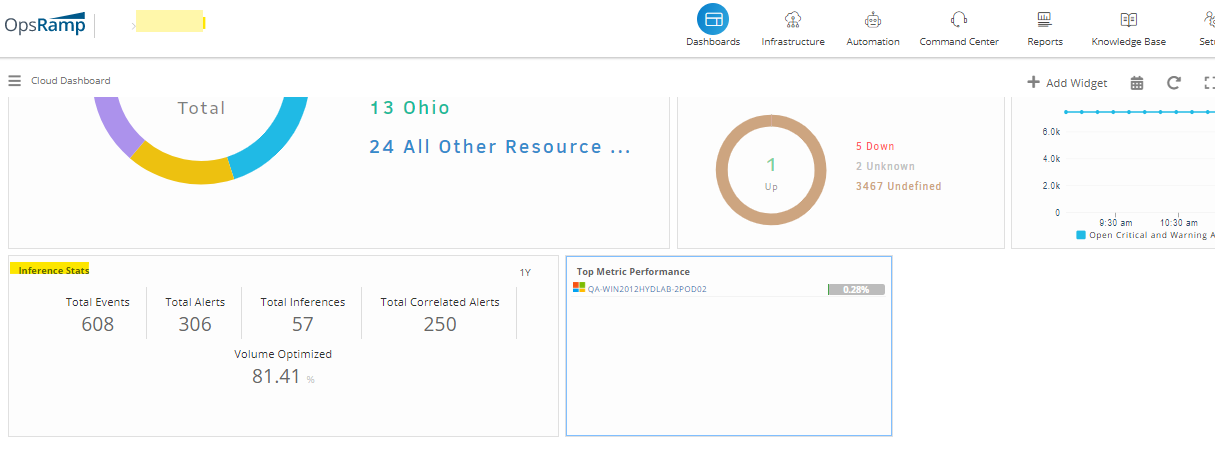
Able to view data in inference stats widget
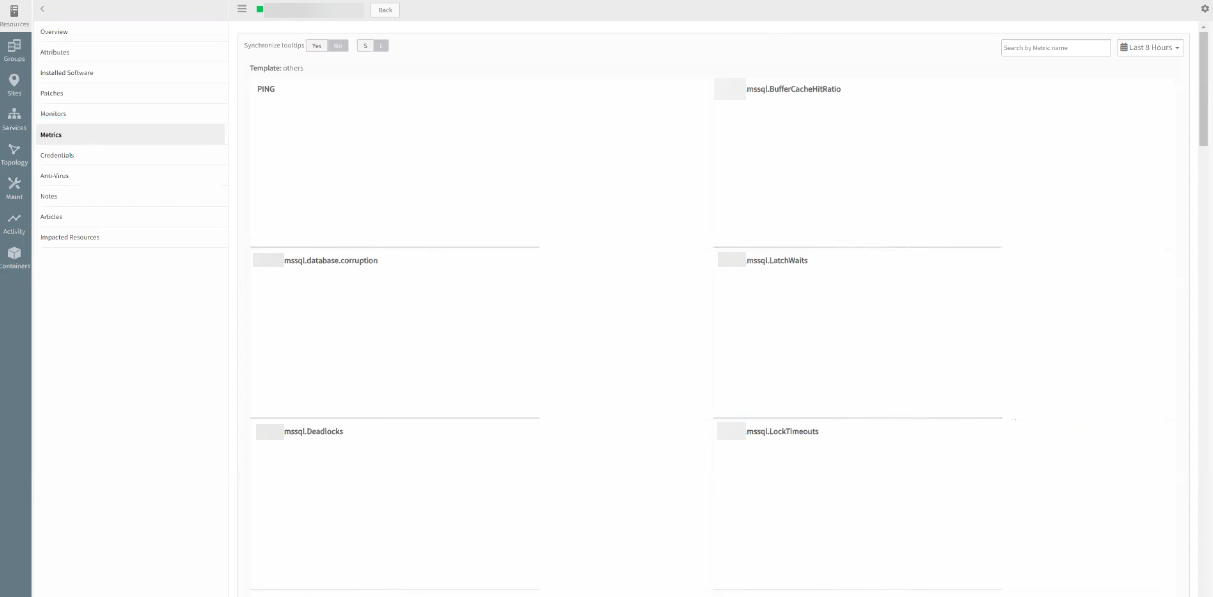
Global time change is not applicable for all metrics
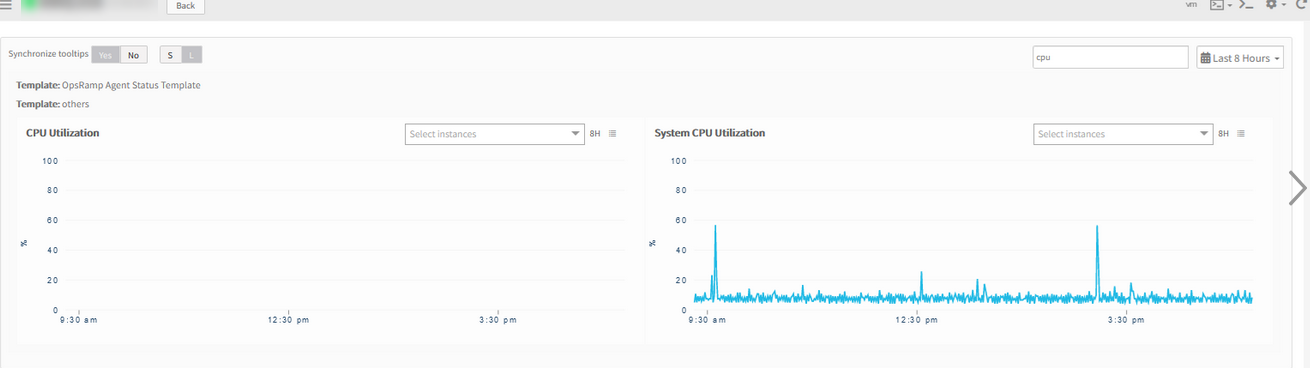
On the Metrics page in the upper right-hand corner, changed from default ‘8 hours’ to e.g. 1 Month, roughly 50% of metric graphs are updated, the other 50% remain unchanged at ‘8 hours’. The graphs do not adhere to the selected range. They default back to 8 hrs.
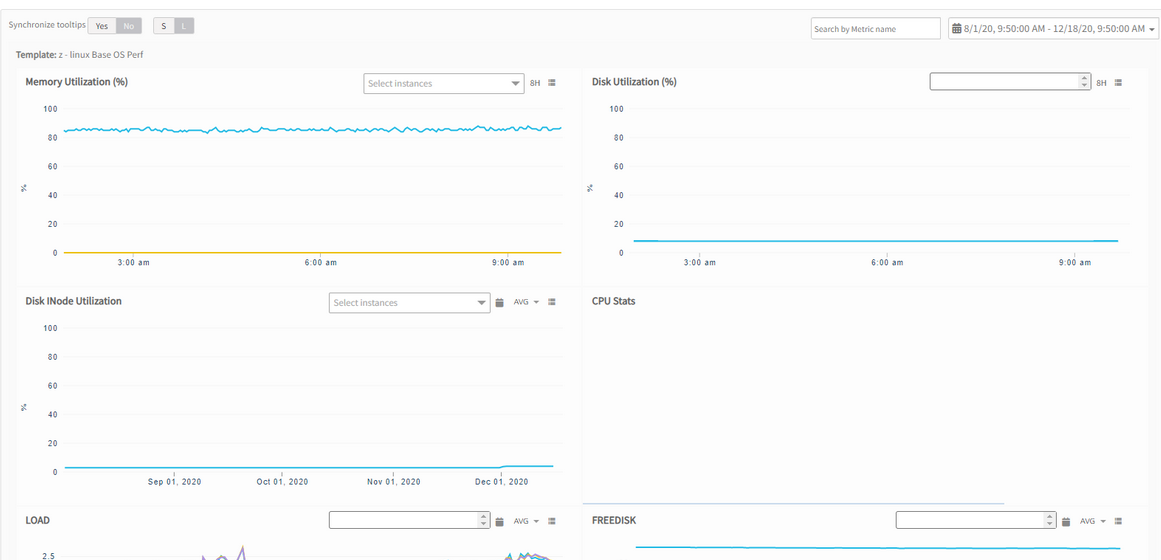
Only 50% of metric graphs are updated
In the below case, though custom range is selected, many metric graphs show default value (not working as expected), except for disk utilization graph.
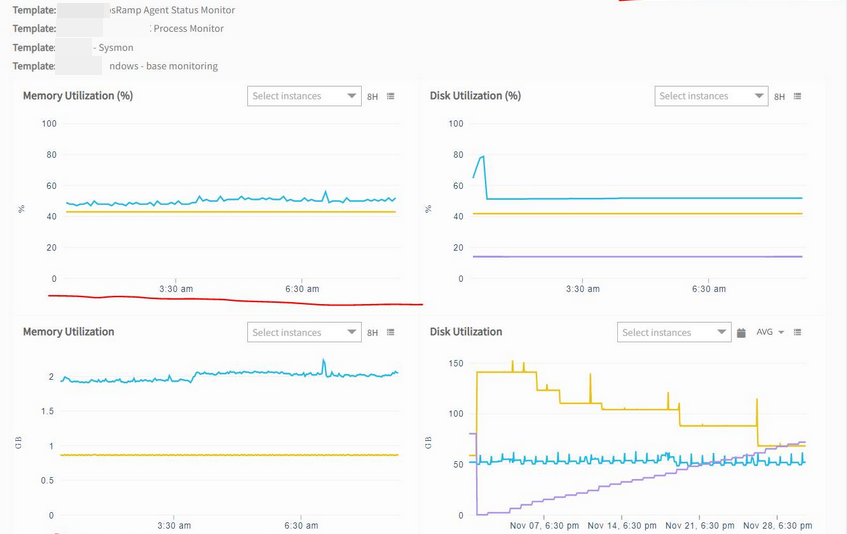
Many metric graphs are not working as expected, except for disk utilization graph
Due to dynamic loading of widget, widget content is loading multiple times. Due to this, multiple requests fire in which duration seconds are not passing correctly.
Added a check to restrict the multiple calls for one widget. Issue is fixed.
Global level custom time is working perfectly on all the displayed metrics.
No error is displayed when creating a duplicate metric
When trying to create a metric which is already existing, not getting any error like ‘Name Already Exists’. When clicked on Save it gets stuck and page keeps loading. This is happening for client level metrics.
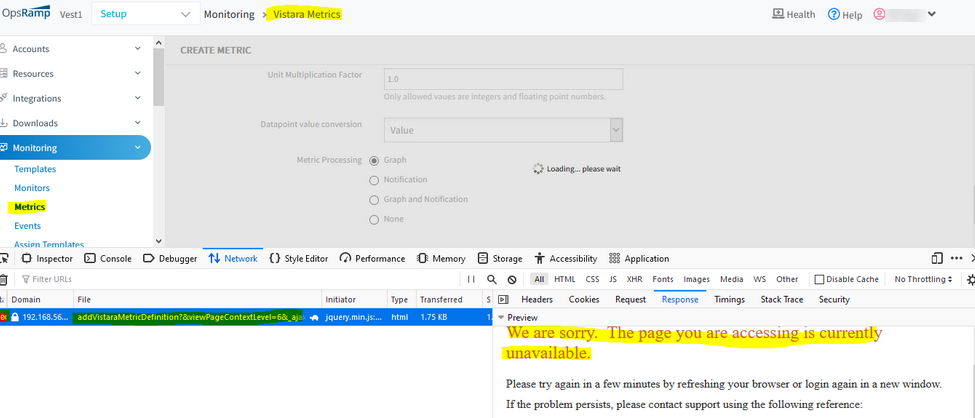
Page is getting stuck and keeps loading
Root cause of this issue is while creating new metric, not comparing the metric name with client level metric names from DB. By that, facing the issue in backend. In the “metric_types” table, metric name is unique in Global, SP, Partner and Client levels. So, the page keeps refreshing.
Issue has been fixed by comparing the new metric name with client level metric name as well from DB.
No data available
When clicked on any graph, an error message is displayed, “No Data Available”.
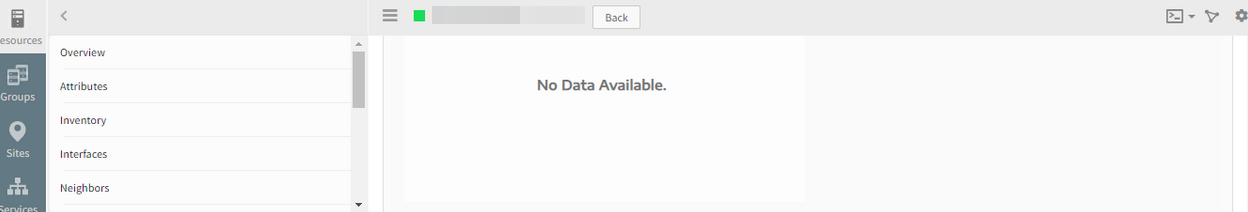
No data available error
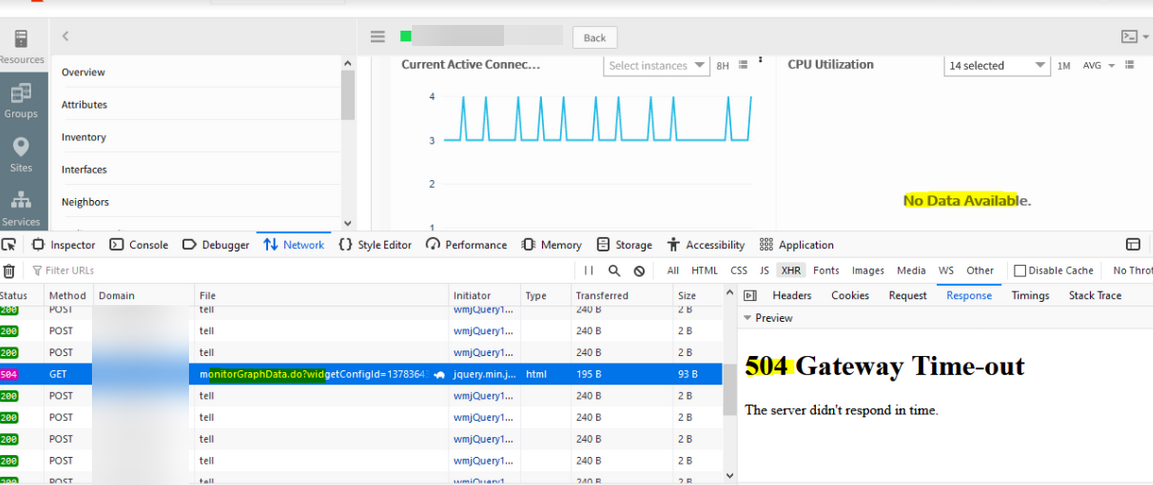
504 Gateway timeout
Facing Gateway timeout issues when selecting individual instances in any particular graph.
Issue is fixed. Added debug statements for the metric API calls.
Response time issues
There are response time issues when navigating to any page in the UI.
When clicked on metrics on the Infrastructure page, for any Windows or Linux devices, the graphs load after a long time. It takes significant amount of time to collect data and load. This happens not only for MSSQL, but for any servers with Operating system monitors, like CPU Utilization, memory utilization, etc.
Graphs are taking a long time to load
Graphs are taking a long time to load
Configuration changes are done. Issue is fixed. The graphs are populating perfectly.
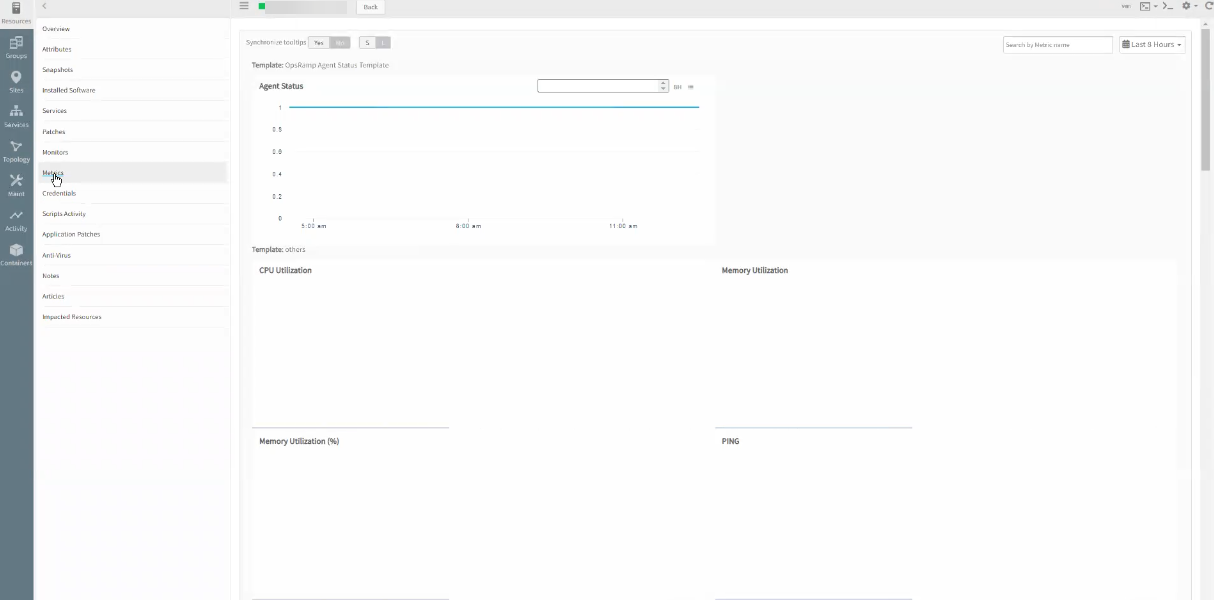
Agent is down, however the agent status line is not changing to 0
The servers are all online and serving traffic without issue.
Agent status line is not changing to 0
When the agent was offline would plot blank graph, but with recent changes filling the blank space with line plotting. This gives an impression that the agent was never offline. Replaced the class file.
Issue is fixed. Able to see the gap in Agent status graph when the Agent is offline or disconnected.
Core Platform
User with Client View permission value is able to Edit the client page
User can add or remove modules.
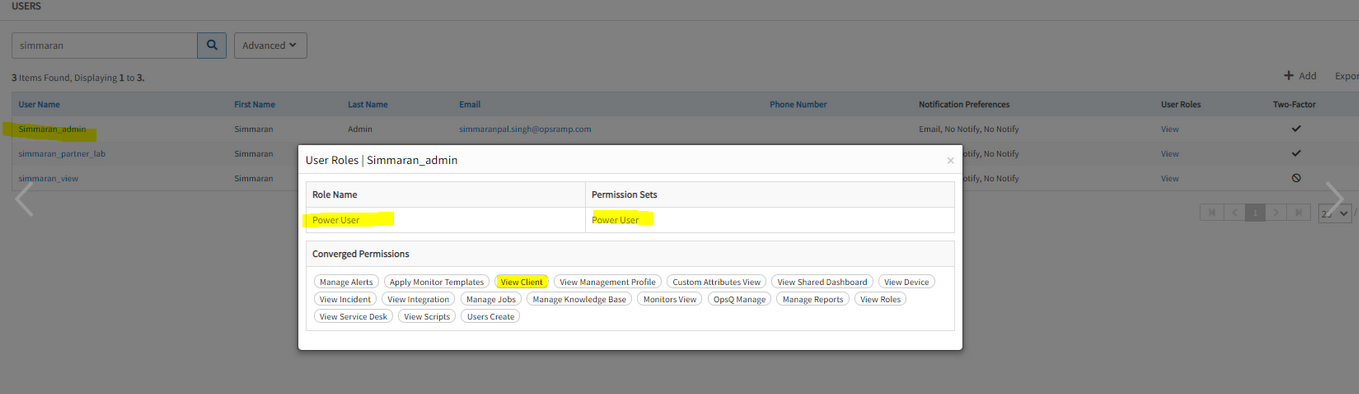
User has Client View permission
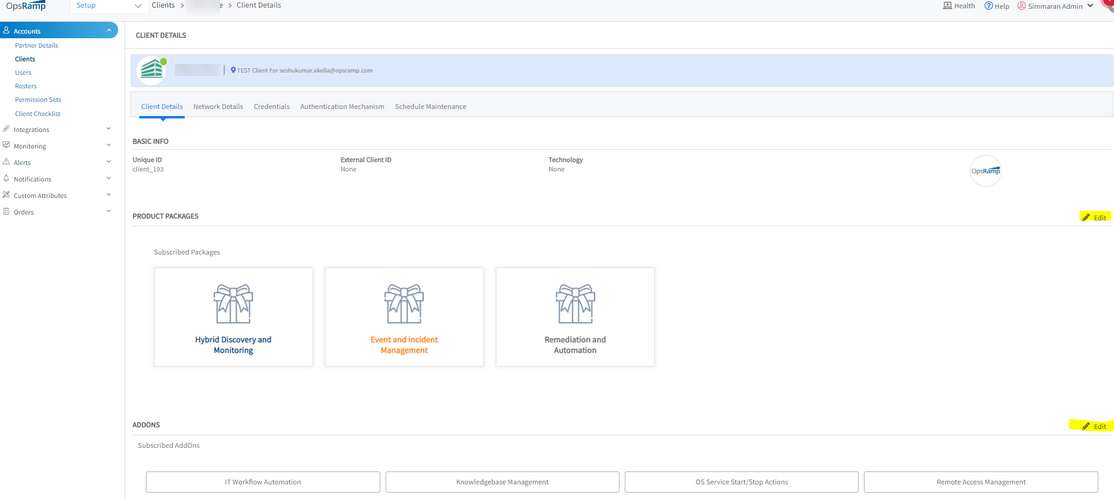
User is able to edit Product packages, subscribed Add-ons on Client page
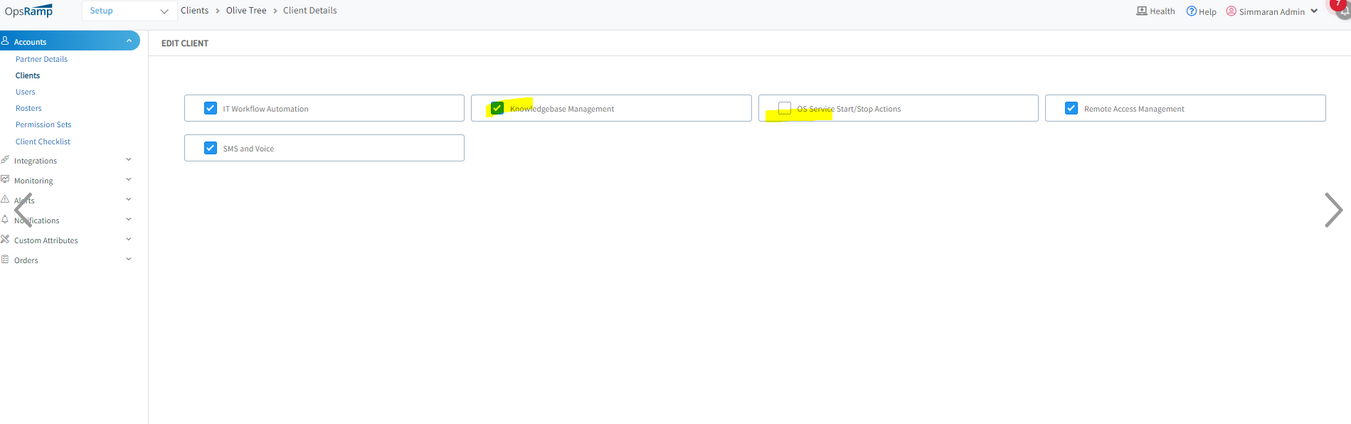
User can add or remove modules
User is also able to edit the bundles and addons in client page even though has only client view permission.
Added the ‘CLIENT_MANAGE’,‘CLIENT_EDIT’,‘CLIENT_CREATE’ as part of the bundles and edit buttons, so that can only edit if the user has any of the above permissions.
Issue is fixed. User with client view permission cannot edit client details.
Agent and gateway management
Non-root linux user
An agent is installable with a non-root custom user.
For more information, see:
Enhancements:
Gateway: The Gateway files (ISO, OVA, Windows Gateway, Google Cloud image) downloaded from OpsRamp are provided with SHA-256 file checksum. This enhancement helps in identifying the integrity of the downloaded file.
Web Services Monitoring
Issue with multiple availability.down.locations.count alerts across multiple clients
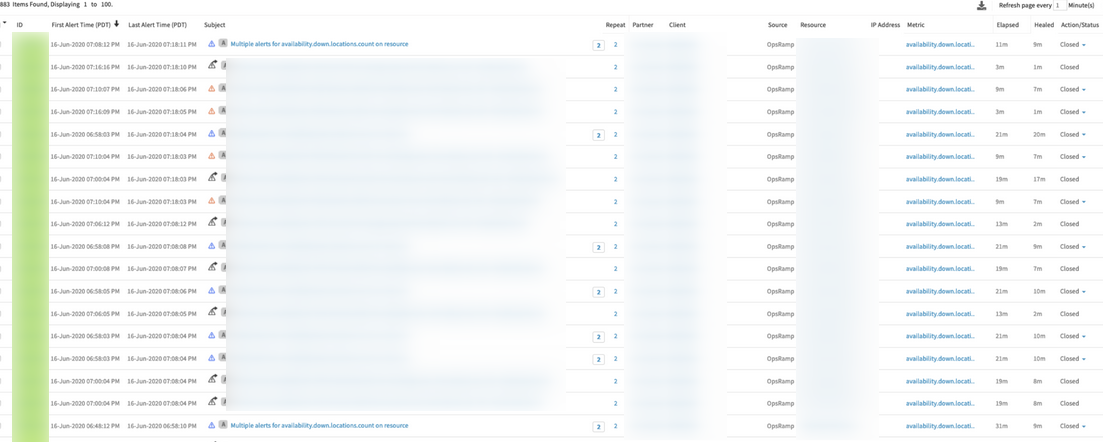
Received multiple alerts on Metric: availability.down.locations.count
Issue in processing synthetic metric data. Fixed the issue in the respective collectors. Everything working perfectly from the collector end.
Web Services monitor does not get monitor data
After a specific date, the web services monitor stopped getting data. This is happening for all the clients.
Web services monitor stopped getting data
While collector is posting metric data, received 407 errors while invoking API (invalid access token / token expired).
After restarting the collector it has picked up the latest access token and metrics started posting to the cloud.
Issue is fixed. Graphs are plotting fine.
Delay in component thresholds taking effect on a synthetic
The synthetic was created, and within a few minutes, a component threshold was configured for it. Even after setting the component threshold to a much higher value than the default the synthetic still alerted over 10 minutes later, based on the default template level thresholds. The component thresholds took almost a day to take effect.
The thresholds did not update for long, and the heal alerts still did not come in.
Heal alert came in very late
Cause: Cache key is prepared with synthetic collector name, but deleting of the key is done by MonComponentThreshold component where as it is having “ALL”.
In case of All, deleted the key of resource with all of the location names.
Issue is fixed. Alerts are triggering fine while editing the component thresholds from high values to low values. The alerts are also triggering perfectly soon after matching the thresholds.
SSL web service monitoring is failing
Used SSL option of web services and uploaded certificate and key file, but unable to monitor URL.
Not taking SSL certificate and private key, uploaded in the HTTPS web service page, into consideration.
The SSL certificate entry and private key are not needed to validate the SSL of the URL. Removed these configurable options from the UI to avoid confusion.
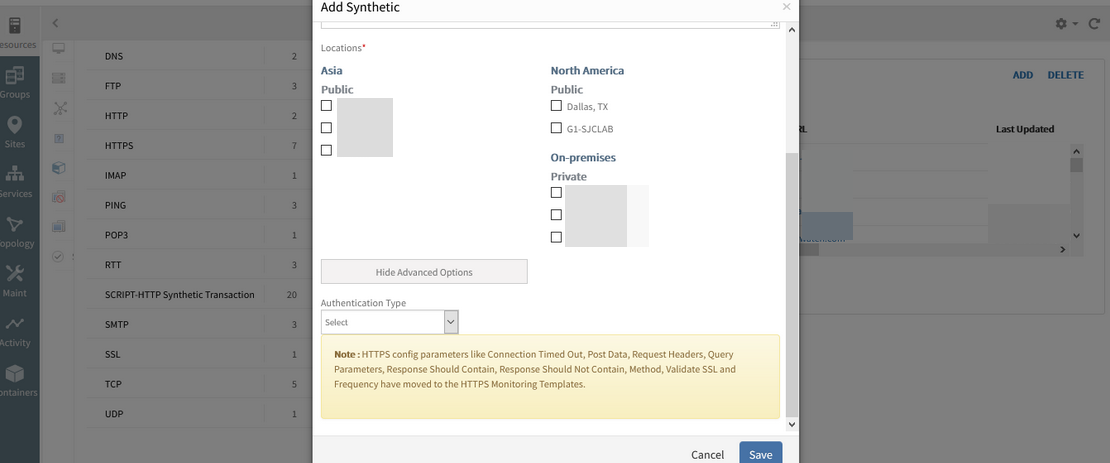
SSL certificate selection is removed in the UI
From Collector end not processing these options, so decided to remove these from HTTPS type.
Hid SSL Certificate (.cer, .crt) and SSL Certificate Private Key from HTTPS type from UI while creating a synthetic.
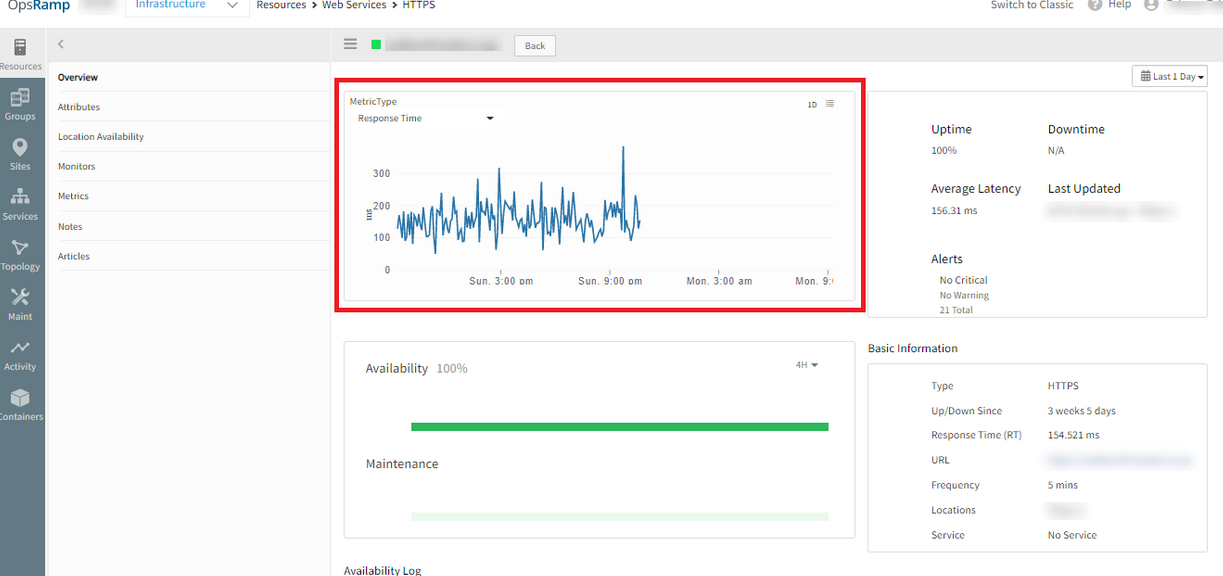
Instances not getting listed in UI
Overview page for Synthetic resources is not listing instances.
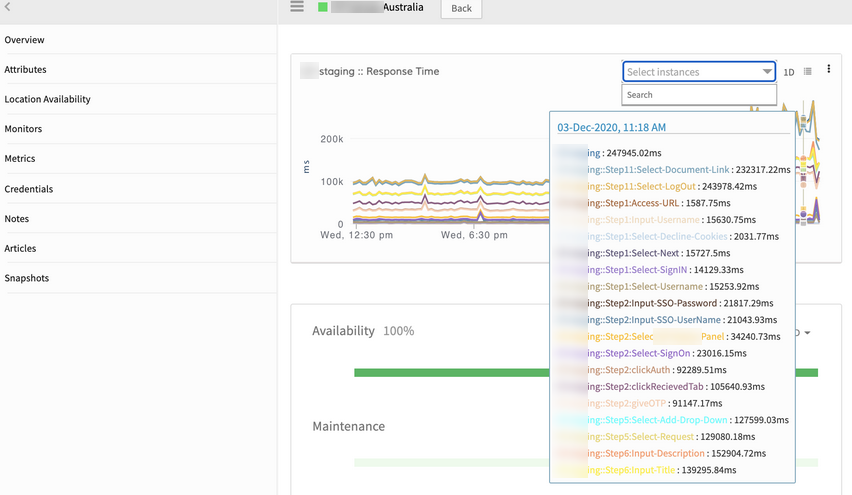
Instances are not getting listed
Keys in json data got changed. Fixed the json data.
Instances are displayed perfectly in the response time graph in the synthetics overview page.
Event and incident management
Auto-suggest processes to run
The first response policy includes a new option to automatically learn, suggest, and run process definition workflows. The auto-suggest feature executes on defined alert criteria.
This auto-suggest feature assists you in performing troubleshooting, triage, and remediation tasks.
For more information, see:
Rule-based first response policy
Rule-based First Response policy allows you to configure the actions by alert pattern and attribute actions.
For more information, see:
Event Management: Administrators can now configure event ingestion integrations to post events only if the resources are managed by OpsRamp. For resources that are not managed, the events will be dropped and not processed.
Outbound payloads automated functional operations
Outbound integration configurations support functional operators on the available token attributes. The following operators automatically extract the content needed for the payloads:

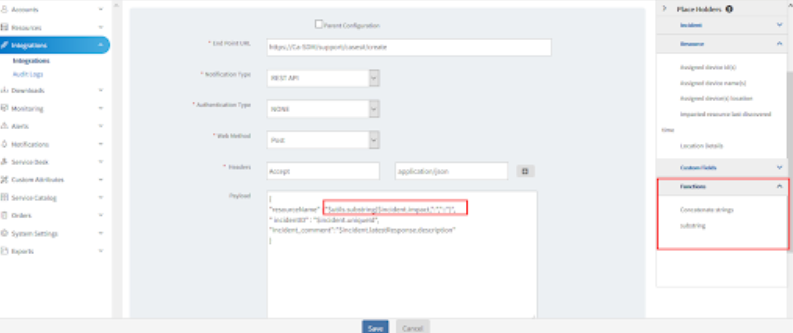
Outbound Payloads
Date and time option
Your profile has a new option to set the date pattern and time format. You can set the time to be either a 12h or 24h clock and the date can be in either dd/mm/yyyy or mm/dd/yyyy format. The date pattern and time format applies across the platform.
Resource availability status on alert suppression
When creating clients, a new setting is available that allows you to ignore suppressed or incident alerts. Options for this setting includes all, suppress, or incident. With incident, alert actions on resolved and closed incidents are ignored.
For more information, see:
KVM Alerts noise
Customer does not have KVM monitoring on the device, but alerts keep triggering.
The alerts are generated with the device name.
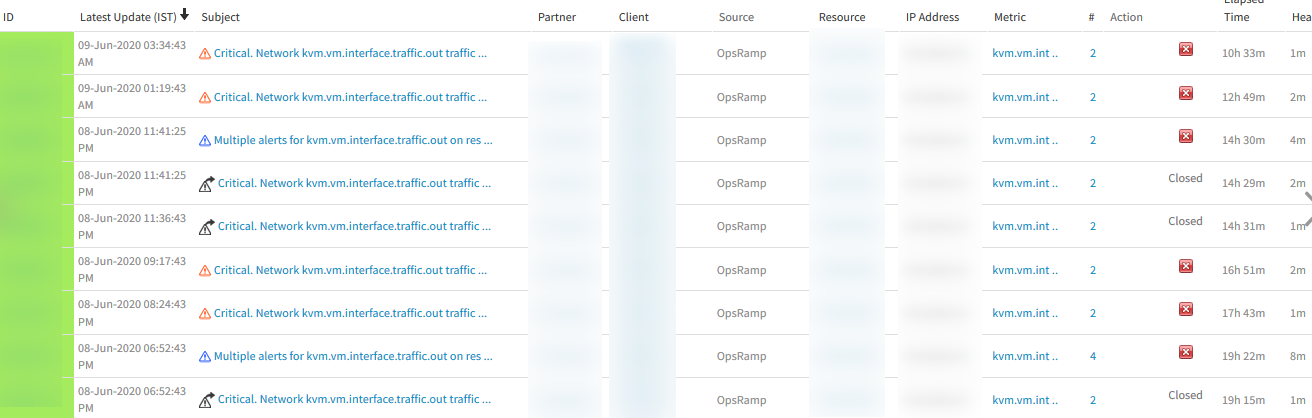
KVM Alerts noise
Code changes are done. Added separate network metrics to have separate graphs.
No alerts are triggered. Issue is fixed.
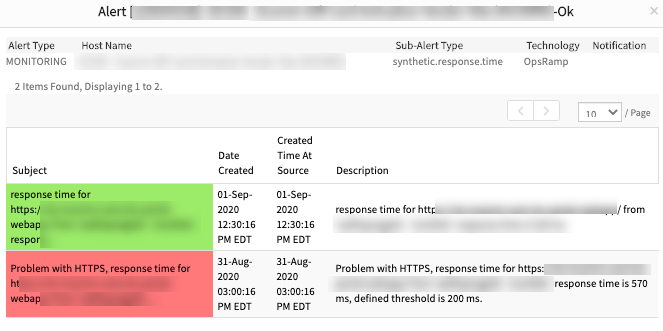
Alert emails showing inconsistent time zone
Two emails were sent for alerts (Critical and OK). One shows EDT and one shows UTC for timestamps.
For critical and warning alerts it is showing Client Time Zone and for heal alert it is showing UTC Time Zone. There is inconsistency in time zones for the same alert.
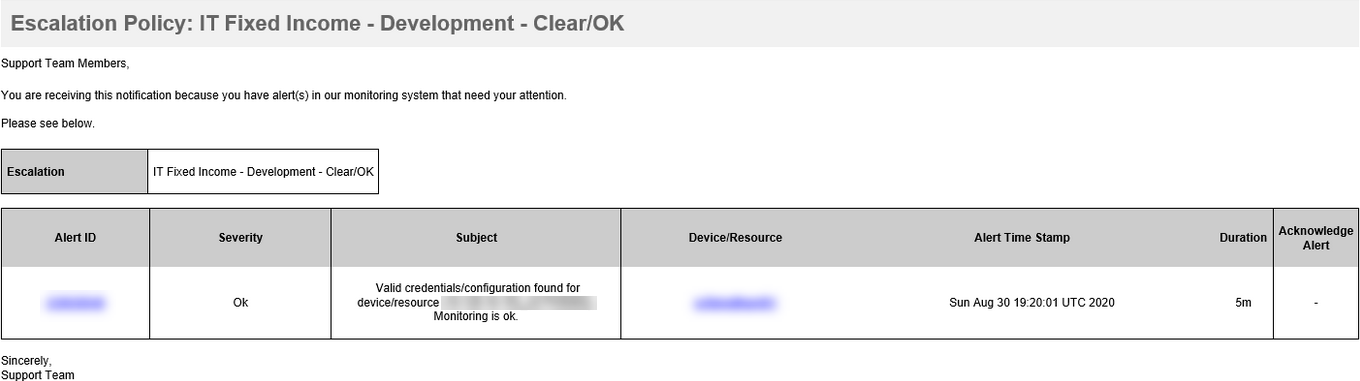
Heal alert is showing UTC Time Zone
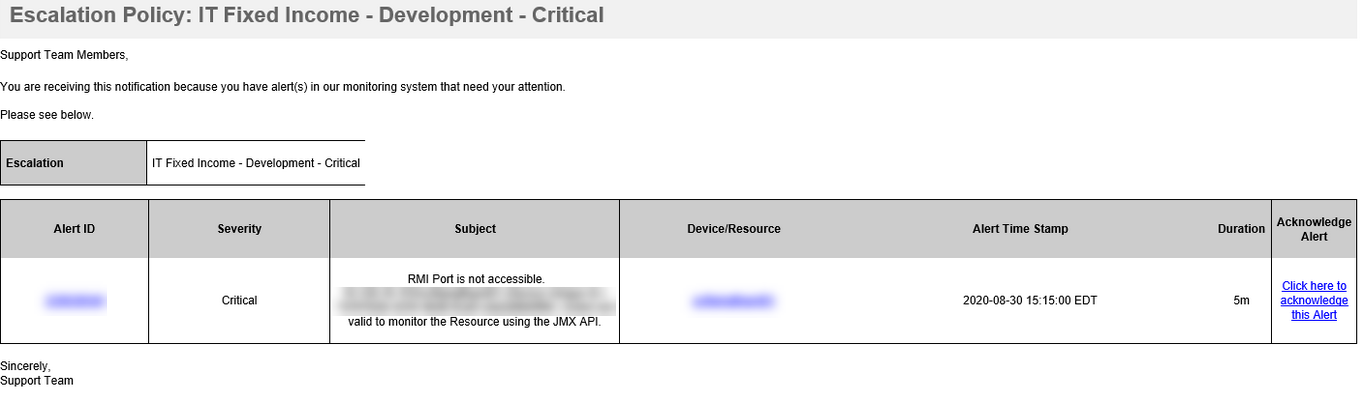
Critical and Warning alerts are showing Client Time Zone
Replaced Client time zone with UTC time zone, in the content of the email, for critical and warning alerts.
Issue is fixed.
Escalation policy - Update incident is not working
When creating a copy of the existing escalation policy, the Update Incident in escalation policy erroneously shows selected, but shows the same as unselected when editing the escalation policy.
When editing the policy, the escalation rule shows that the option is not selected. The following screenshots show the error.
Escalation rule before the edit:
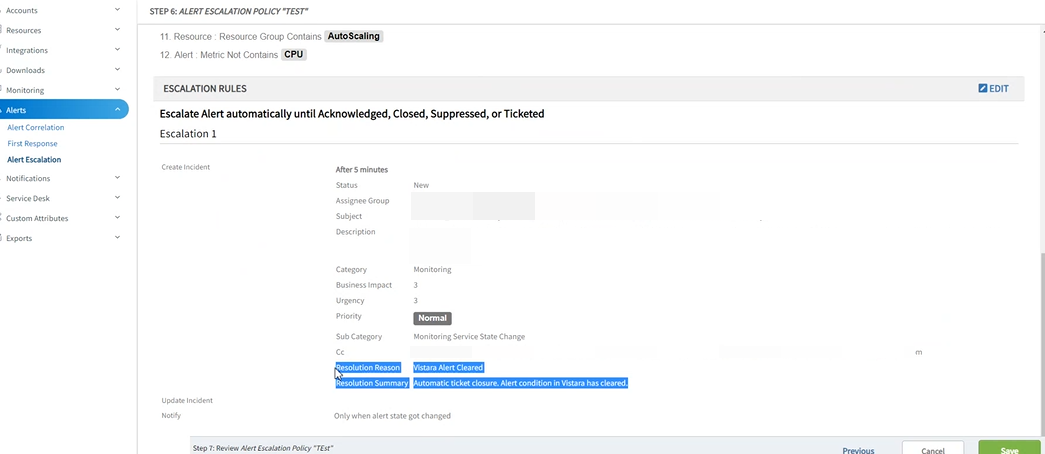
Escalation rule before the edit
Escalation rule during edit:
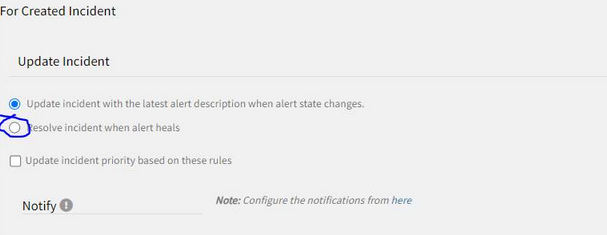
Escalation rule during edit
Issue is with not saving radio button boolean value while copying and saving the existing policy. Due to this, unable to show the resolution summary details while editing the policy. This problem occurs for only one case saved policies, that is, whenever the user is trying to click [create copy + review + save] buttons directly. Here, missed to save boolean details in db, so user is not able to see the resolution details.
Updated resolve incident radio button details for the above missed policies.
Issue is fixed. Able to view the resolution details selected, when editing the policy, for the policies which are created as a copy from the existing policies.
Getting error under Alert Correlation Policies (ML)
Created ML Policies under Alert Correlation, but getting error.
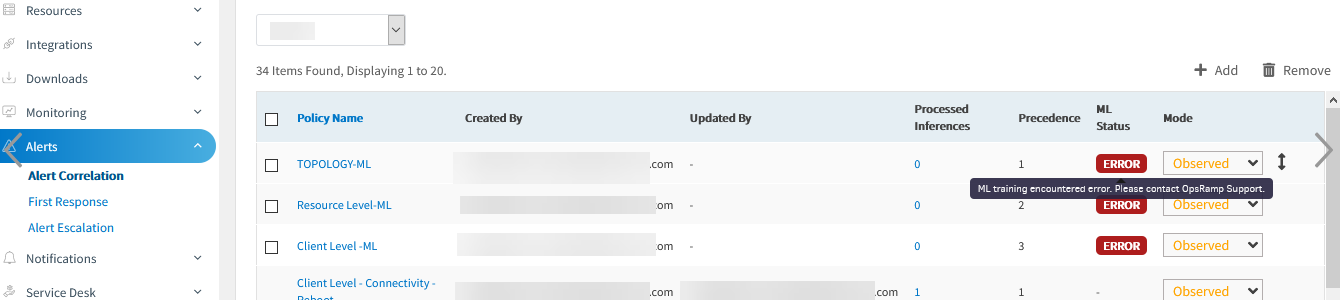
Getting error under Alert Correlation Policies (ML)
While training the alerts data, getting the parse error due to the alerts which are having invalid alert time and training gets failed. If there are any exceptions while forming group events, skipping those alerts from training.
Deployed the fix in machine learning training nodes and trained the data. There is no error now.
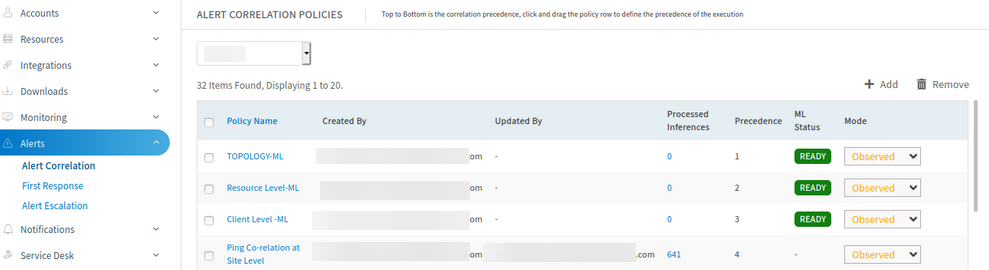
No error
Remediation and automation
Process automation
The tasks of creating and managing process definition workflows are improved by increased capabilities.
User task and task management
Process automation developers and users can now include workflow tasks that require human involvement and interaction, such as approvals or manual action. User tasks are made available as Service Desk tasks and show up in the users My Unresolved ticket list. Once the task is resolved, the process continues with the next task in the workflow sequence.
Workflow monitoring
To improve troubleshooting, process automation developers and users can monitor defined workflows in the following ways:
- To see all versions of the process definition.
- To see all instances of each version.
- To locate failed activities in the process definition diagram.
- To examine process variables, process user tasks, async service tasks, and script tasks.
In addition, users can cancel active process instance(s), change process variable values, and retry failed process instances.
For more information, see:
Copying process definitions
Process automation developers and users can now create copies of existing process definitions.
Process definition copies allow you to quickly:
- Create similar but unique workflows.
- Update workflows that require minor changes.
Find Resources platform service task
A new platform service task gives process automation developers and users the ability to run queries that can find multiple resources. These resources can then be used within their ITOM workflows.
Multi-instance loops
Certain ITOM workflows require processing of multiple resources instead of single ones for service, script, platform, and REST API tasks. You can now perform parallel and sequential multi-instance loops of resources within a process definition to achieve the desired outcome.
Integrations
Unable to remove VMware integration
Tried to uninstall the VMware integration, but it is getting into ‘disabled’ state.
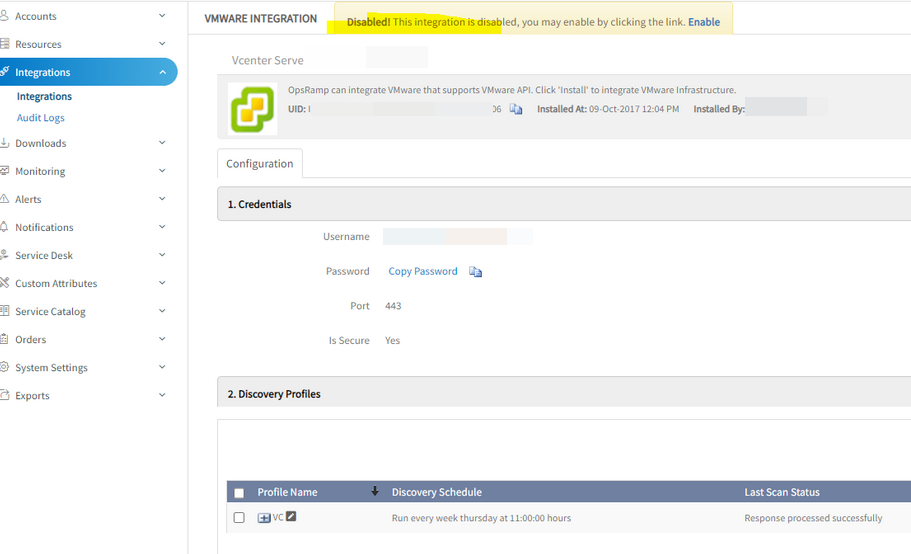
Integration is getting into disabled state
Cause: In the code while removing the dependencies for keepAgentInstalledResources, there is no null check for dependency group. If the group is null against the resource with that null value it is trying to delete the resource, hence throwing the exception.
Including null check while deleting the group relation. Issue is fixed.
VMware integration deleted successfully.
Junk letters while creating tickets in ServiceNow
User installed ServiceNow integration. Service Desk tickets are getting created in Service Now. When the ticket details are consisting of special characters like single quotations, those are showing up as junk letters.
Integrations will carry the information to third-party tool which is saved in OpsRamp’s Service Desk Tickets DB. On checking the DB data for the reported incident, found that subject and impact fields are saved with ' instead of “'” . That is the reason integration has carried the same DB data to third-party tool (that is, to ServiceNow tool).
Alerts are getting created with junk letters in database, without normalizing it to special characters.
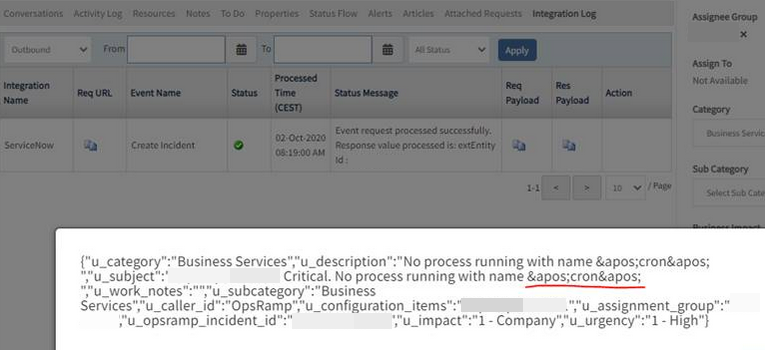
Junk letters while creating tickets in ServiceNow
If any junk letters are existing in alert creation, converting to corresponding special characters.
Issue is fixed. Special characters are displayed perfectly.
Patch management
Configure patch installations to align with Patch Tuesday
Patch installations can now be scheduled to trigger within a time window from Microsoft’s Patch Tuesday. Users no longer have to manually adjust the patch configuration to align with Patch Tuesday.
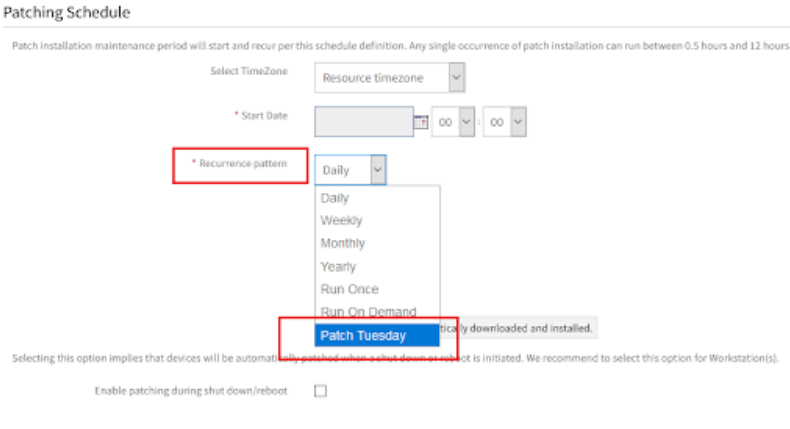
Patching Schedule
For more information, see:
Approve patches from patch compliance configuration
You can now approve patches for installation from the baseline in patch compliance configuration. In addition, you can track patch compliance and approve the same patches for installation in one shot.
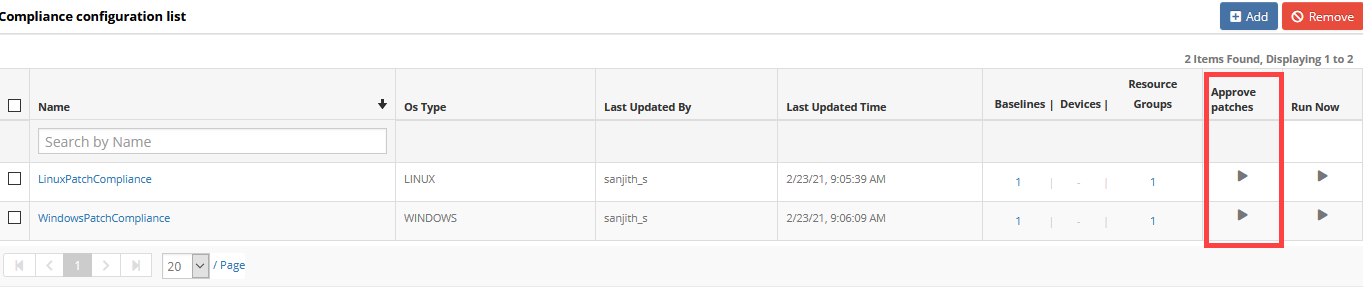
Patching compliance list
For more information, see:
Time zone selection for patching
You can now select a specific time zone to patch all the resources in the patch configuration. Selecting the time zone ignores the different local time zones of resources and instead uses the specified time zone in the patch configuration.
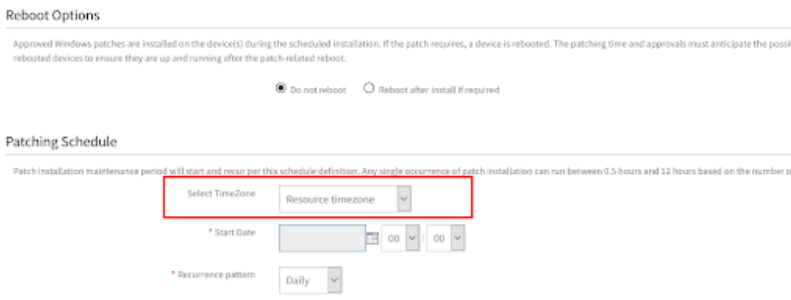
Patching Schedule TimeZone
Browser-based remote consoles
Browser-based remote consoles are available that run directly on web browsers and alongside Java consoles.
Browser-based consoles support the following capabilities:
- Console protocols: RDP, SSH, Telnet
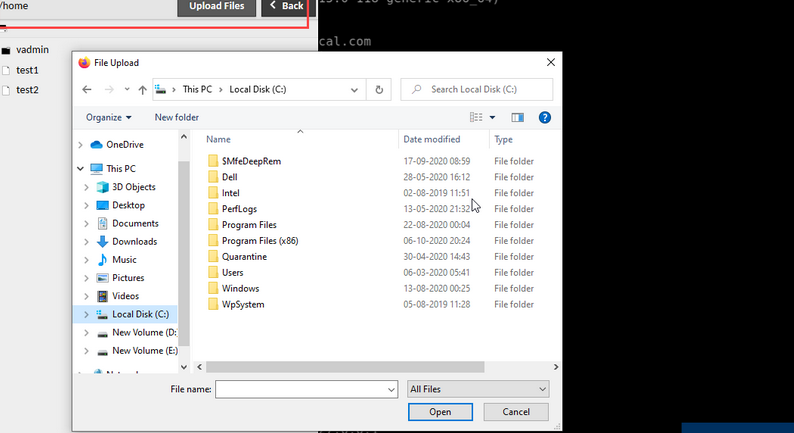
- File transfer via SSH consoles
- Audit record and play
For more information, see:
Java-based remote consoles are now deprecated and will not be available in future releases. See Deprecation Notices for more information.
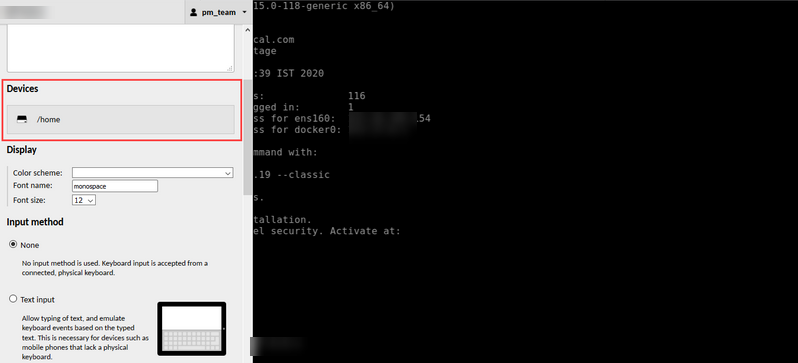
SSH Console Details
SSH Console Details
Ability to escalate alerts
Administrators now have the ability to escalate alerts after the maintenance window for patching has concluded. This enhancement makes it easier to detect alerts that may have been created during the maintenance window. For more information, see Adding and scheduling patches.
SNMP
Alerts from the devices with incomplete information
Got the alert with NA and IP address in the Alert subject.
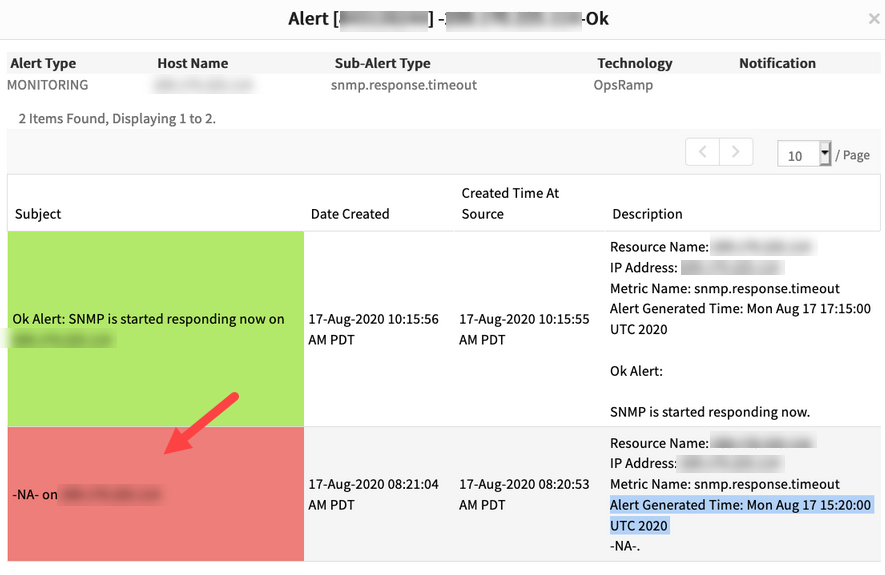
Alerts from the devices with incomplete information
Alert subject and alert body macros are missing for extended SNMP templates in vProbe code, so getting NA in alert subject.
Added them in the vProbe code base and replaced the jar in the Gateway attached to the device.
Issue is fixed. Alerts are triggering with complete information.
Service Management
Unable to edit personal view
User is not able to update private views in Service Desk. Error message is displayed.
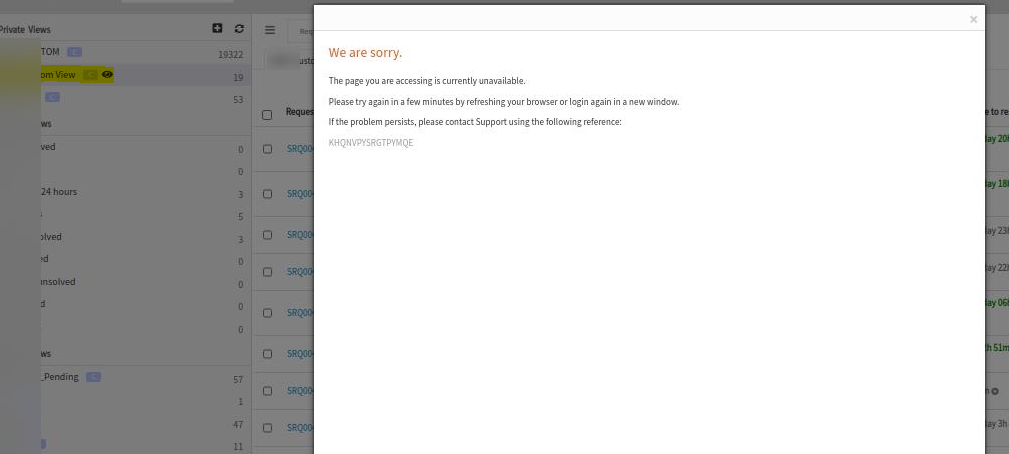
Unable to edit personal view, error message is displayed
Null check is placed incorrectly. Issue is fixed.
The user is able to update the Private views in the Service Desk module.
Reports
Reports asynchronous generation and scalability improvements
For NFS storage, a metadata cache is maintained for each report for a given time period. For example: previous month, previous week, previous day, and a specific period.
This change reduces report re-generation in case of failure or on-demand time by up to 90%.
Network Statistics reports can now be processed using MBPS
Network Statistics reports can now be processed using MBPS in addition to KBPS. This enhancement is useful for administrators who want a more granular view into their network usage and are more accustomed to MBPS.
Unable to generate reports after 5-5-0 upgrade
When defining the parameters for the inventory report the page becomes slow and then stops responding and/or crashes. When creating a new inventory report and choosing a specific client, it populates one custom attribute for each instance. Hundreds of custom attributes are displayed in the list and most of them are duplicates. This is causing poor performance. The list takes around 3-5 minutes to populate with multiple notices from the browser that a script is running too long. Then the site eventually stops responding altogether. There are nearly 37,250 custom attributes.
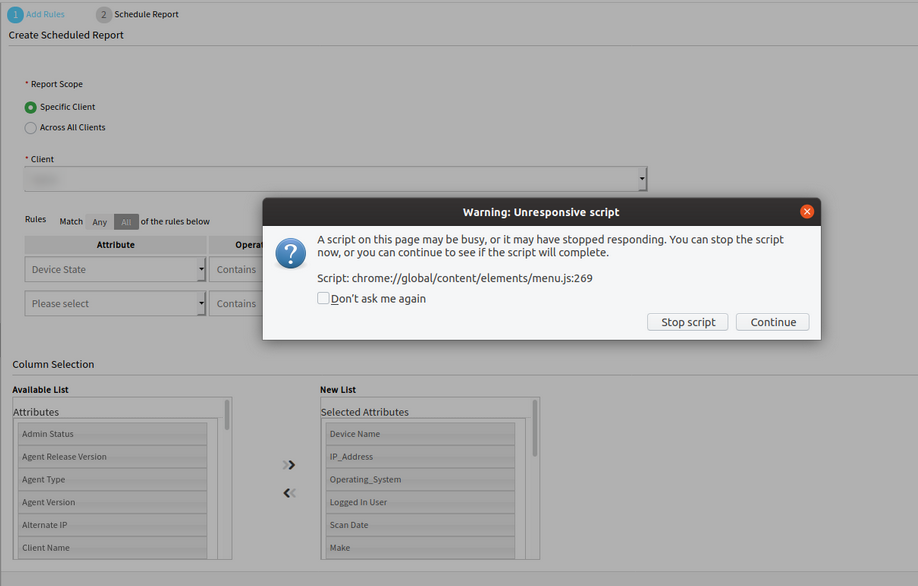
Stop script error
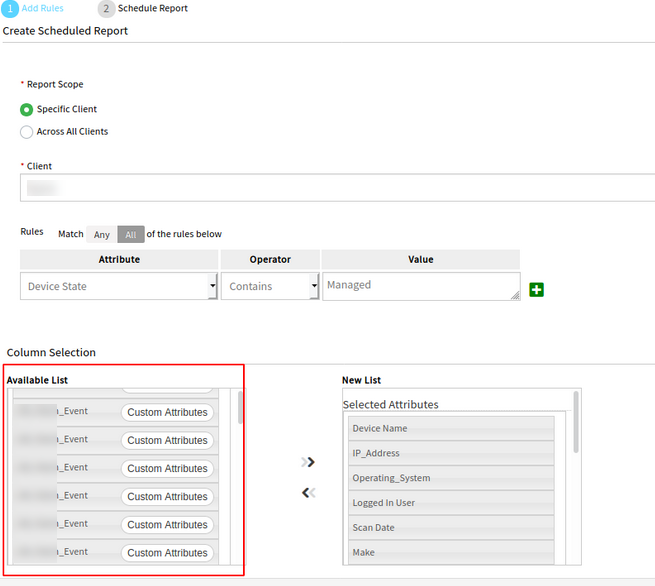
Duplicate custom attributes
Issue is fixed. Able to generate inventory report successfully, without any error.
Multiple failing reports
Observed multiple failing reports in the UI. Some of these reports are needed to perform scheduled patching for clients. These reports were previously working. User tried to create new ones changing filters and adjusting settings to get them to work, but had no success.
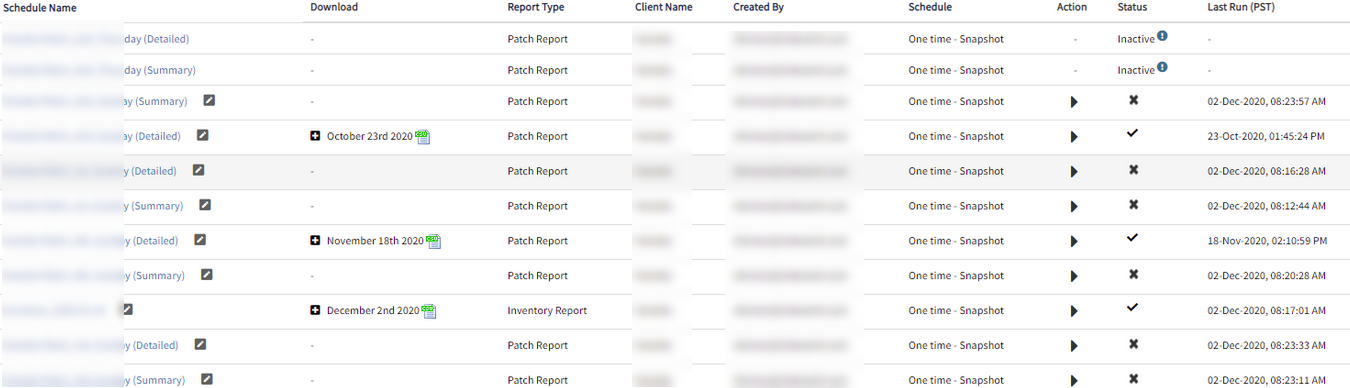
Multiple failing reports
Used the wrong method to check the bundle3 subscribed tenants.
Modified the wrong method to proper method to validate the bundle3 subscribed tenants.
Issue is fixed.
Batch Exports are not happening on hourly basis
Batch exports are not happening on an hourly basis, to Azure Blob.
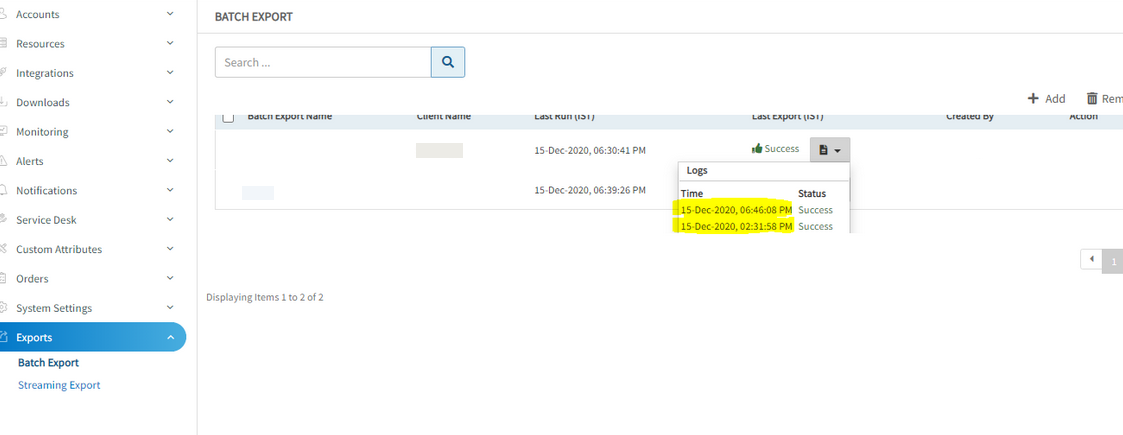
Batch Exports are not happening on hourly basis
In batch exports, can see some inconsistency in hourly timings for the last run and last export in UI.
For last Export - In some cases it is not saving the last export time, that is the reason for inconsistency in timings in UI.
For last Run - Configuration issue, having wrong IP address to point to internal API in 2nd report Node. Due to this getting gateway failure exception.
Issue is fixed. For last Export - Did the required changes to save last export time.
For last Run - placed proper IP address and allocated dedicated node (7th report node) for batch exports.
Hourly exporting of data is working perfectly.
Resource Management
Neighbors tab is not showing valid VLANs or MAC Addresses
The VLANs all show as “1”, and there are no MAC addresses.
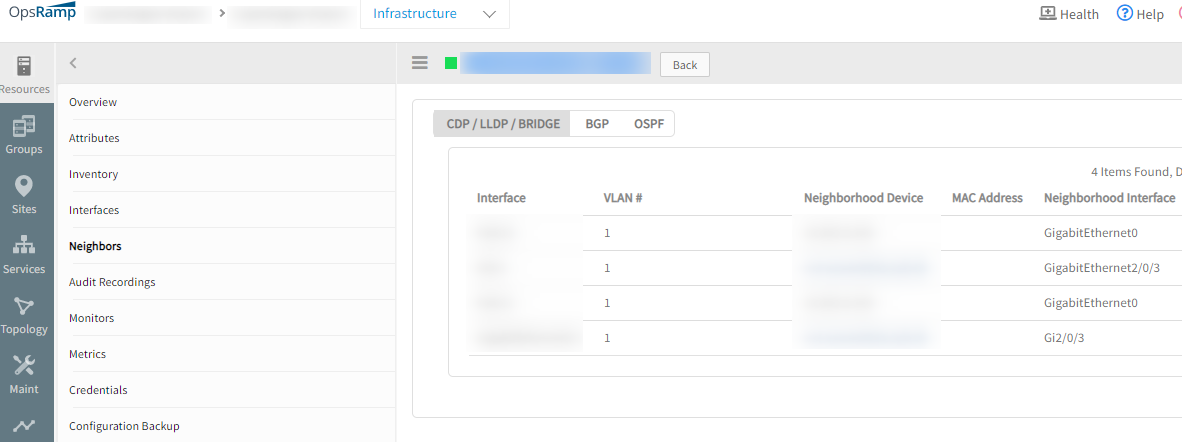
Neighbors tab is not showing valid VLANs or MAC Addresses
Issue is fixed. Valid VLANs/MAC addresses are displayed in the Neighbors tab.
IP address gets reverted to old IP address
After onboarding a VM using SNMP discovery (the VM is in VMWare/V-Center), re-scanned the device using V-Center discovery and also SNMP discovery, and then updated/edited the IP address on the device. Scanned it using the VMware/V-Center discovery again, the IP address gets reverted to the old IP.
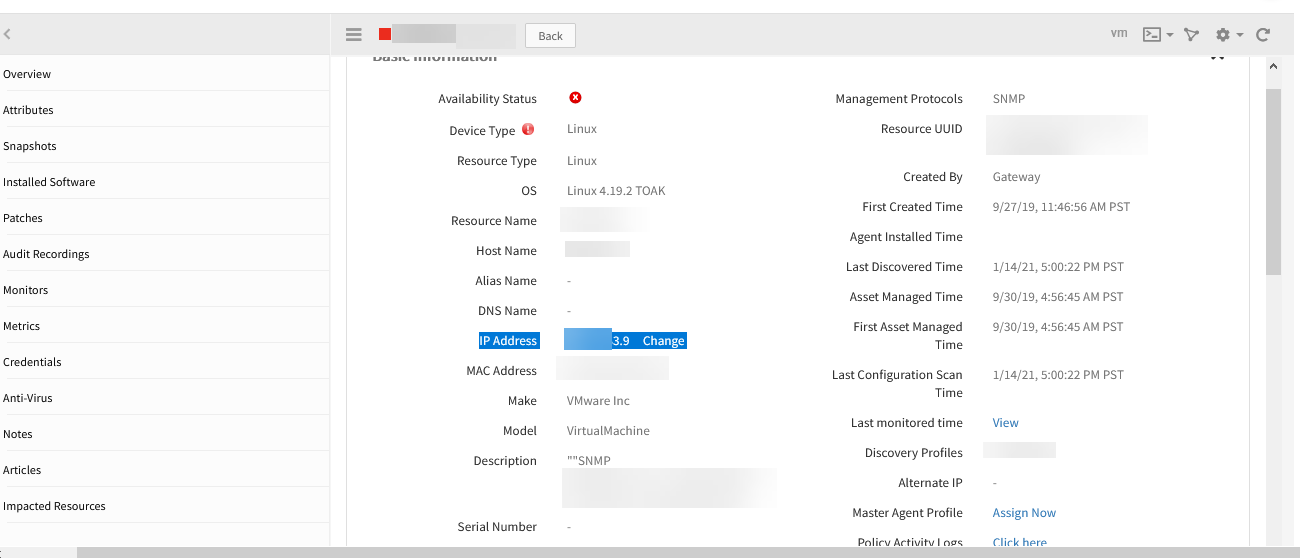
IP address of the device is reverted
RCA: If the user edits the IP of the device from UI, after the VMWare discovery IP is getting overwritten.
Issue is fixed. The updated IP address is displayed after re-scanning the device.
Cloud Monitoring
Issue with K8s container application monitor
When the number of containers increases (more than 15), it is not showing in snapshot.
There is no limit for container monitoring. It is only taking more time ( more than expected ) and due to this snapshot functionality is affected, but not monitoring. Monitoring may not be happening for every 1 minute but may take more than a minute in case there are 15+ containers.
Issue is fixed.
Discovery and monitoring
Device discovery is not populating SNMP definition details
The Inventory section on the infrastructure page of the UI does not update the hardware/software/firmware information of the SYS OID despite multiple scans and discoveries.
The details are getting saved in device_data table at cloud end, but they are not showing up in UI.
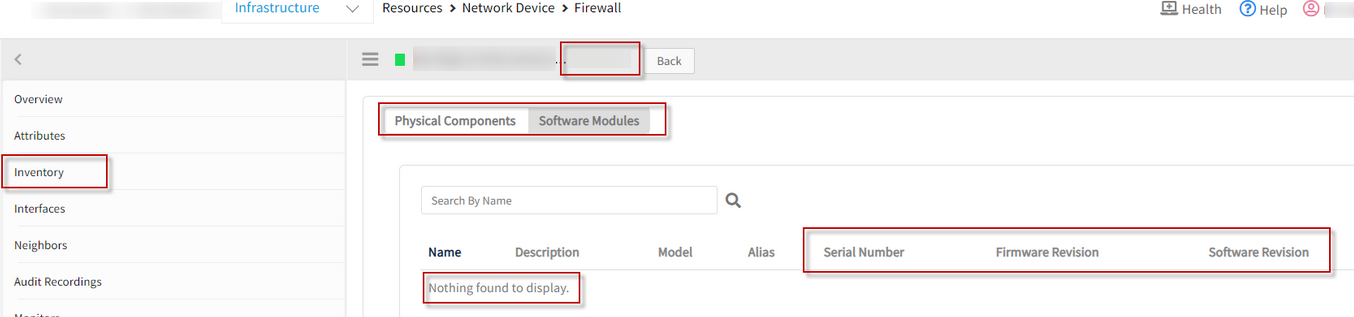
Device discovery is not populating SNMP definition details
Issue is fixed. The details are displayed in the inventory section.
Integration is not able to detect the cluster
When checked, the integration shows Response processed successfully, however, no cluster is detected.
Customer tried to re-scan multiple times, but still the same issue.
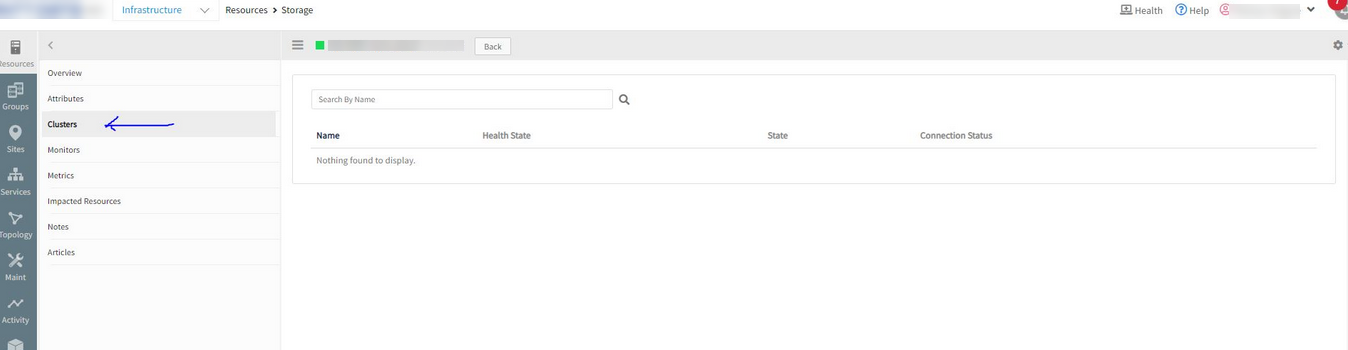
No cluster is detected
When calculating overall efficiency parameter in the inventory, it resulted in the value which cannot be processed (this is specific to the JSON API & Programming Language based on the response for the API request). Changed code to validate that, and if getting the invalid value sending a valid value to make sure it is processed successfully.
Changed code to make sure to get parse-able value.
Issue is fixed. Cluster is detected successfully.
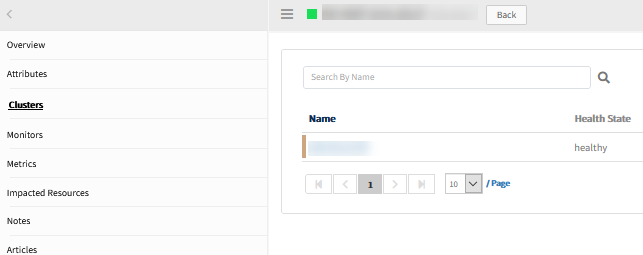
Cluster is detected
Advanced resource search
Advanced search for resources has been enhanced to allow the creation of resource groups.
Creating resource groups (using the advanced search query) unlocks the power of OpsRamp’s attribute model. When resource groups are saved, administrators can leverage resource groups in other areas of the platform such as device management policies, dashboards, and escalation policies.
For more information, see:
Container orchestration and runtimes
Building off our support for Kubernetes and Docker workloads, support for container orchestrators and runtime is extended to:
- Container Orchestrators:
- Red Hat OpenShift Kubernetes Distribution (okd)
- K3s
- Container Runtimes:
- Containerd
This extended support ensures that teams deploying their containerized workloads (using various orchestrators and runtimes) have continuous visibility into the health and performance of their resources.
For more information, see:
Container-based application detection
With the focus on providing visibility into containerized workloads, OpsRamp is extending the capability of its native container monitoring to support the discovering and monitoring of containerized applications.
Providing visibility into the applications running in containers gives administrators the next level of insight into the services supporting their business applications. Over 25 applications are auto-detectable including Cassandra, MongoDB, MySQL, and Kafka
Alerts streaming to external webhooks
Administrators can now consume alerts from their tenants using webhook listeners. This is intended for teams that have third-party alert correlation tools and do not want to leverage the native alert correlation functionality or perform independent analysis of the alert data. You have the option to stream raw or de-duplicated alerts.
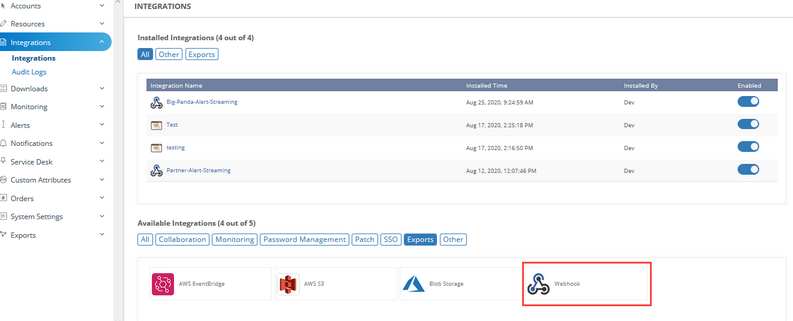
Webhooks in Exports tab in Integrations
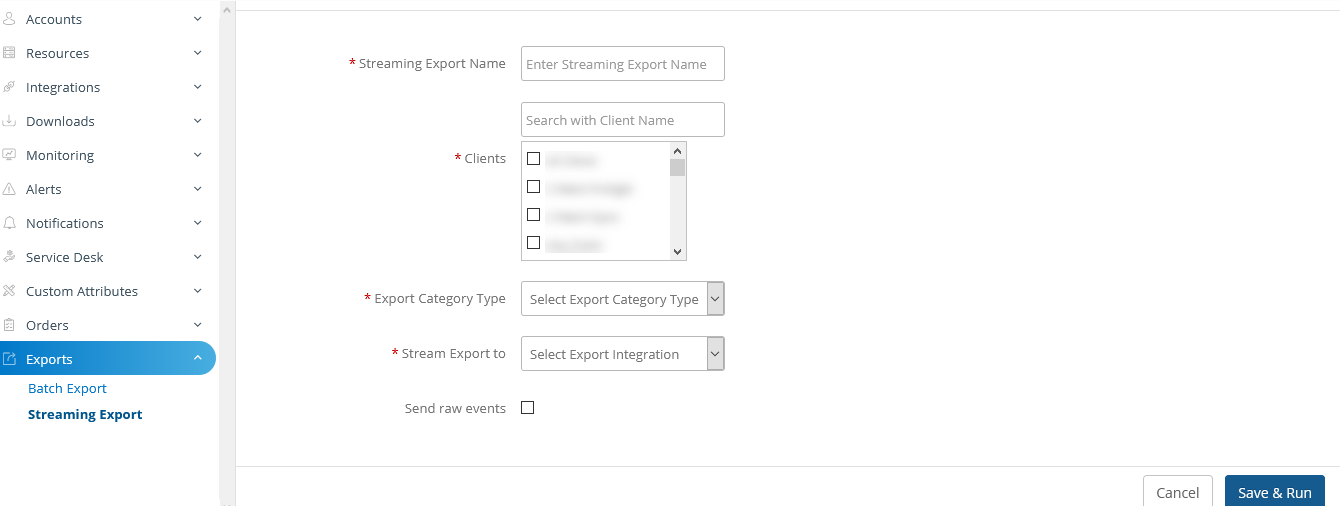
Alert Streaming Trigger Configuration of the Webhook
Public cloud improvements
AWS, Azure, and Google integrations are updated with new onboarding and monitoring information.
For more information, see:
Public cloud services
AWS, Azure, and Google integrations are updated with supported services along with their respective metrics.
For more information, see:
Public cloud resource support
Cloud monitoring services are being extended to support several key services within AWS and Azure.
For AWS:
- AWS ECS
For Azure:
- Azure Functions
- Azure Hyperscale (PostgreSQL)
- Azure SQL Managed Instance
Python-based synthetics
Enhanced Python-based synthetics are available for synthetic transactions which include IF-THEN-ELSE statements.
For more information, see:
Compute Monitoring
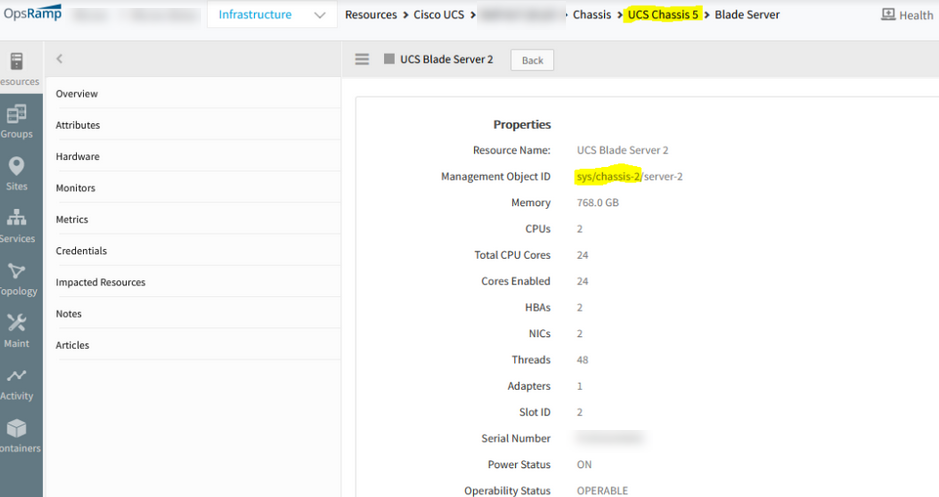
Cisco UCS shows same blade server resource under different chassis
Listing same blade server under different chassis instead of showing the blade server belonging to the correct chassis.
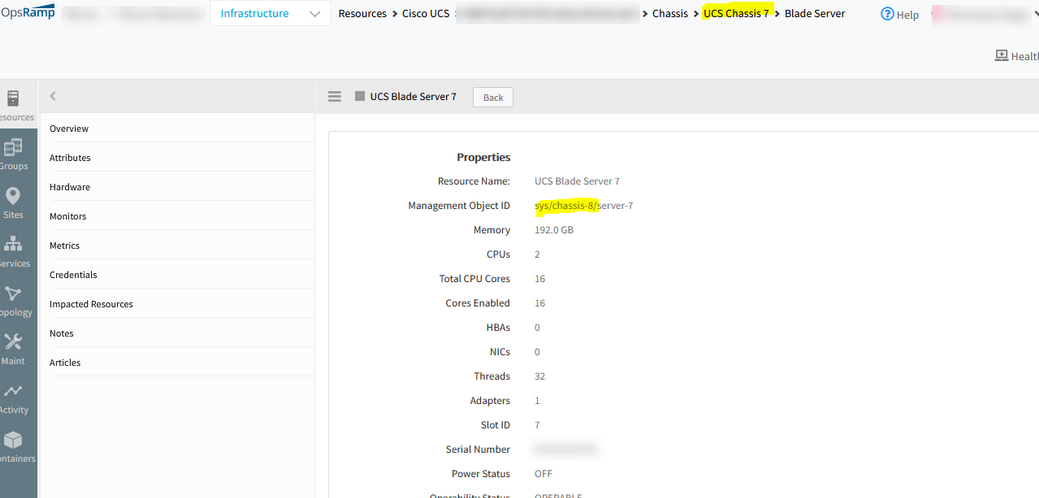
Same blade server resource under different chassis
Same blade server resource under different chassis
Issue is fixed. It is showing blade server under the correct chassis.
Kubernetes Integration does not work properly
The integration was not completed normally.
In the customer POD, the connection node tls_host is with public IPs and not the DNS names.
Changed the tls_host to DNS names. With this fix, Agent is able to establish tls connection successfully.
Agent got online and Integration works perfectly.
No alert received for network disconnectivity for all ESXi hosts under vCenter
The network connectivity was lost on DV ports. When checked in OpsRamp, there were no alerts anywhere about this event, either at the host level or the vCenter level. The connectivity restored about 30 minutes later. The template is configured properly to allow for these alerts to trigger, but they did not trigger alerts. It affected 16 ESXi hosts that all went down, but continued to show as UP in OpsRamp despite proper configurations.
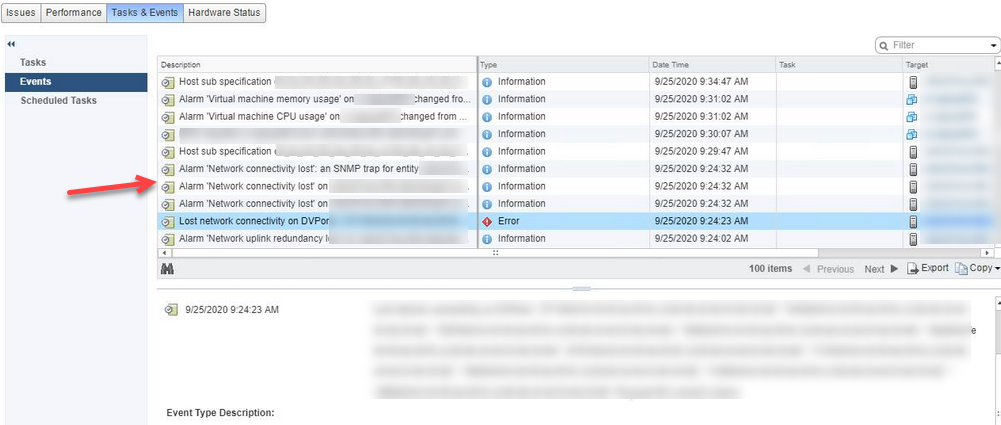
Network connectivity was lost on DV ports
Cause: Comparing event key formed from the API response with the event name in UI does not match in one specific case. This results in not processing the event.
Made changes to make sure there is a right event key formed to compare with the event name so that it is processed.
Issue is fixed.
Exports
Data export - Blob storage URI validation error
User created blob storage on their Azure account and tried to do the Blog export integration in the portal. Got the URI is invalid message while adding the required fields and trying to save.
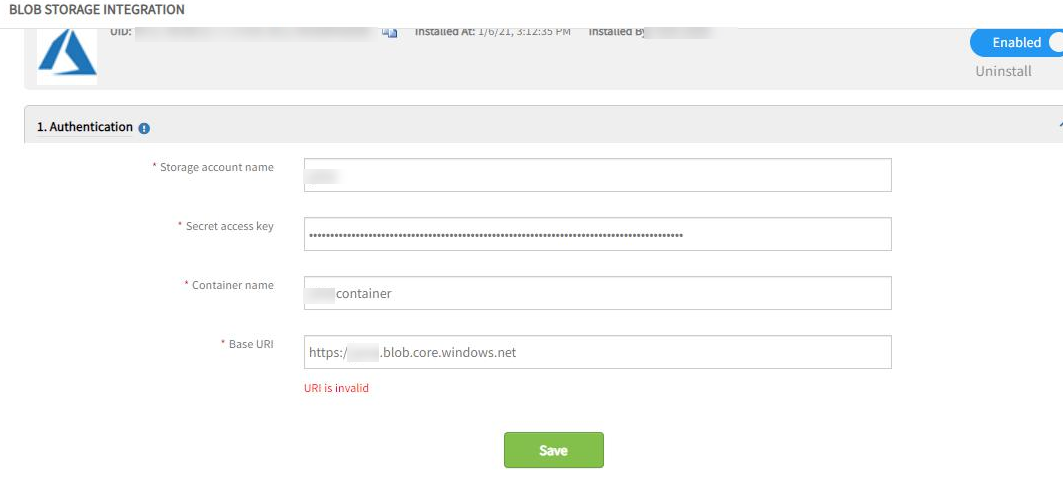
URI is invalid message while adding the required fields
Supported only https://portal.azure.com URL for Azure blob storage integration.
Now, supporting custom URLs for Azure blob storage integration, and only considering URL starting with “https://”.
Issue is fixed.
Validated by giving the correct credentials and URI as https://, and the details are getting saved.
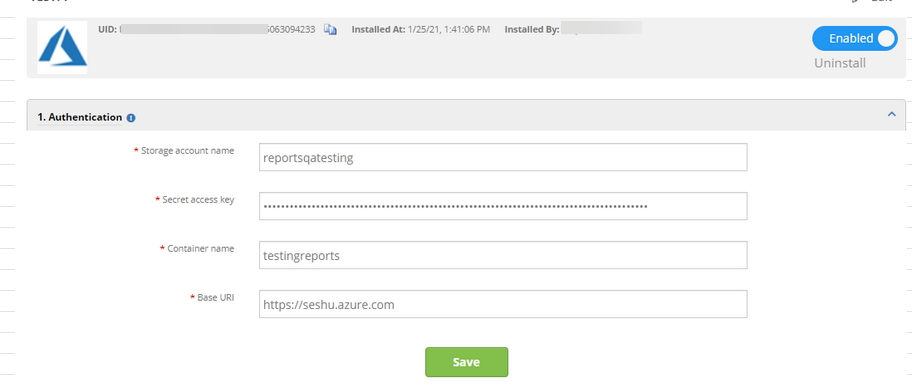
Details are getting saved perfectly
App Templates
Date Gaps in DB Servers Metrics
Noticed gaps in metrics across several of the DB servers.
The graphs below show multiple date gaps for MSSQL2016 Data Files Size KB, MSSQL2016 Log Files Size KB, and MSSQL2016 Transactions Per Sec metrics.
Checked the latest snapshot on the monitor and did not find these metrics.
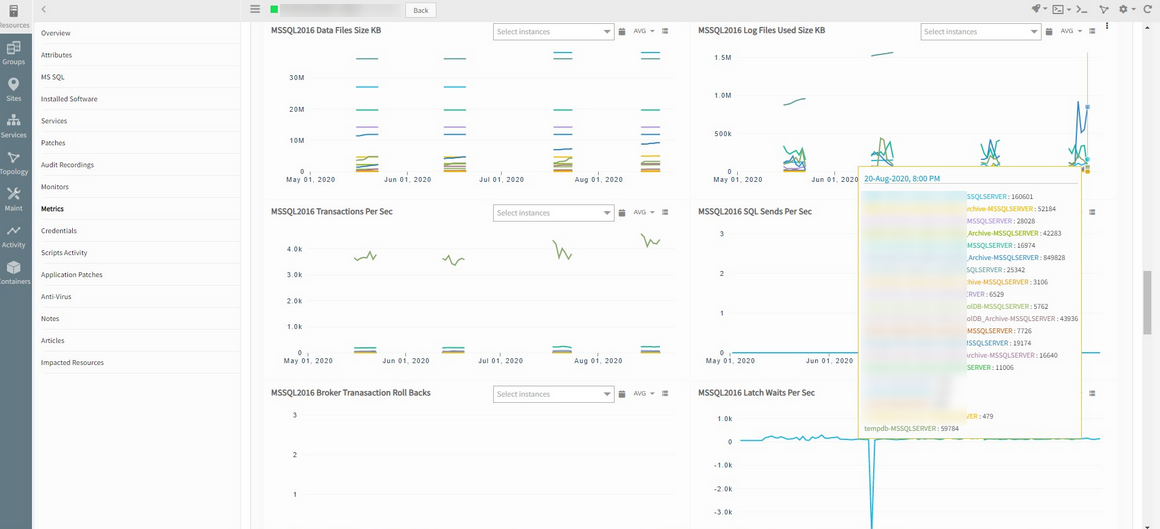
Gaps in metrics across several DB servers
As per Agent log data validation, getting some arithmetic operation issue due to variable type declaration for the 3 monitors, that is why not getting data for these.
Fixed the Arithmetic Operation issue for the above metrics and updated the latest script.
Issue is resolved.
System logical disk performance monitor is not fetching metric data
User applied System logical disk performance monitor to Windows device, but unable to get metric data. So the user created template: NOT-MSExchange 2016 System logical Disk Performance. Still unable to fetch data.
RCA: File extension (.ps1) is missing in script under Setup page.
After pushing the executable file, getting the monitoring data for the applied custom monitor.
Issue is fixed.
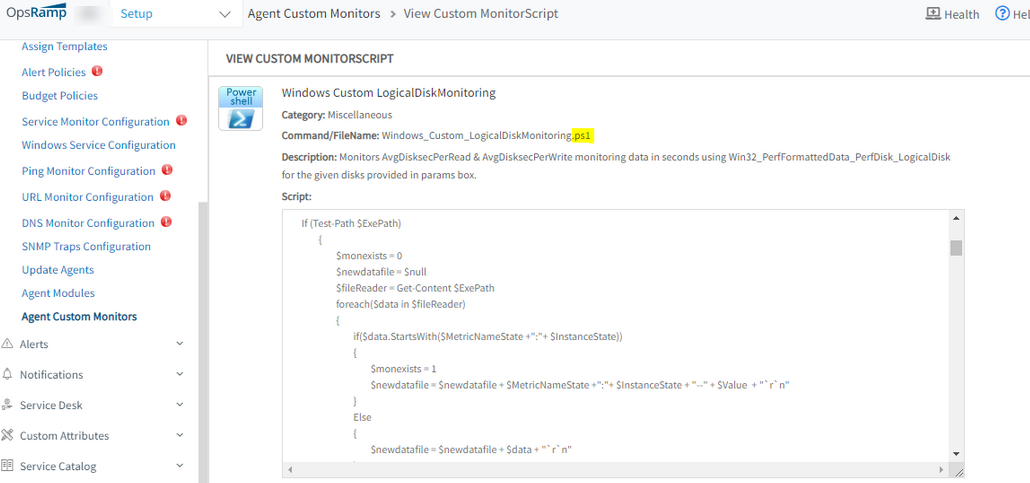
Added the file extension
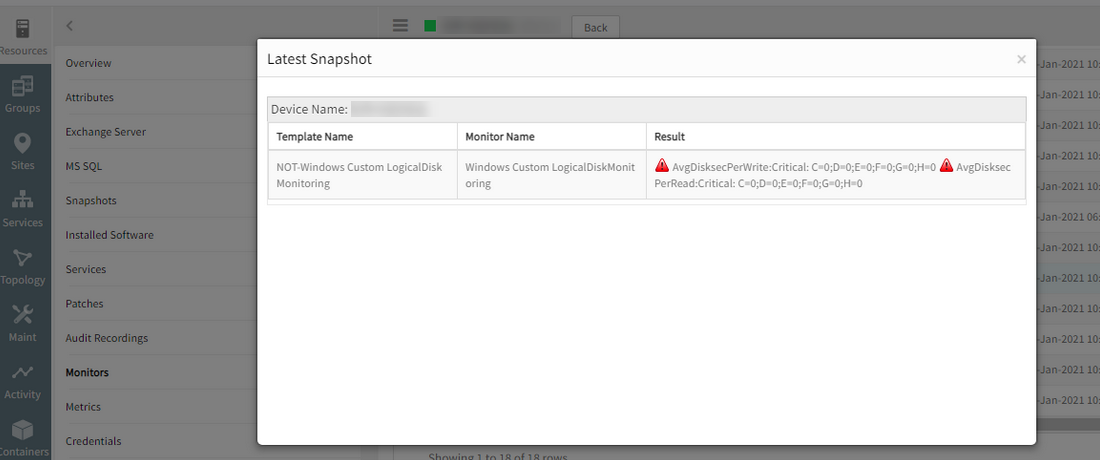
Getting the monitoring data
Monitoring Management
Words containing double quotes showing blank in UI
Strings containing double quotes in the Expression field of Windows Log file monitor are displaying blank.
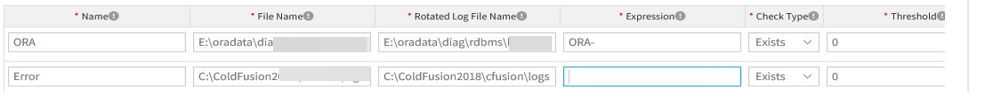
Strings containing double quotes showing blank
The words are saved correctly in monitor settings, on the Infrastructure page.
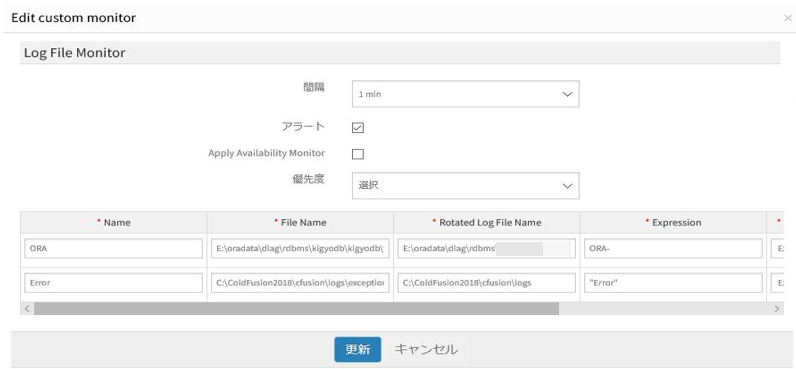
Strings are saved correctly in monitor settings
RCA: While trying to save a string in quotes, it interrupts XML markup.
Issue is fixed. Escape characters that can be interpreted as XML markup.
The input string with double quotes is saving perfectly.
Input string with double quotes is saving perfectly
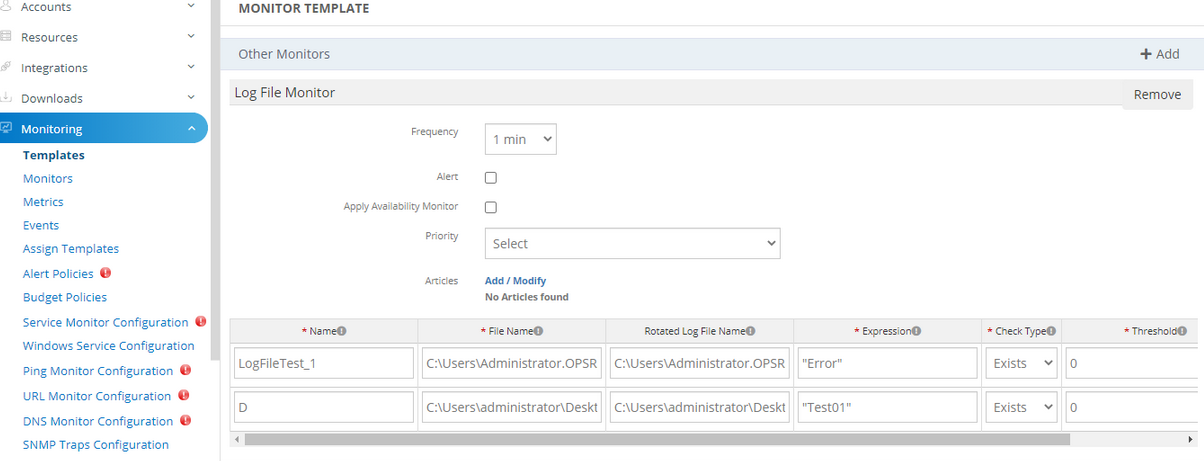
Issue while adding new agent custom monitor in templates
User has defined agent custom monitors. Created template from setup tab with below filters, and added Agent custom monitors. Unable to see the added custom monitors while creating template.
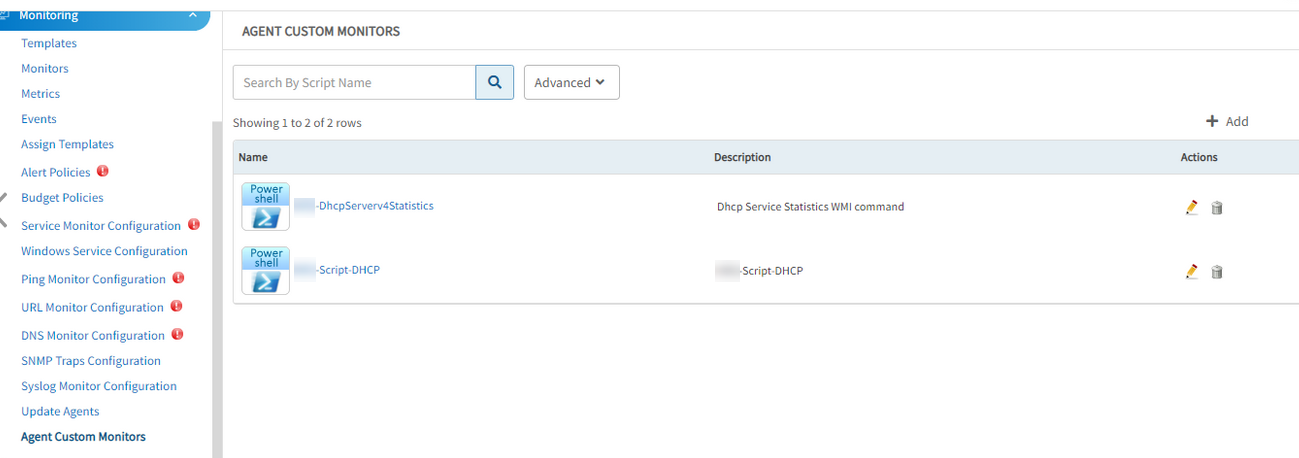
User has defined agent custom monitors
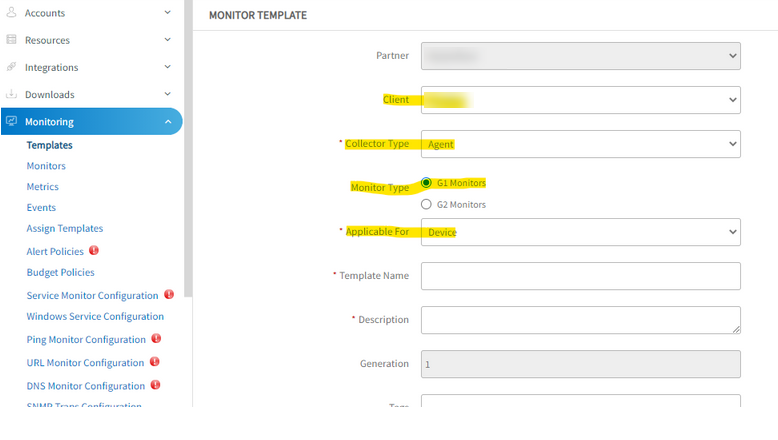
Created template from setup tab with below filters
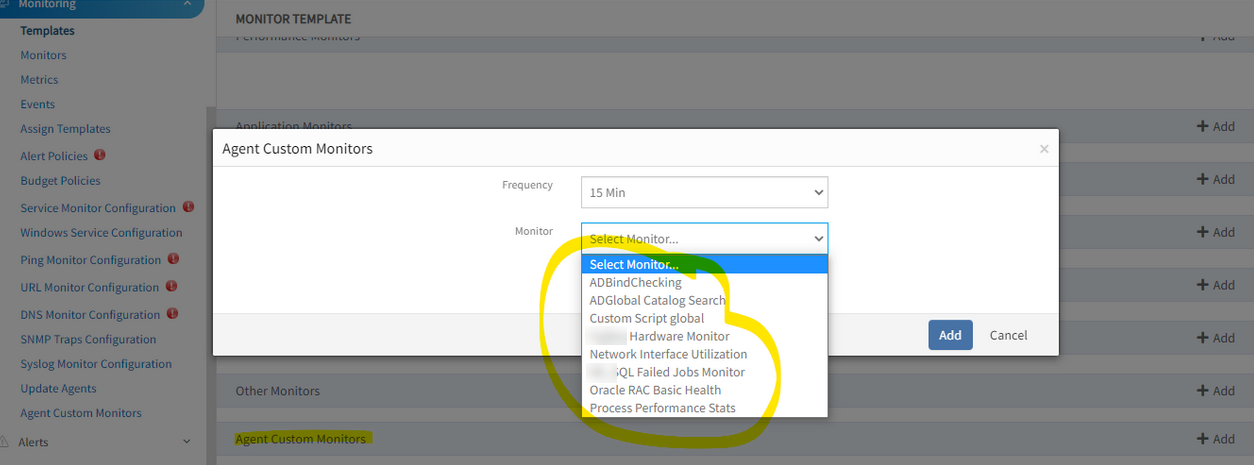
Unable to see the added custom monitors
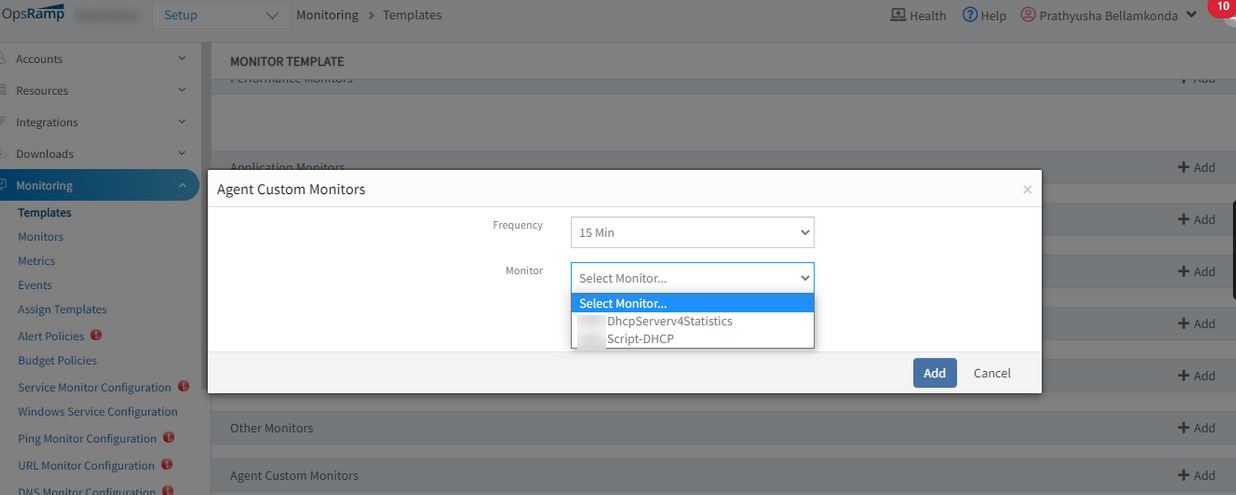
Able to see the custom monitors from SP login.
Input string with double quotes is saving perfectly
RCA: While fetching the monitor list, not adding the corresponding partner ID to the service API, due to which the API is not adding the client monitors to the list.
Fixed the code, and now sending the partner ID for the corresponding client and getting the client’s agent-customer monitors in the list.
Able to see the custom monitor while creating the template.
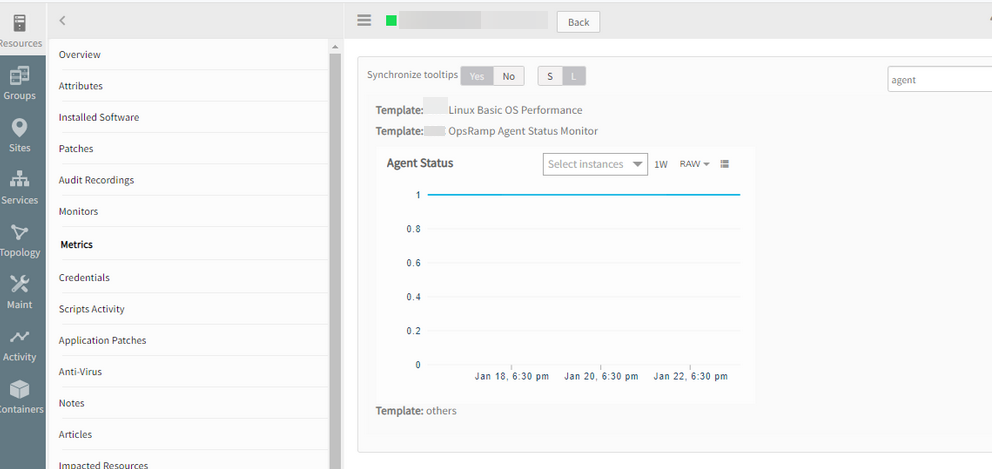
Agent status Heal alert is missed
Incident is created from an alert. As per the alert comments the device is in maintenance window, so incident is created after maintenance window got closed. As per the conversation in the incident, alert is not healed so Incident also is not resolved.
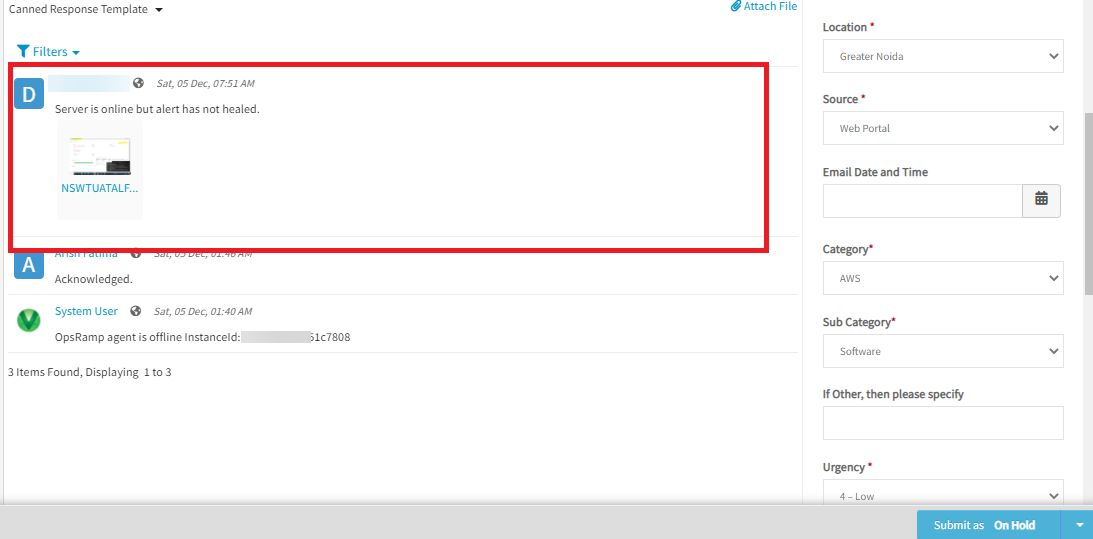
Server is online, but alert is not healed
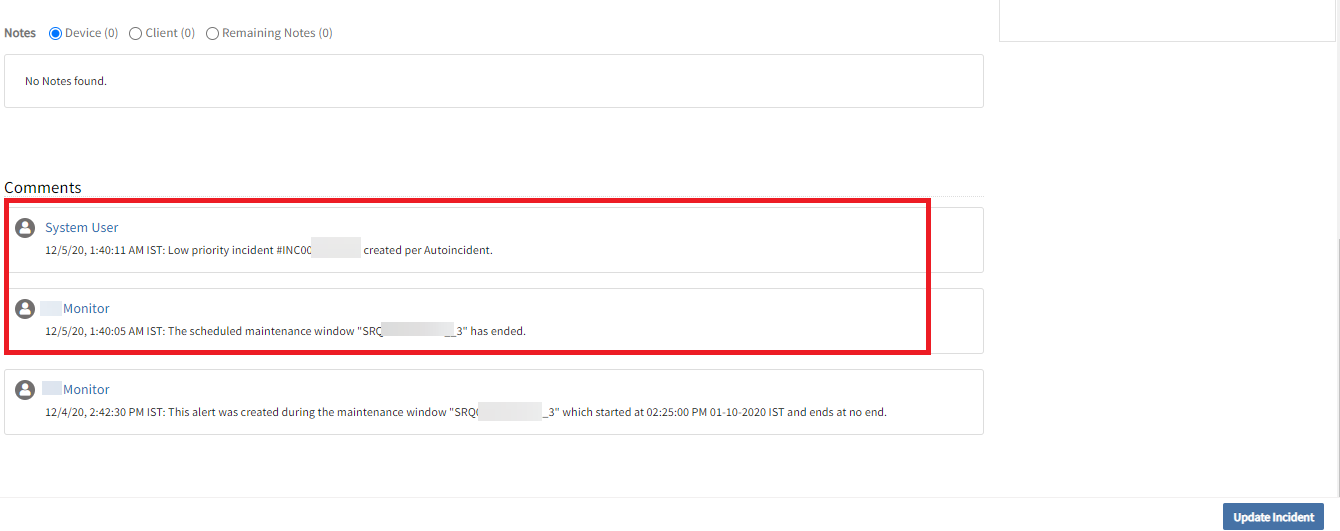
Device is in maintenance window. Incident is created after maintenance window got closed.
While reviewing the spark logs and code base, observed a case in heartbeatutil class where exactly the alerts are not being processed. To confirm this, added logs which will be used for further analysis.
Even changed exception handling messages to display device, clientID’s. Issue is fixed.
The alert is healed and the incident is resolved.
Custom Monitors
Getting “InvalidMacroException” from Remote Script Executor on Gateway
All devices that have the template assigned are showing the following alert in the portal:
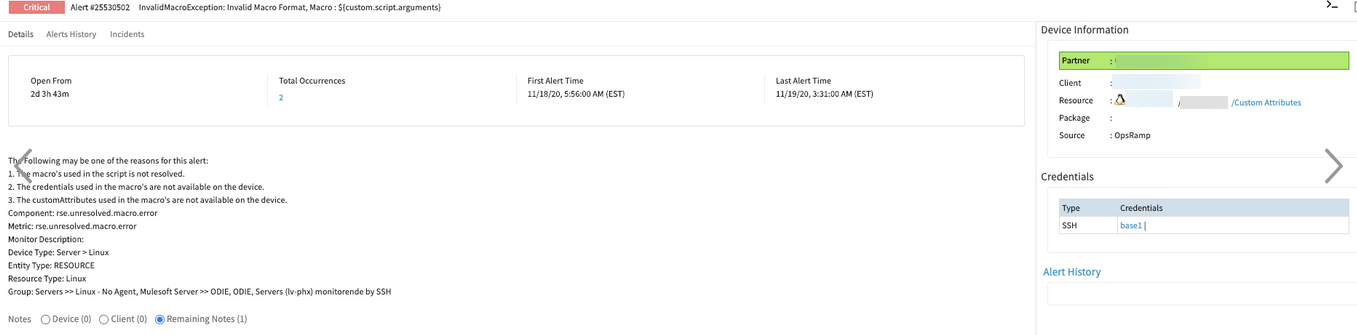
Getting Invalid Macro Exception on Gateway
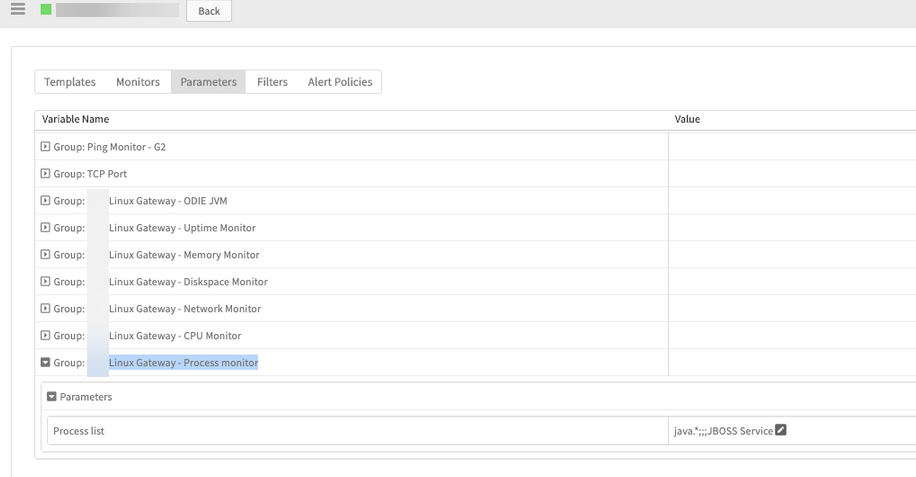
Template applied on the devices
The Gateway was updated to 8.0.0, as a fix was deployed on this Gateway for an issue that gave this error/alert, but the issue persists. The template does not provide any values.
Deployed the fix and verified Linux Gateway - Process monitor template applied devices. Monitoring has started working.
API
Agent APIs
New agent APIs are available for retrieving and updating installed agent resources.
GET https://{api-url}/api/v2/tenants/{tenantId}/agents/{agentversion}/resourcesCountByAgentVersion
GET https://{api-url}/api/v2/tenants/{tenantId}/agents/{osName}/resourcesCountByOSName
GET https://{api-url}/api/v2/tenants/{tenantId}/agents/agentInstalled/resources/resourcesCountGroupByAgentVersion
GET https://{api-url}/api/v2/tenants/{tenantId}/agents/agentInstalled/resources/resourcesCountGroupByOSName
GET https://{api-url}/api/v2/tenants/{tenantId}/agents/{agentVersion}/resourceUUIDSByAgentVersion
GET https://{api-url}/api/v2/tenants/{tenantId}/agents/{OSName}/resourceUUIDSByOSName
GET https://{api-url}/api/v2/tenants/{tenantId}/agents/supportedAgentVersions
POST https://{api-url}/api/v2/tenants/{tenantId}/agents/resources/{ResourceUUID}/updateByResourceUUID
POST https://{api-url}/api/v2/tenants/{tenantId}/agents/resources/{agentversion}/updateResourcesByAgentVersion
POST https://{api-url}/api/v2/tenants/{tenantId}/agents/resources/updateResourcesByClientId
POST https://{api-url}/api/v2/tenants/{tenantId}/agents/resources/{osname}/updateResourcesByOSName
Custom branding APIs
New custom branding APIs are available for creating and updating custom client branding information. Custom branding information includes details such as header, header text, logo, favicon, login image, website title, and custom sub-domains.
https://{api-url}/api/v2/tenants/{tenantId}/customBranding
Credential sets APIs
New credential set APIs are available for creating and updating credential set information.
https://{api-url}/api/v2/tenants/{tenantId}/customBranding
https://{api-url}/api/v2/tenants/{tenantId}/credentialSets/{credentialSetId}
Alert API improvements
The alert correlation and first response APIs are enhanced to support more filter criteria.
https://{api-url}/api/v2/tenants/{tenantId}/policies/alertCorrelation
https://{api-url}/api/v2/tenants/{tenantId}/policies/alertCorrelation/{policyId}
https://{api-url}/api/v2/tenants/{tenantId}/policies/firstResponse
https://{api-url}/api/v2/tenants/{tenantId}/policies/firstResponse/{policyId}
https://{api-url}/api/v2/tenants/{tenantId}/escalations
https://{api-url}/api/v2/tenants/{tenantId}/escalations/{id}
Resource API improvements
The GET and UPDATE Resource API is enhanced to be consistent across all public clouds.
The API now provides:
- Provider details for all public cloud resources (AWS, Azure, and Google Cloud)
- User ability to update resource descriptions
https://{api-url}/api/v2/tenants/{tenantId}/resources
https://{api-url}/api/v2/tenants/{tenantId}/resources/{resourceId}
Resource API CollectorType renamed
The collectorType for templates assigned on Synthetic resources monitoring has been renamed to Synthetics from Webservice.
https://{api-url}/api/v2/tenants/client_193/resources/{resource_uuid}/templates?collectorType=Synthetics
Integration API improvements for public cloud
The install integrations API is enhanced to provide discovery information of public clouds. The API provides users the ability to install K3S integrations.
https://{api-url}/api/v2/tenants/{tenantId}/integrations/install/{integrationId}
Assign custom attribute API is overwriting last assigned custom attribute
When using assign custom attribute to a device API in a sequence, the response says it is successful, but only the last assigned attribute is visible on the device page. Every time the API is used to assign a new custom attribute it is overwriting the old one, and only 1 custom attribute on the resource is left in the end.
Concept of custom attributes: There are custom attributes and for each custom attribute there can be any number of values. The user cannot assign different values of same custom attribute to a single device.
For example, there is custom attribute called “Tag” and its values as “value1”, “value2”.
The user can assign either “Tag : value1” pair or “Tag : value2” pair to a single resource but not both.
Missed the EntityType ‘Resource’ check while checking whether the custom attribute is already assigned to a resource or not. Added the missing check with Entity Type ‘Resource’.
Issue is fixed.