Release Date: September 2021
Introduction
We are excited to announce our 9.0.0 update!
This release focuses heavily on our Discovery and Monitoring solution. Our goal is to provide a streamlined monitoring experience for teams that want visibility into Public Cloud and Kubernetes-based applications and workloads.
Dashboards and User Interface
Advance search is not working and getting 500 error
Getting 500 error only when clicking on a DOWN resource, but when clicked on UP, UNKNOWN, UNDEFINED, able to get the list.
When the query - $cloudInfo.instanceState = "running" AND $agent.installed IS "true" is run, and when clicked on the number of down devices, “No matching records found” message is displayed.
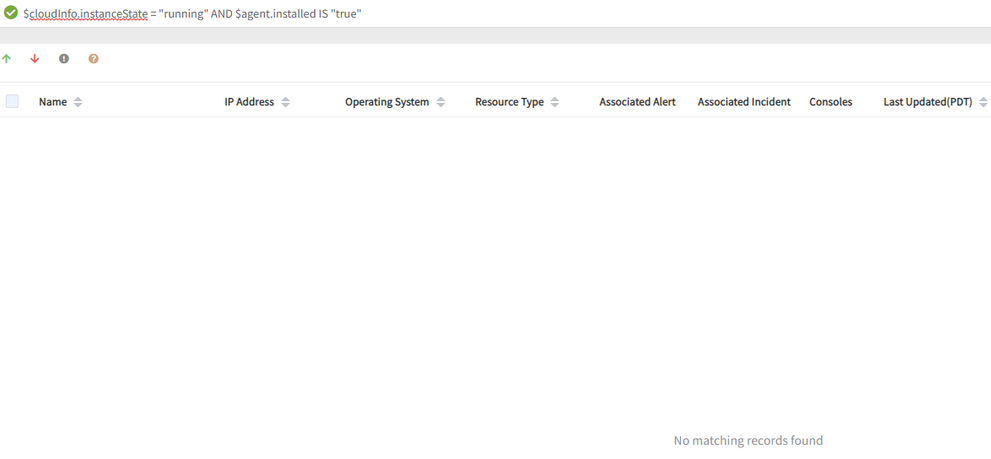
No matching records found message is displayed
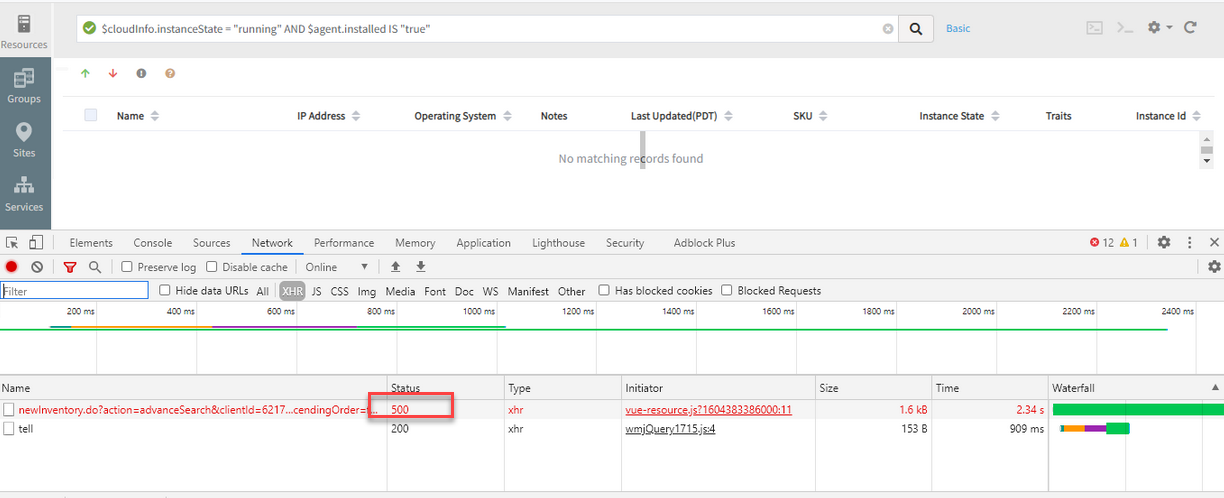
500 error is shown
This is happening by sending a resource ID that came from the elastic search results. Getting resource IDs from elastic API where there are no records in mysql DB.
Issue is fixed. Advanced search is working perfectly.
Tunnel connection log of the gateway is garbled
The tunnel connection log display content in Japanese is in a garbled form.
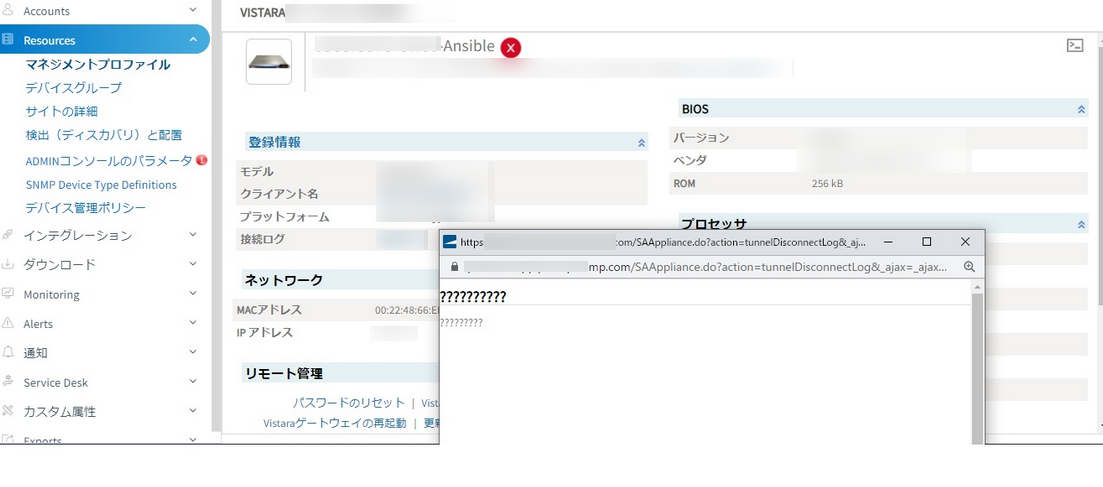
Tunnel connection log information is garbled
Page displayed is not encoded with UTF-8.
Encoded the page with UTF-8. Issue is fixed. The information is not showing garbled values.
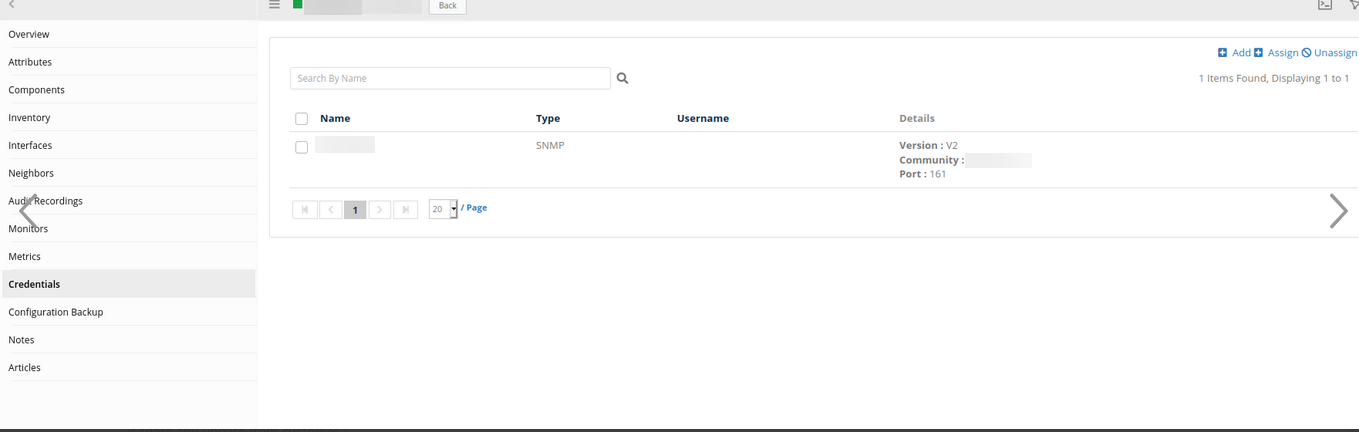
Credentials for Nutanix is missing
Nutanix infrastructure got discovered via API (used out-of-box integration), whereas to get the metrics out of templates there is no option to assign the credentials.
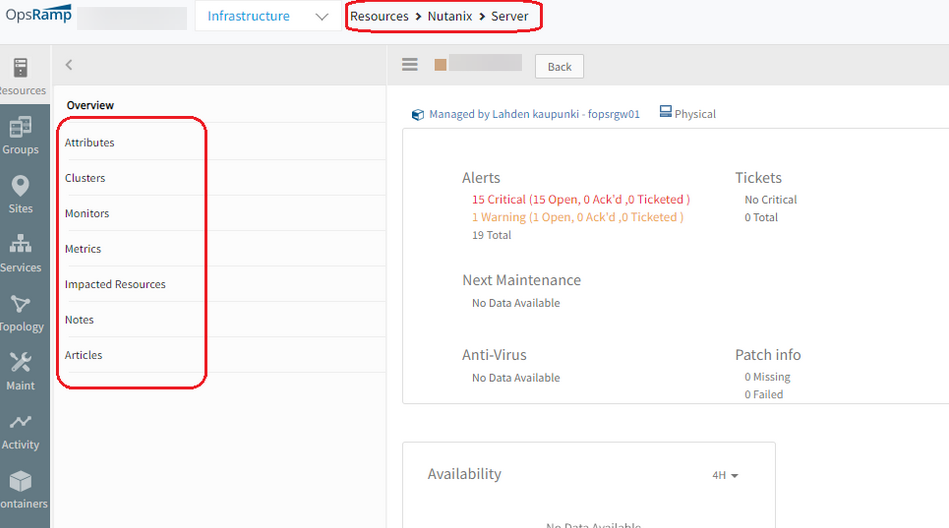
No option to assign the credentials
Till now, for NUTANIX resources, not showing credentials tab. Added credentials tab in resource-menu config.
Provided Credentials option under Resources tab listing.
Network device Neighbors tab is failing to show neighbors
There is an issue with listing neighbors for network devices, but the neighbors show in the topology just fine.
The neighbors tab is showing blank:
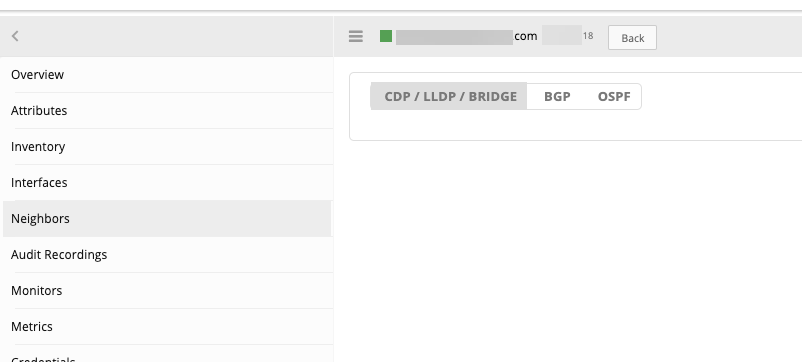
Neighbors tab is showing blank
Topology is showing the neighbors:
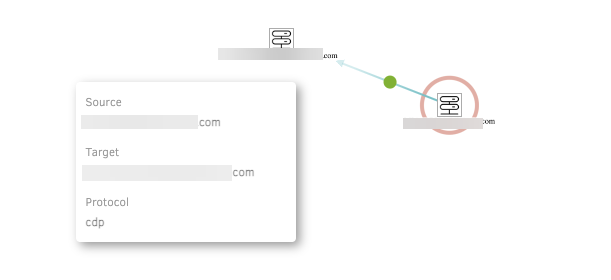
Topology is showing the neighbors
RCA: Due to accessing of new JSONObject improperly, getting issue.
Accessing JSONObject data with suggested ways. Issue is fixed.
Neighbors list data is displaying under Network Devices.
Filtering of Linux or Windows agents is not possible
The user wants to use the Advanced Search feature that is available under Monitoring -> Update Agents. Unable to select any agent versions after selecting Linux as Agent platform in the advanced search drop-down menu. The filtering of Linux or Windows platform agents is not possible. The box that should show Agent versions is empty, after selecting Agent platform.
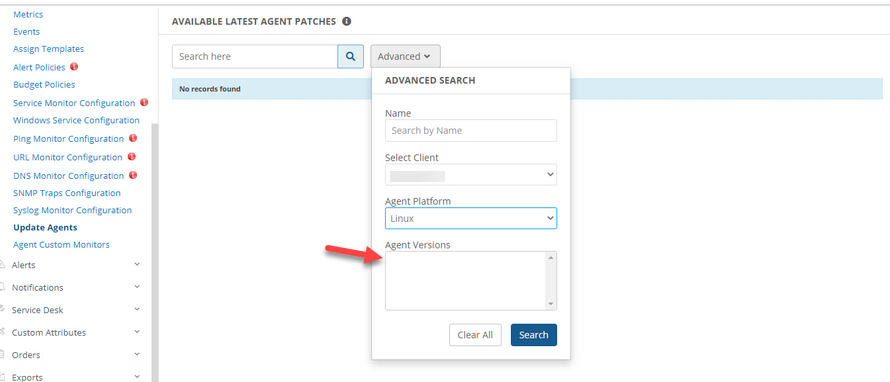
Agent versions is showing empty
Agent versions are not loading dynamically when client is changed in Advanced search.
Added a JSON call to get data of agent versions when client is changed. Issue is fixed.
Agent versions are loading perfectly.
Unable to edit service map nodes
The customer tried deleting the rule in the below screenshot. It saved fine, but when checked again, it was still there.
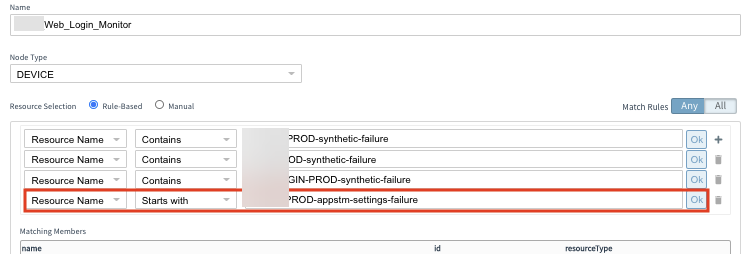
Deleted rule is still showing
Similarly, the customer deletes a rule and saves. When checked later, the rule is still showing.
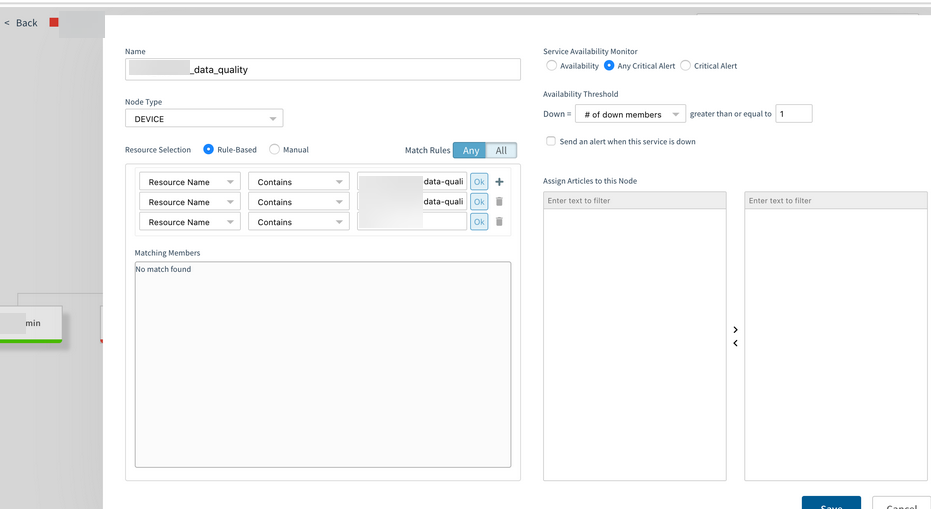
Service map node with three rules
One rule is deleted and saved.
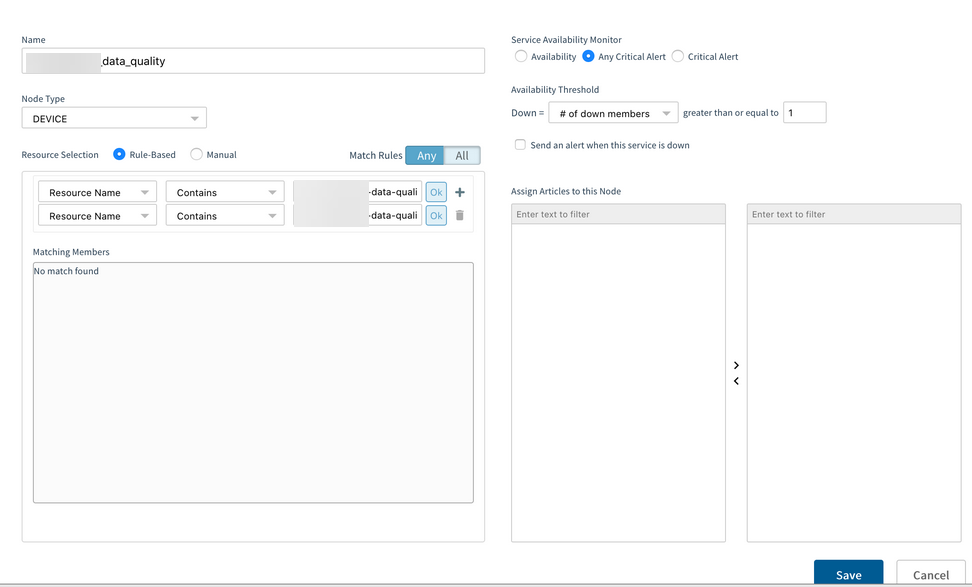
Deleted one rule and saved
The rule is still showing when checked again.
The rule is still showing
While editing service map rules on a child node after saving, memcache is not updated with latest data.
Cleared previous data from memcache. Issue is fixed.
Customer is able to modify the service map nodes successfully.
Dashboards full screen issue
When the customer is taking to Full Screen, it is showing ‘No Data Available’ in all fields.
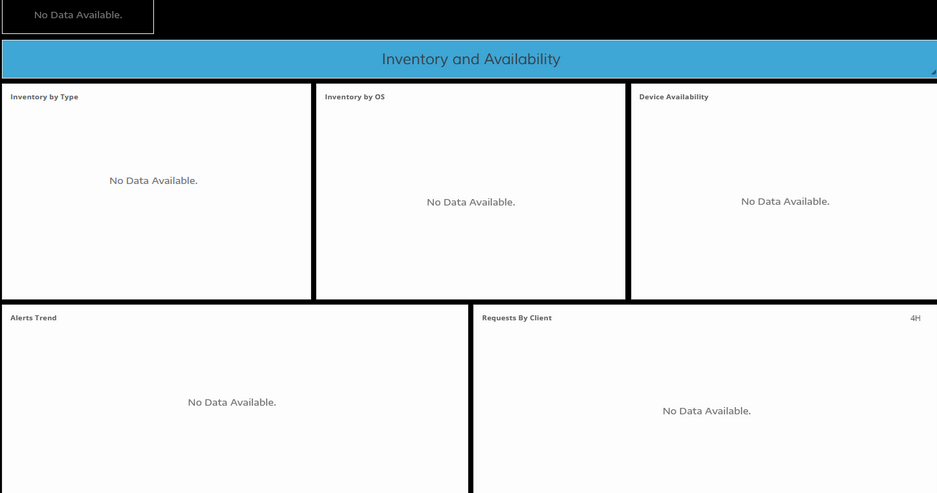
Full screen shows No Data Available
When they hit full screen on dashboard, all widgets lose values as shown in below screenshot, and values populate when they exit full screen.
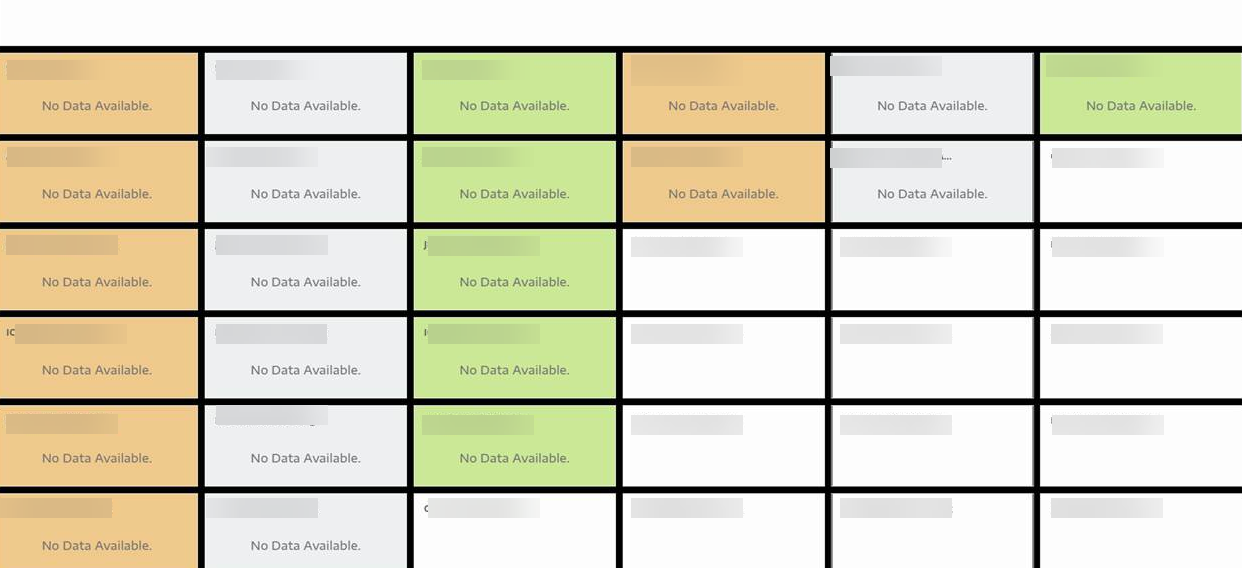
All widgets lose values
Moved the zoom() to the end of the full screen enter/exit sequence.
Updated the sequence of actions that run when changing to full screen so that the new data did not load until the newly resized chart was finished resizing before populating. Issue is fixed.
Full screen is working perfectly, loading all the widget values.
UI enhancements and enablement
New infrastructure search
The new infrastructure search allows you to more easily access resources within a certain client. You can perform advanced search queries to find resources and then access their recent queries at a later point in time.
New platform navigation
The new navigation allows users to more easily access platform areas from anywhere on the platform. By moving the core interaction to the top header, users have more horizontal space to perform tasks.
Modernized login screen
The default login screen now features a modernized look and feel.
New in-app feature request support
You can now submit feedback within the application by clicking on the top right of your user profile icon to access the Resource Center and clicking Share Your Feedback.
The submitted feedback is reviewed by the OpsRamp team and is used to make future product decisions.
In-app guides
The UI now includes feature guides that educate you about new features. These guides highlight a feature with a short description or steps you through the process of using a feature.
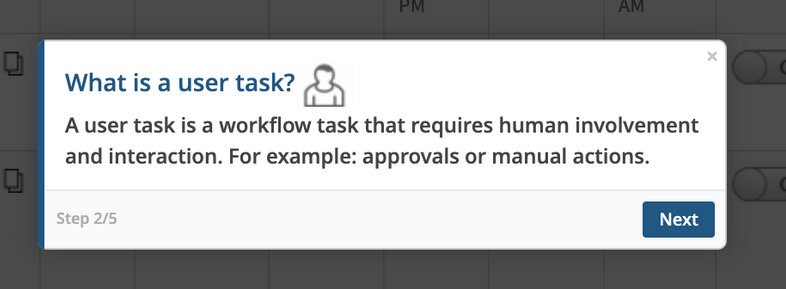
In-App Guide example
Resource management
Alerts view is not functioning properly
The customer cannot use Resource Groups to filter alerts.
When selecting a group or type, it is not able to resolve any devices.
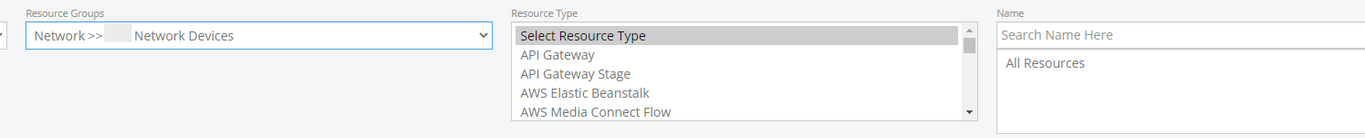
Cannot use Resource Groups to filter alerts
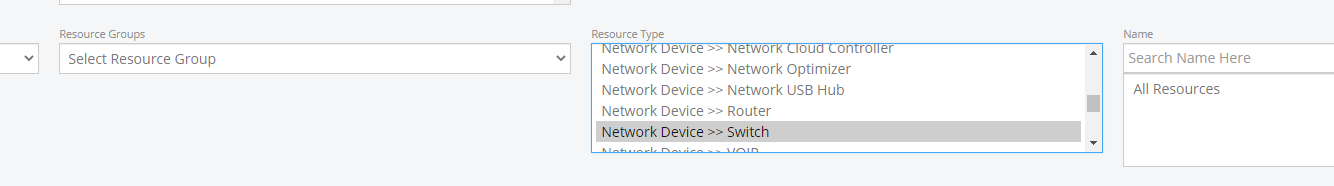
Unable to filter resources when selecting a resource type or group
Because of resource core model changes, have removed location from device class and when there is need to use location have to add a join externally on device table. Because of the inner join used, getting only resources with location.
Have identified a way to not add any join on location in this case and removed the join.
Issue is fixed. Alert view is functioning perfectly.
Resources' metrics are not loading
Metrics under the Resource page is taking a long time to load. A few metrics never load.
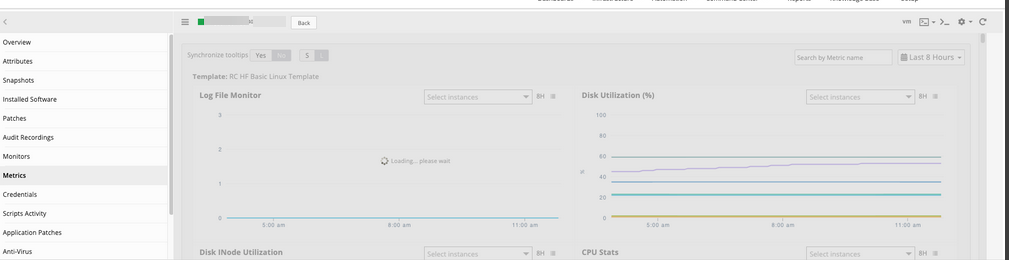
Few of resources' metrics never load
title from monitors, but some specific monitors we are not having title.
Added a condition if we are not having title for the monitor we are considering its service id.
Code changes are done to fix the issue. Metric graphs are loading perfectly.
Resources are not getting auto added as per the filter criteria
While trying to create a resource group with “Add members automatically using filter criteria” option and custom attribute Name, there is nothing added to the group after saving.
RCA: Issue is caused as attribute names are same. Had Native attribute as “Name” and AWS cloud devices with “Name” added as Custom Attribute. So, had issue while adding resource groups with the same custom attribute. The process was taking Native Attribute Name value instead of Custom Attribute value.
Added the boolean condition to differentiate the native and custom attributes while saving and updating the resource group.
Issue is fixed. Resources are auto added perfectly.
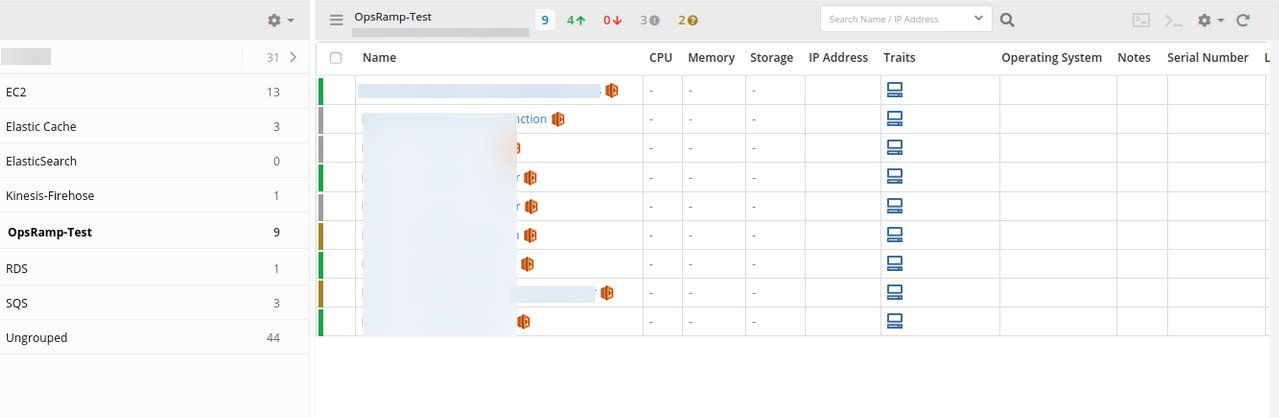
Resources are getting added as per the filter criteria
Device groups are not getting created
Issue is happening because of the generic resource filter that we was added to the group.
Observations:
a. Created a resource group with filter criteria (Device – Name – Contains – test) and when clicked Show matching members, able to see 43 as resources count, and the same reflected when saved the group. b. Edited the group by adding another filter (Generic Resource – testGrp – Contains – TestGrpValue) and when clicked Show matching members, able to see 43 as resources count, but when saved the group no resources were added and the count is 0.
Following are the screenshots for reference:
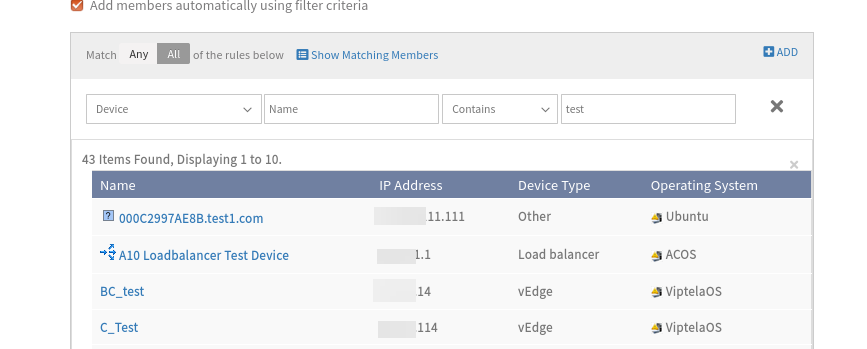
Able to create resource group

Generic Resource is added as Filter
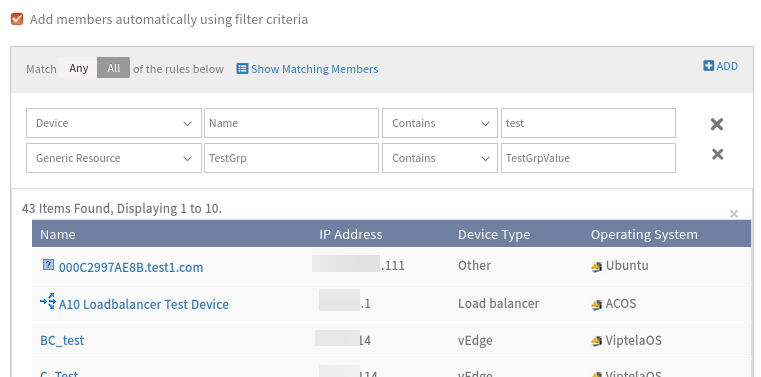
No Resources are added and the count is 0
RCA: Whenever the user is adding Generic Resource rule in filter criteria, the database MYSQL query is incorrectly forming, so due to that resources are not adding into the resource group.
Have fixed this issue by making changes in the database MySQL query formation and also including organization check in database query.
The resource groups are created successfully when the Generic Resource filter is added as a criteria.
Monitoring management
Unable to add the SKU quantity
Unable to add additional SKU in the portal for the client.
Not getting any error message when trying to add 2 SKU’s; it is not updating in the portal. After clicking Save, it is displaying the same page.
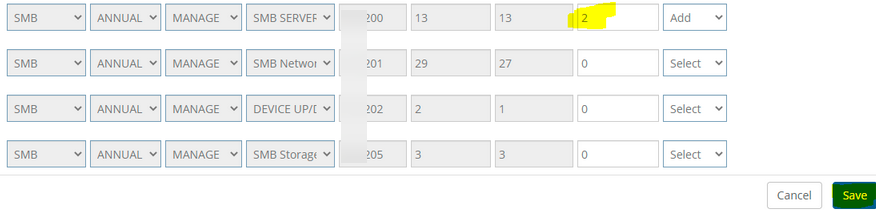
Not updating, showing the same page
Due to removal of partner admin changes, validation and also few changes in JSP are not properly done. Due to this, unable to get error message in UI.
Fixed these changes by removing partner admin changes in JSP. Service Order details are getting saved perfectly after adding SKU quantity.
Event logs special characters issue
The format of the string given as input, by the customer, in the Message String field when configuring the alerting for event log monitor is not supporting. They are running into an issue capturing an alert.
The valid strings are normal string and Regex string. Message String field supports both normal and Regex strings.
If the message string contains these characters - [,],{,},(,),$,+,*,/,\, then those characters should be preceded by escape sequence “\”. For example, if string is ab(AB)c then input in the Message String field should be like: ab\(AB\)c. XML parsing is breaking because of special characters in the message string. Added the message string in CDATA.
Fixed the issue that was causing the event log monitor to not pick up the desired event. This issue was caused due to the use of special characters as mentioned above.
Any expression looking to capture event logs with special characters should ensure the special characters are preceded by an escape sequence “\”. A note for the same is added in the Event log monitor section.
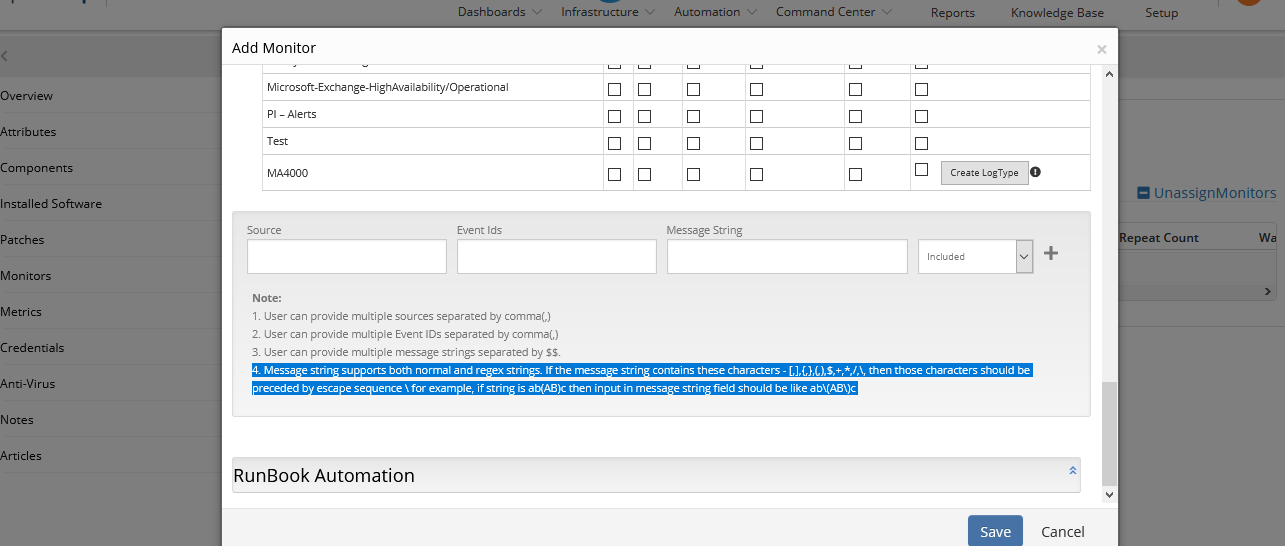
Note is added in the Event Log Monitor section
Synthetics
Unable to resolve DNS record
added the Web Service Monitor using DNS and the private gateway, but there seems to be an issue.
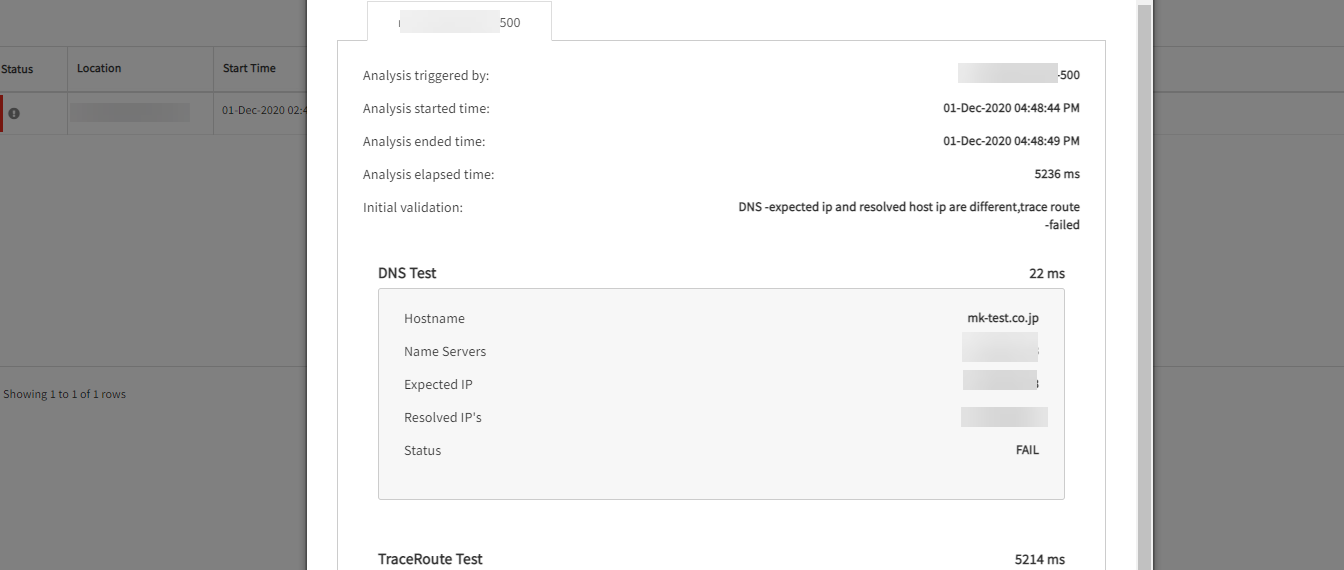
Unable to resolve DNS
Changed the design and made sure there are two ways for non-name server and name server related resources. Issue is fixed.
Received an alert even when template is not set
Customer received an alert for availability.down.locations.count metric showing count of 1, but the template is not set to alert on it. Also, in the metrics, nothing actually went down in the location count.
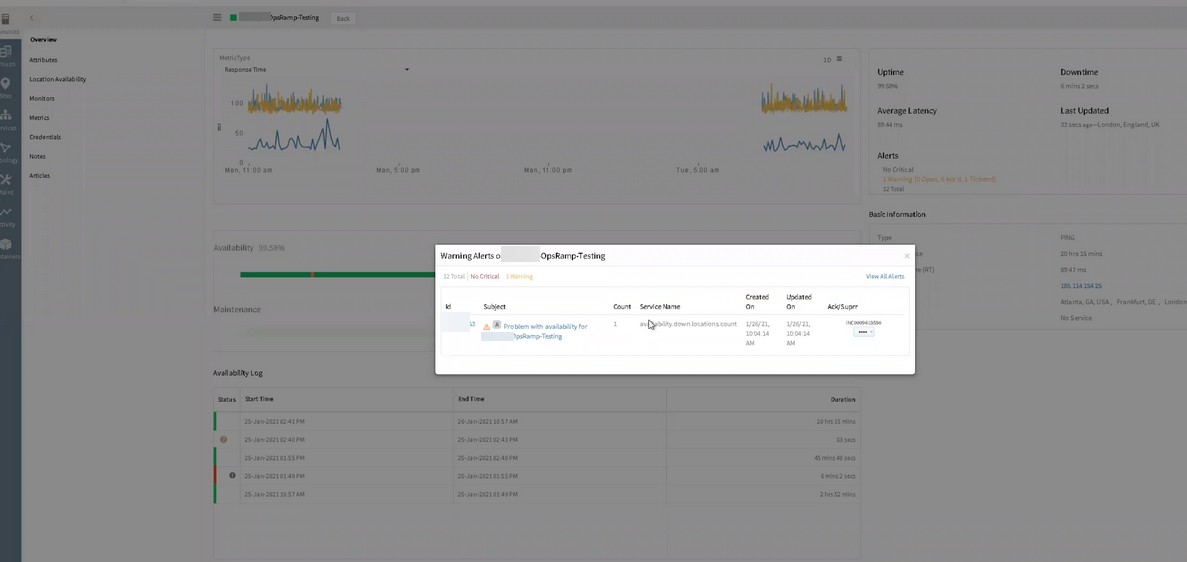
Alert showing count of 1
The template is not set to alert on it:
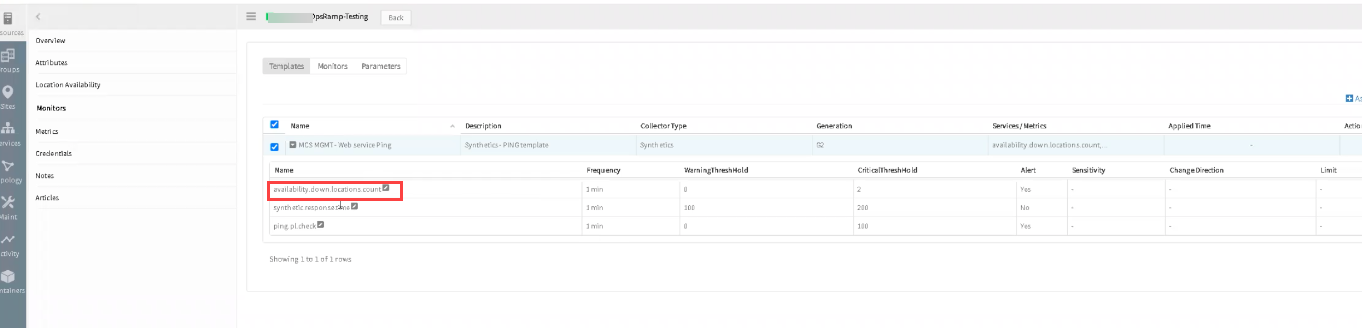
The template is not set to alert on it
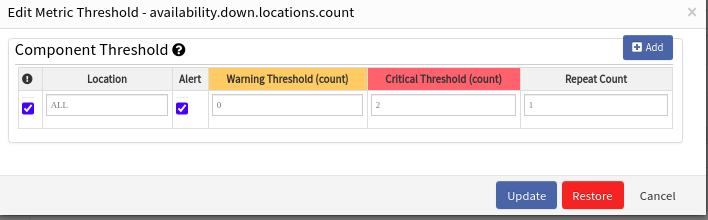
availability.down.locations.count metric threshold values
Nothing actually went down in the Down Location Count metric:
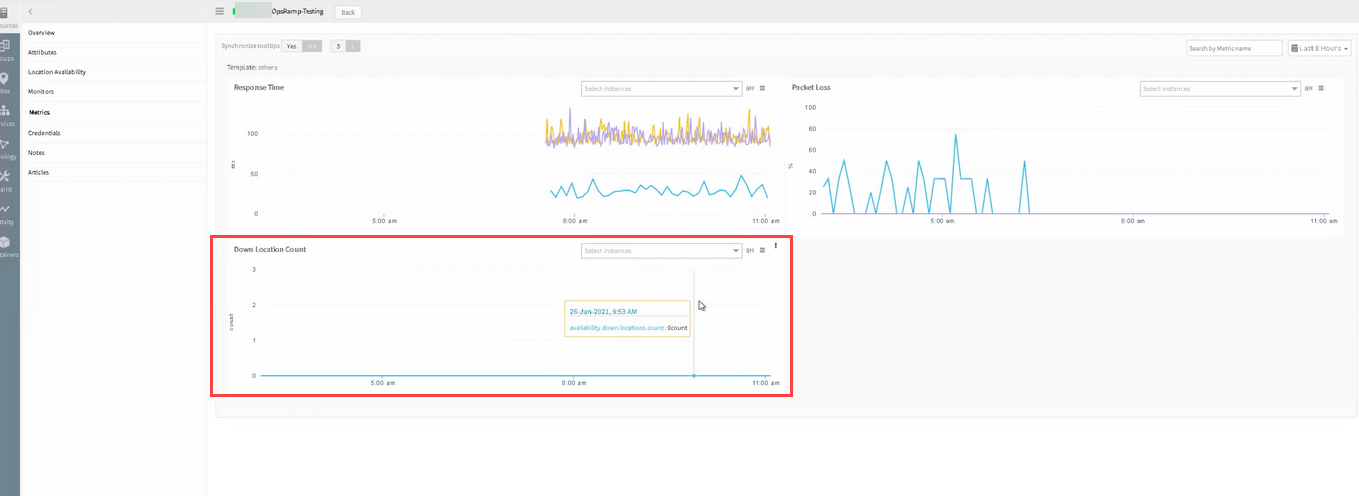
In the metrics, nothing actually went down in location count
Changes are done. Provided detailed Note for warning and critical thresholds for metric availability.down.locations.count. Restricted the fields, if user inputs 0. Also, restricted the fields, if user inputs string data. Issue is fixed.
So, string values are not accepted, and also 0 value is restricted for availability.down.locations.count metric.
The thresholds are handled from the UI for both new and the existing resources and templates. The thresholds are handled from the UI for global, service provider, and partner and client templates.
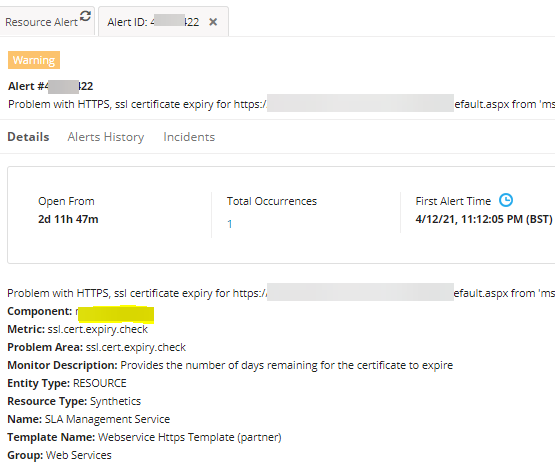
ssl.cert.expiry.check issue
Customer has configured ssl.cert.expiry.check to receive only alerts from Frankfurt, DE, however, received warning alerts from 3 locations.
The customer has enabled the following locations for the synthetics:
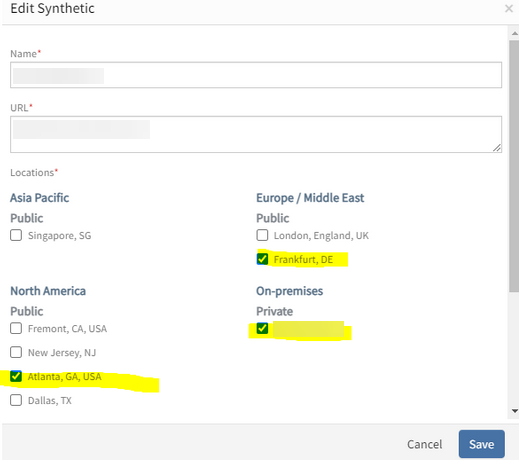
User has Enabled 3 locations
Component and Metric level thresholds are configured with only one location: Frankfurt, DE.
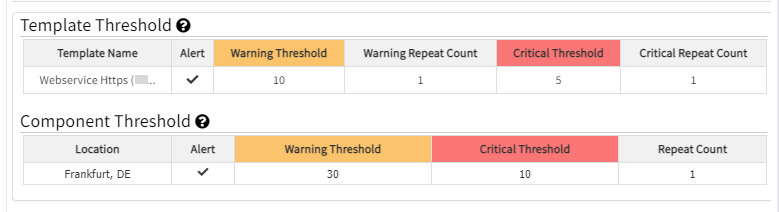
Component Threshold - it is configured with only one location: Frankfurt, DE
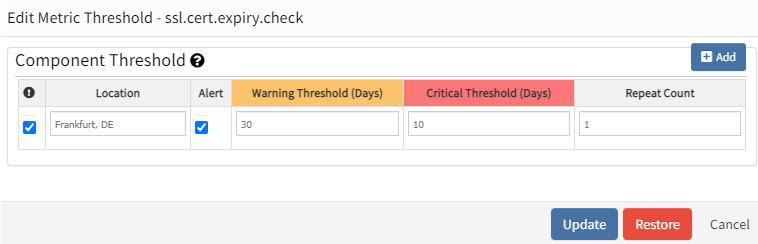
Metric Level Threshold - it is configured with only one location: Frankfurt, DE
As per the above details and configurations, only one alert should have been generated, but generated from 3 locations.
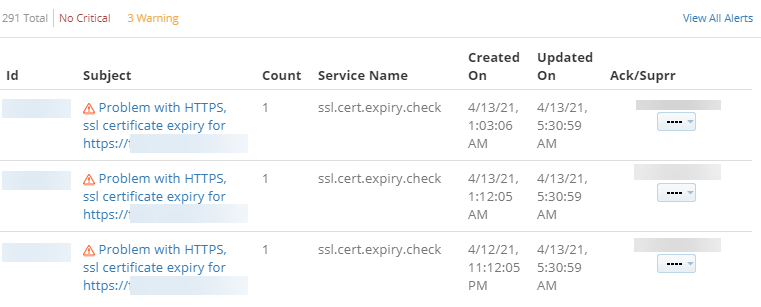
Warning alerts from 3 locations
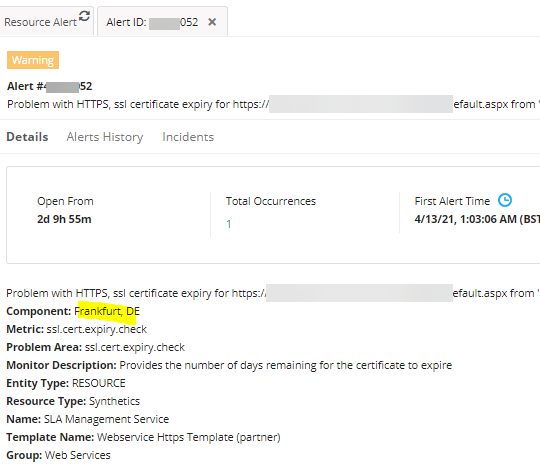
Warning alert from Frankfurt location
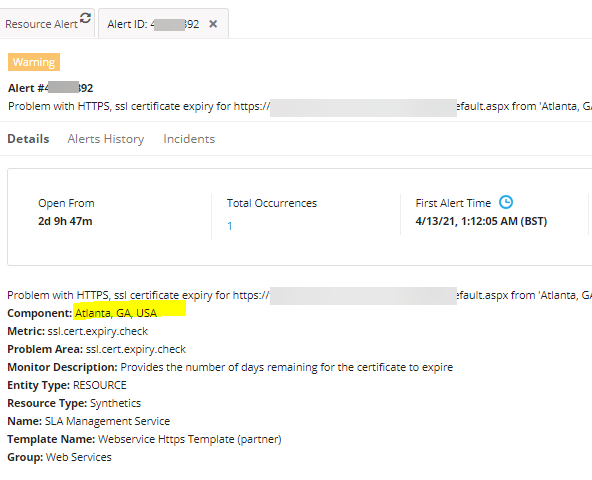
Warning alert from Atlanta location
Warning alert from on-premise location
Configured the location at component threshold level for generating alerts. So now the alerts will trigger based on the location/s configured at the component threshold level.
Issue is fixed.
Alert Management
Data gap is seen in the graph
Did not see the data for one node, for 5 days. These data gaps are seen for Dallas, TX.
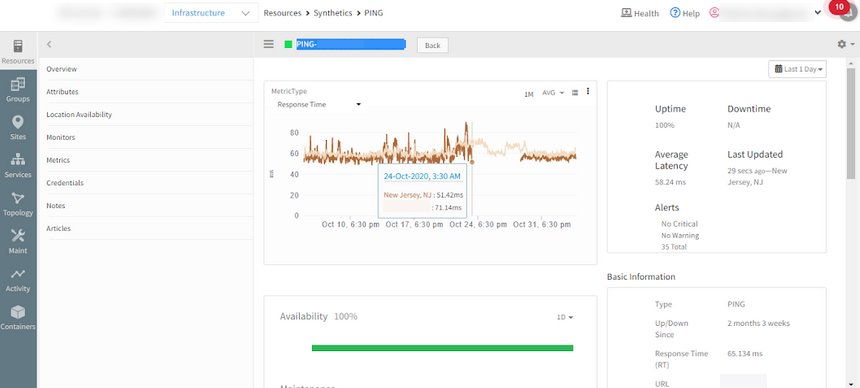
Data gap in graph
Missing configs at Synthetic collectors. Noted inconsistency in the collectors due to network issue at the restart time.
Issue is fixed. The graphs are plotting perfectly.
AEP Roster UI vs. API mismatch
Roster for AEP is showing as one user, but the same roster API call is showing as two users.
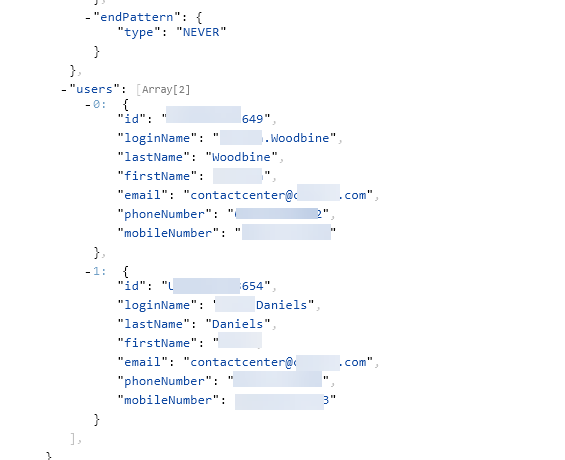
Roster API call showing as two users
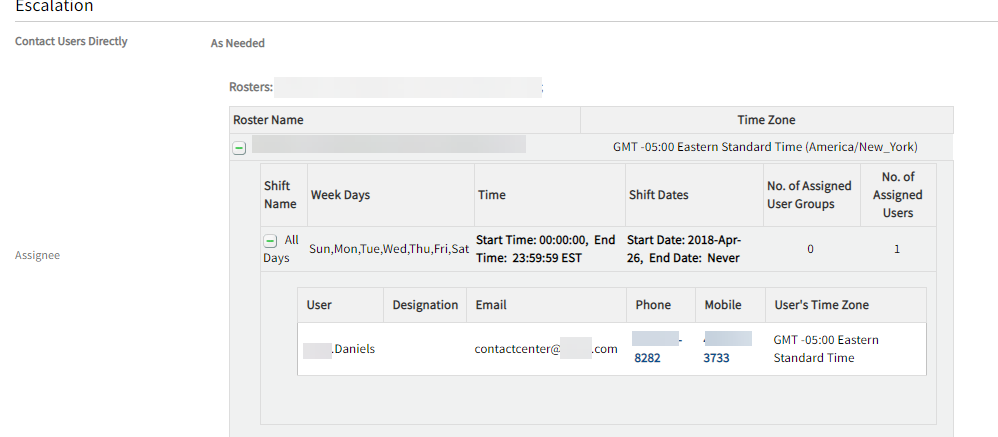
Roster showing as one user
For this roster, there are two users, but one user is deactivated. In the Alert escalation policy page, showing only active users list. In the API, both active and deactivated users are displayed.
RCA: In GET Roster API, showing both active and inactive assigned users list.
Provided only active assigned users list in GET roster API. Issue is fixed.
Unable to de-correlate alerts
Unable to de-correlate the alerts. Getting “500 internal server error” message.
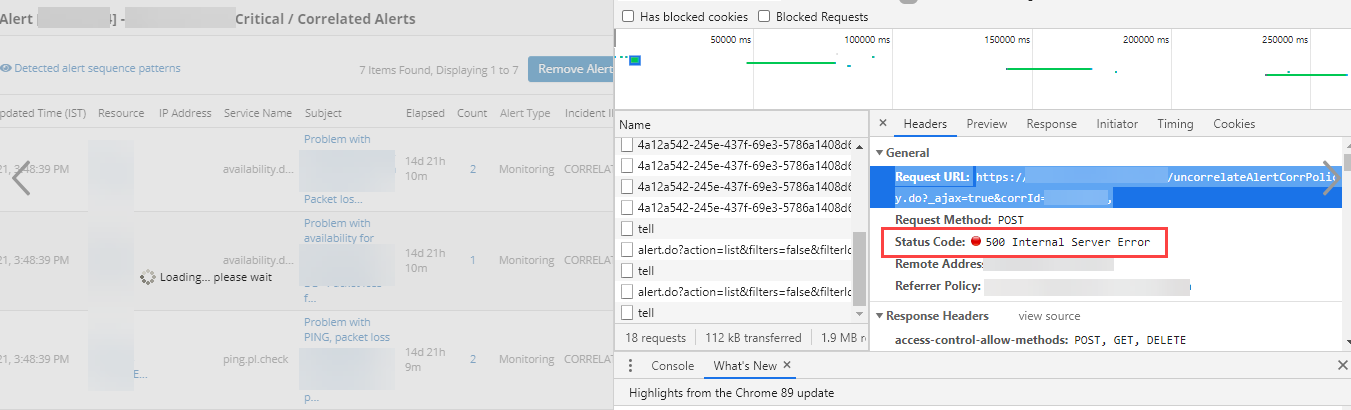
500 Internal Server Error
After de-correlating an alert, the inference is updated accordingly. Both these alerts are on a SYNTHETIC device which does not have IP address (null). This is resulting in SQLException (NULL param types are not supported) and failure to update inference.
Added a NOT NULL check. Issue is fixed.
Able to de-correlate alerts which are from Synthetic resource type.
Alerts are generated under schedule maintenance
Alert got generated for the device even though it is under maintenance. Also, there are notifications being sent from the alert escalation policy for the server which is under scheduled maintenance.
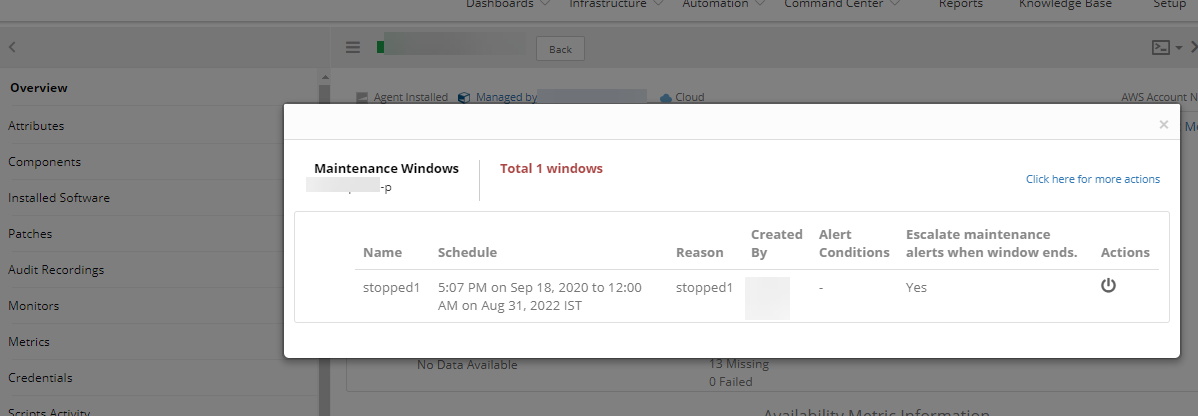
Maintenance window
Alert generated during scheduled maintenance
Notification sent from alert escalation policy for the server under scheduled maintenance
Scheduled Maintenance failed when getUserById API returned exceptions.
Ignore exceptions from unrelated/external calls. Issue is fixed.
No alerts are generated and no notifications are sent when under scheduled maintenance.
Network Automation
Backup is generating only 25-30 lines for FortiGate devices
For four devices, since one month, the backup is generating only 25-30 lines.
Not getting the Full length backup on the devices. Able to login and WALK SNMP fully from OpsRamp Gateway. When doing ssh to the devices able to see full backup.
Terminal command is not working on these devices. There is no support to FortiOS to get complete configuration page by page.
Added page-by-page support to FortiOS. Now getting full configuration from the last 2 days.
Issue is fixed.
Core Platform
Japanese content of exported Service CSV file is garbled
On downloading the CSV file, the Japanese content is garbled.
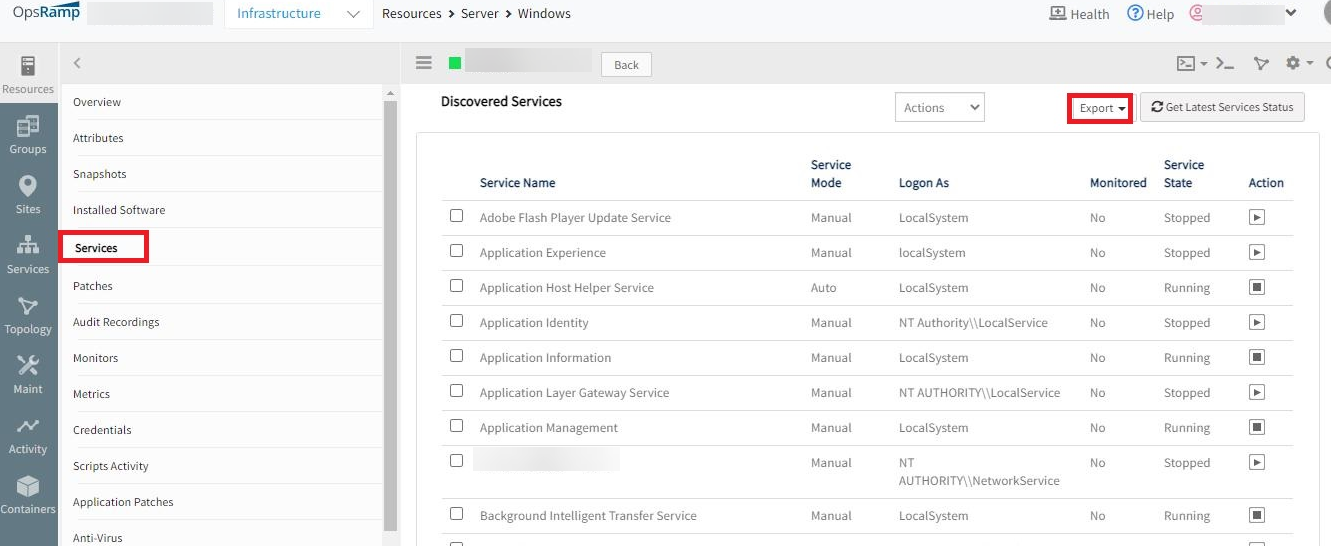
CSV Export
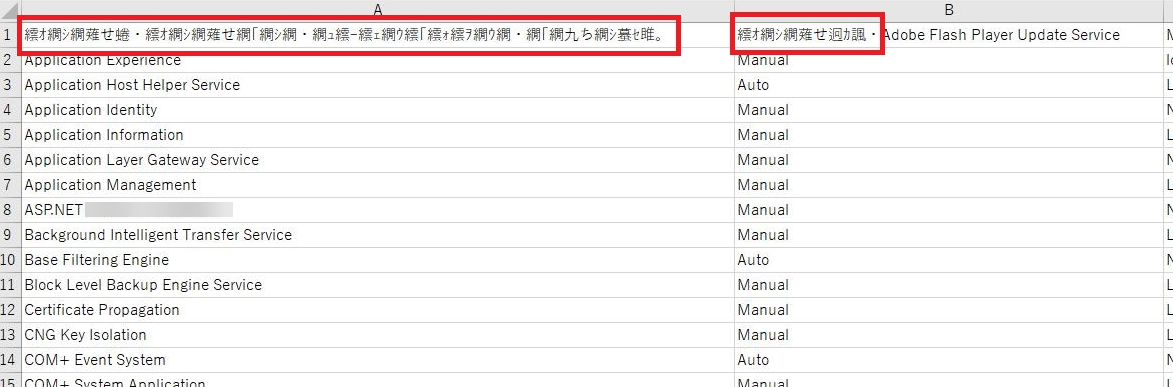
Japanese content garbled
Changed the character encoding, content type to UTF-8 for CSV download.
Issue is fixed. Garbling issue is resolved.
Discovery and monitoring
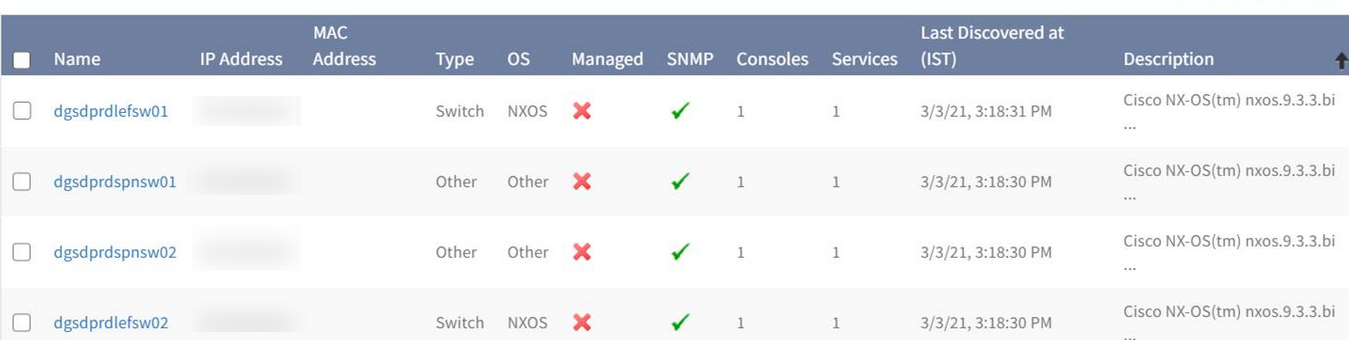
SNMP device is not recognized
Although the SNMP walk test from the gateway is successful, the SNMP device is not recognized.
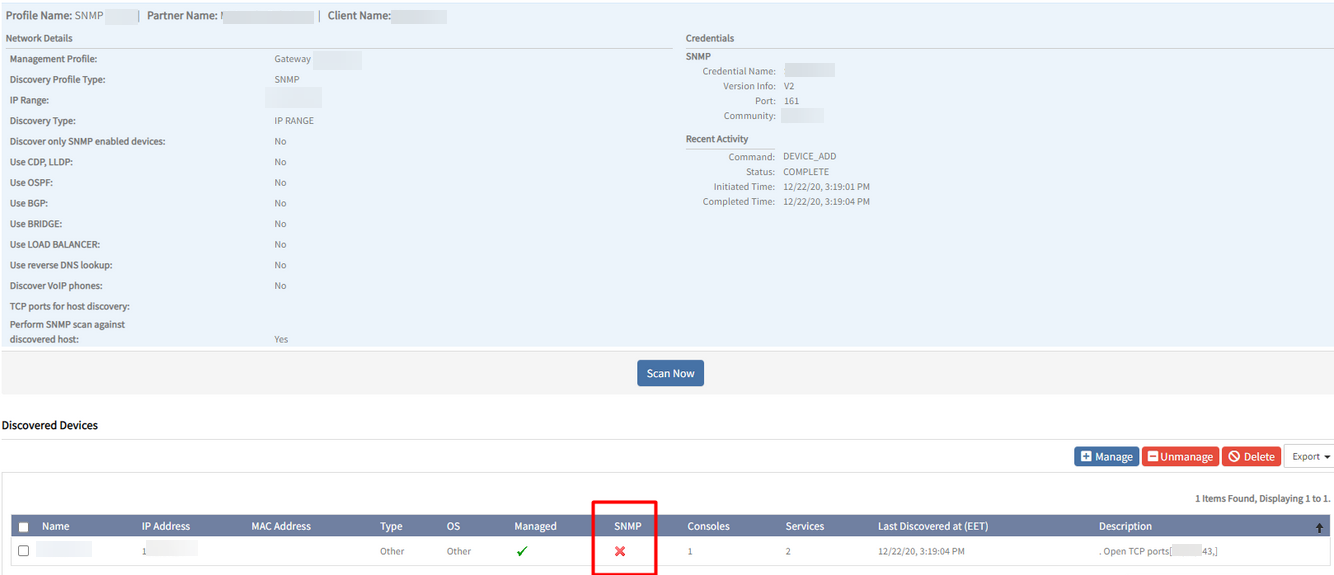
Does not recognize an SNMP device
Fixed this at VProbe code base (Handled the General variable binding error).
SNMP discovery is happening successfully.
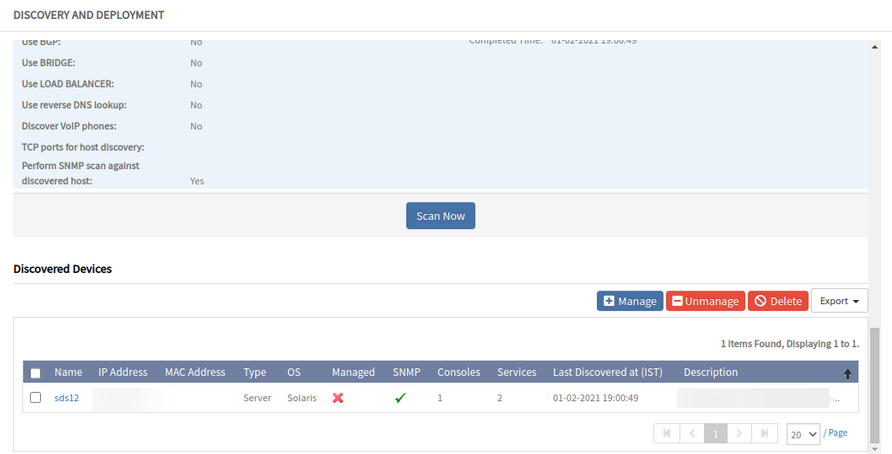
SNMP discovery is successful
Auto-monitoring
Seamless onboarding and monitoring of public cloud, cloud-native, and Linux agent resources
Newly-created clients have the option to set discovered resources to be automatically monitored. This enhancement greatly simplifies the setup process for getting resources onboarded and monitored.
Resources that qualify for auto-monitoring include:
- AWS, Azure, and Google Cloud resources
- Kubernetes resources, including Openshift and K3s
- Linux agent-based resources (RHEL, SUSE, Oracle Linux, Amazon Linux)
Limitation
Only available for newly created clients.Hybrid cloud onboarding guide
The hybrid cloud onboarding guide focuses on moving administrators from setup and configuration to visualizing performance metrics as quickly as possible.
After the onboarding guide completes, a new dashboard model and a set of curated dashboards are presented. The dashboard model and set of curated dashboards are based on the onboarded integrations and technology.
The resources supported in the onboarding wizard include:
- AWS, Azure, and Google Cloud
- Kubernetes
- Linux agent-based systems (RHEL, SUSE, Oracle Linux, and Amazon Linux)
Note
The onboarding wizard is only operable with resources compatible with the new auto-monitoring model. This setting is only available for newly-created clients.Alert definition model
Accompanying the new auto-monitoring model, a new alert definition construct is available that allows administrators to streamline threshold settings on metric data. The new model provides enhanced flexibility for setting alerts and a centralized repository of all alert definitions that users set on metric data.
Limitations
- The new alert definition model is only compatible with the new auto-monitoring model and with auto-monitoring resources.
- This setting is only available for newly created clients.
- Availability settings are not currently available.
Dashboards 2.0
The new dashboards allow you to create and customize visualizations for your cloud and cloud-native infrastructures. Dashboards 2.0 has a built-in query builder that allows you to write complex queries using Prometheus Query Language. These dashboards currently support the following tile types: rich text, image, line graph, and bar graph. Dashboard 2.0 also offers a robust color palette to format and style your charts and graphs to fit your needs.
Note
Dashboards 2.0 are only compatible with the new auto-monitoring model. This setting is only available for newly created clients.Curated dashboards
Curated Dashboards are out-of-the-box dashboards that are configured to give you instant visibility into the status/health of popular cloud/cloud-native services such as AWS, Azure, GCP, and Kubernetes. Curated dashboards can be copied and used as a starting point to create custom dashboards.
Note
Curated Dashboards are only compatible with the new auto-monitoring model. This setting is only available for newly created clients.Cloud monitoring
EC2 hosts report an incorrect operating system
Customer executed an AWS integration for their AWS environment. Linux resources show the correct OS in this integration, but Windows resources show their OS as “unknown_to_sdk_version.”
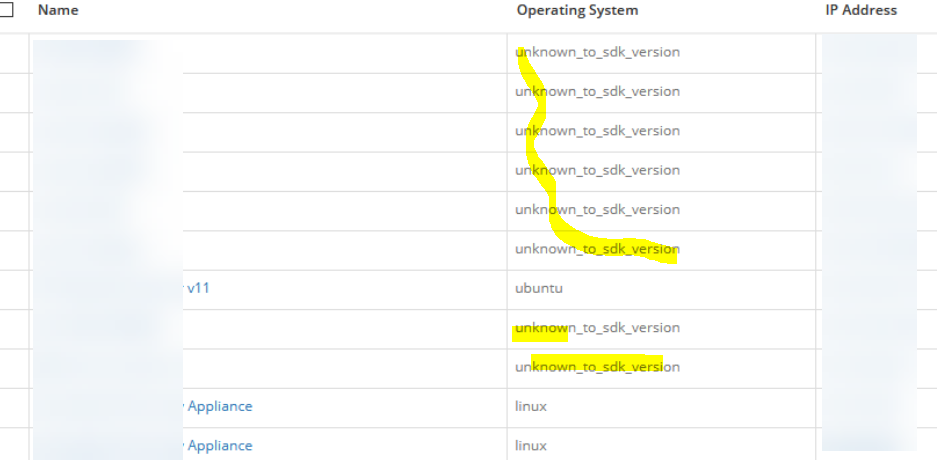
Windows resources show their OS as unknown_to_sdk_version
Due to outdated SDK, unable to get OS for windows devices.
SDK is updated. Issue is fixed. The Windows resources running on AWS report the correct operating system.
Container and cloud-native monitoring
Container-based application detection
With the focus on providing visibility into containerized workloads, native container monitoring is extended to support the discovering and monitoring of containerized applications. Users can visualize application metrics and alert on key performance indicators to ensure that applications are available and running.
Providing visibility into the applications running in containers gives administrators the next level of insight into the services supporting their business applications. Over 25 applications are auto-detectable, including Cassandra, MongoDB, MySQL, and Kafka.
Note
Container-based application detection is only compatible with the new auto-monitoring model. This setting is only available for newly created clients.Prometheus metrics integration
The ingestion of Prometheus metrics into the platform is available. Metric ingestion provides data federation across their Prometheus instances and long-term storage of Prometheus metric data.
Limitations
- The Prometheus metrics integration is only compatible with the new auto-monitoring model.
- This setting is only available for newly created clients.
- Alert definitions cannot be set for prometheus metrics for the initial 9.0.0.
- You can still leverage dashboards 2.0 for metric visualization but need to use the Prometheus Alert Manager integration for alerts.
Enhanced Kubernetes cronjob/hob metric support
The Kubernetes agent implementation now collects cronjob and job metrics from kube-state. This enhancement permits visibility into the active jobs running within the kube cluster and enables kube admins to more easily troubleshoot job failures and errors that occur.
CRI-O Runtime Support
The container runtime support is extended to include CRI-O. CRI-O is the default container runtime for RedHat OpenShift. The discovery and monitoring of CRI-O containers is supported. CRI-O provides administrators with additional context about the health and performance of their applications running on the CRI-O container engine.
Filter discovered containers in agent configuration
OpsRamp has extended its container filtering capabilities to allow for administrators to include and exclude containers being discovered and monitored by OpsRamp. You can filter the discovered containers in both the Kubernetes and Linux agent. This flexibility allows for administrators to only onboard containers that are relevant for their business, and ensure they are only paying for what is important for them.
Public cloud resource support
The public cloud monitoring is now extended to support several key services within AWS and Azure.
AWS
- AWS Connect
Azure
- Azure Blob Storage
- Azure Table Storage
- Azure File Storage
- Azure BatchAI Workspaces
- Azure BlockChain
- Azure Databox Edge
- Azure Logic Integration Service Environment
- Azure Kusto Clusters
Updated Azure Metric Support:
- Azure CDN
- Azure ExpressRoute
Azure monitor event ingestion
Events that are generated by Azure Monitor can now be ingested.
Administrators can post events from the Azure monitor into OpsRamp to federate their event management and reduce event fatigue. Native alert correlation and escalation policies ensure that events are de-duplicated, correlated, and escalated to the appropriate team members.
Block agent installed cloud resources without an integration
Previously, agents installed on cloud resources (AWS, Google Cloud, Azure) without an installed cloud integration automatically connected to OpsRamp. For auto-scaling resources, this often meant that stale resources persisted after the resource was deleted in the cloud provider because agent installed resources are not deleted automatically.
Administrators can configure the option to block cloud resources with an agent installed if there is no matching cloud account ID. This permits administrators to reduce stale resources and ensure that only the resources they care about are onboarded.
Notification and blocking of duplicate cloud account installations across clients
In large organizations, it is not uncommon for many administrators to have access to the same cloud account. Unfortunately, administrators that integrate cloud accounts with OpsRamp might not be able to determine if the account has been onboarded previously, and might reinstall it in a separate client. This creates duplicate resources across clients and increases cloud-watch spend. Now, administrators can set configuration to block duplicate cloud accounts across multiple clients.
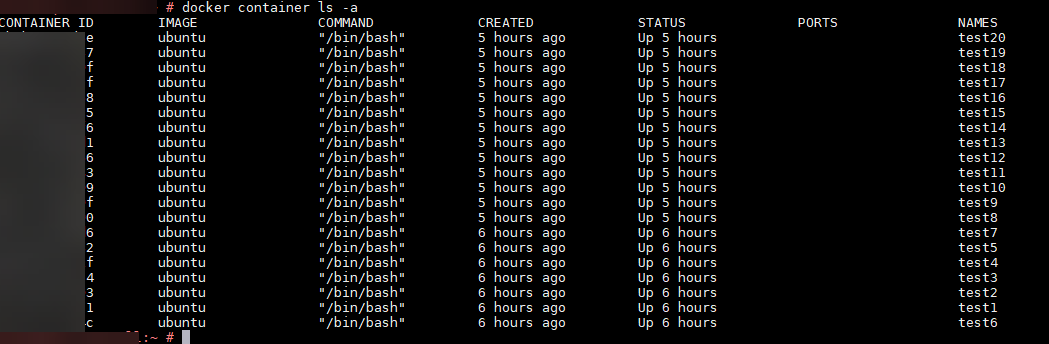
Containers and their status are not getting synced correctly in the portal
Docker is installed on the node. Applied docker monitoring templates to the node and got the metrics snapshot as well.
Initially, all the containers showed up and reported status as “UP”. After some time, status changed to “UNKNOWN”, though the containers were “UP”. Deleted a few containers, but can still see them. Only 20 containers are shown in the UI and there is no way to navigate to other containers in case the number of containers is 20+.
Containers status is UP
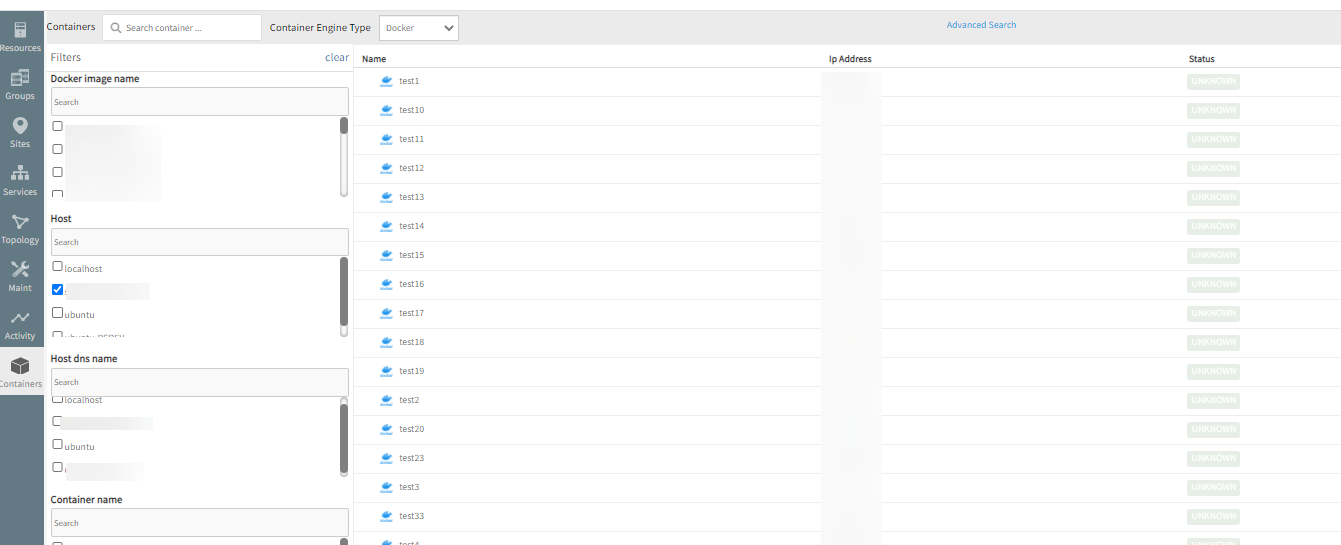
Status is showing as Unknown
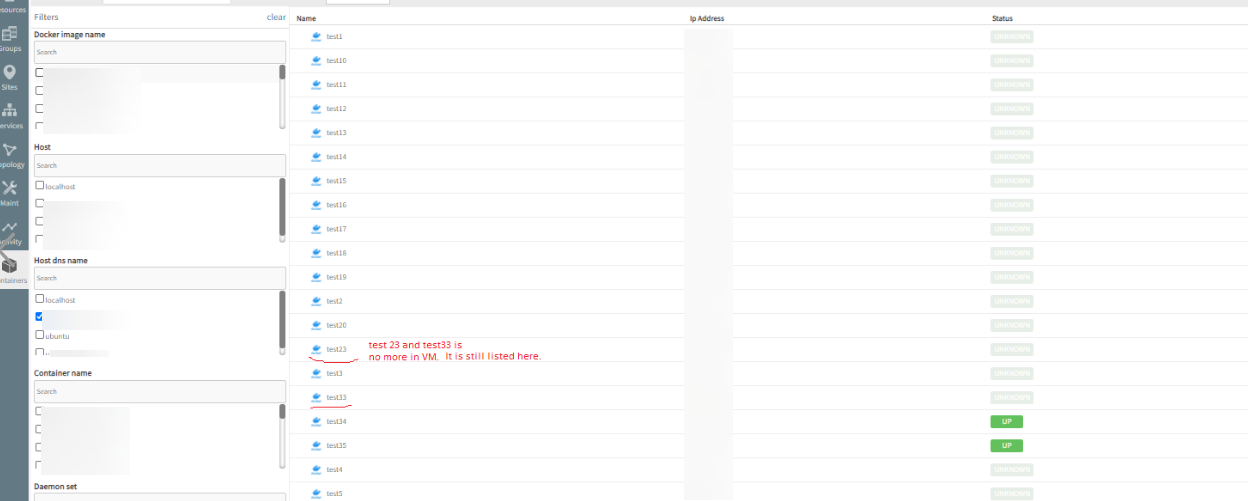
Deleted containers, but still showing as running in the VM
As seen in the above screenshot, 24 containers are running, but actually only 22 containers are running in the VM. Also, only 20 are shown in a page.
Fix has been provided to the customer. Containers and their status are syncing perfectly.
Datacenter monitoring
Cisco Hyperflex
Discovery and monitoring of Cisco’s leading Hyper-converged infrastructure solution, Hyperflex HCI systems, is supported.
Integration covers discovery of Hyperflex components (clusters, nodes, storage disks & VM’s) and monitors them for performance and availability. Integration also supports event ingestion from Hyperflex into OpsRamp.
Event and incident management
Partner-level first response policy
Users who manage multiple clients on behalf of customers can now create a first response policy at the partner level to significantly reduce the time needed to create and manage alert policies. A single machine learning training file is provided for ease of use and convenience.
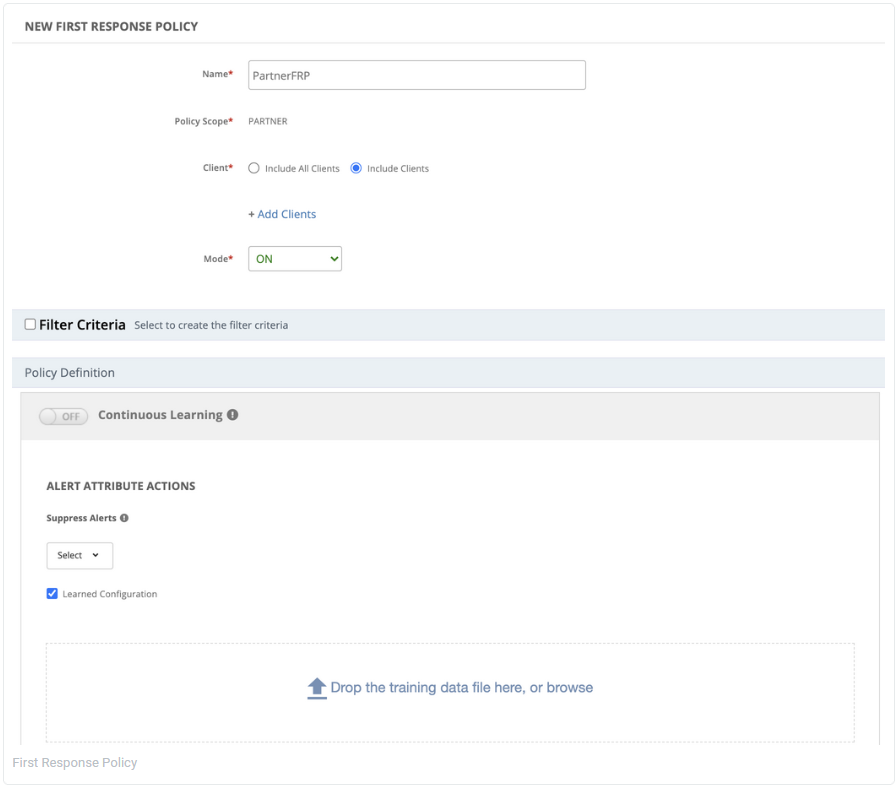
Partner-level first response policy
Limitation
Running of process automation workflows.Seasonality time frame selector
To further reduce alert noise and fatigue, the client level first response policy now includes the option of selecting a time frame of up to three months to identify alert seasonality patterns and suppress them. Previously the default was three months of alert data.
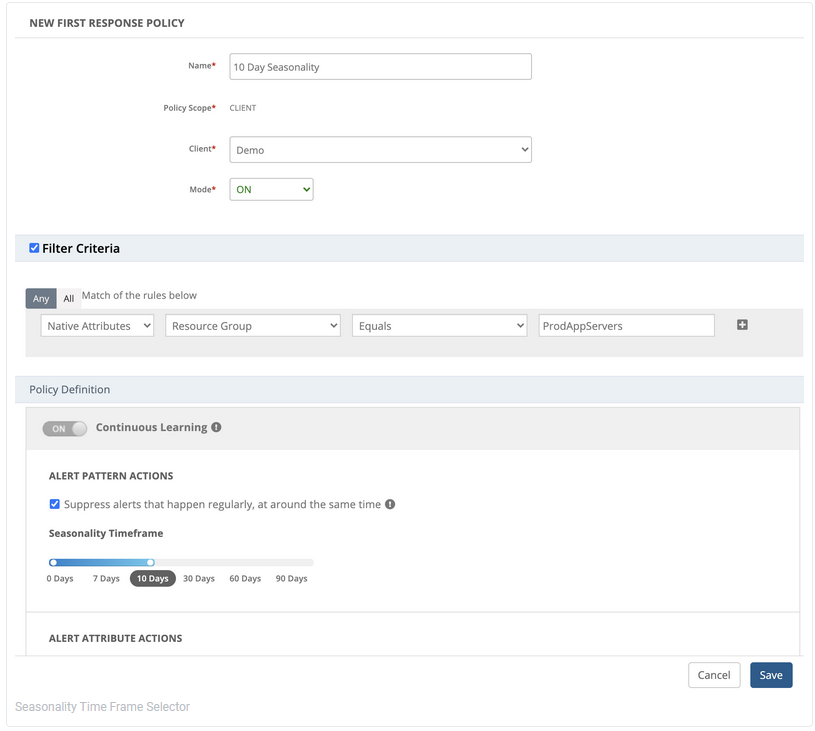
Seasonality time frame selector
Custom attribute alert escalation support
Users who have defined custom attributes for their resources and services can now select them during the configuration of alert escalation policies when defining alert conditions.
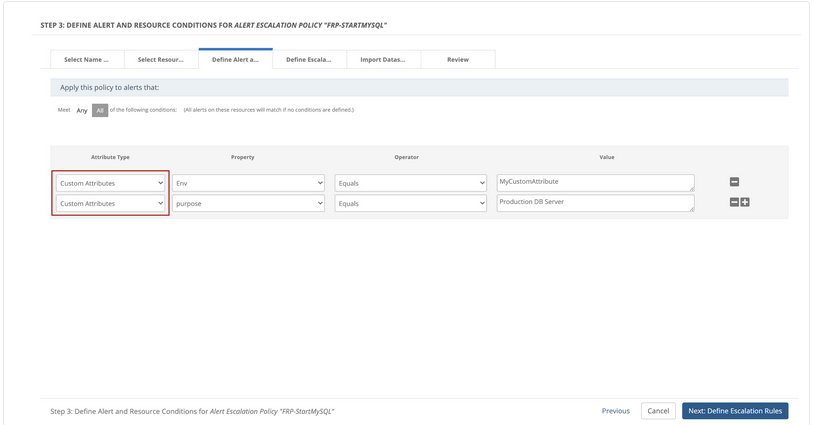
Custom attribute selection
Enhanced webhook-based inbound service management entities
Collaboration integration’s inbound configurations have been extended to support service Requests, problem records, and change record, with incident management. This enhances the capability for integration with webhook-based service management entities.
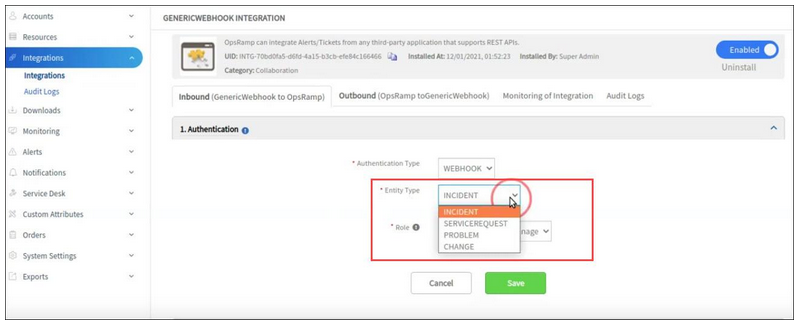
Generic webhook integration
Service Management
The request date and time on the “Home” screen is not in JST
For business users, the request date and time of “All Recent Requests” on the “Home” dashboard is displayed in UTC.
In the user’s profile, the Time Zone is set to “GMT +09: 00 Japan Standard Time”. In the list of “All Requests” screen, it is displayed in JST.
RCA: Date showing in the dashboard listing page has GMT format instead of user timezone.
Added code change to showcase the date in user timezone.
App Templates
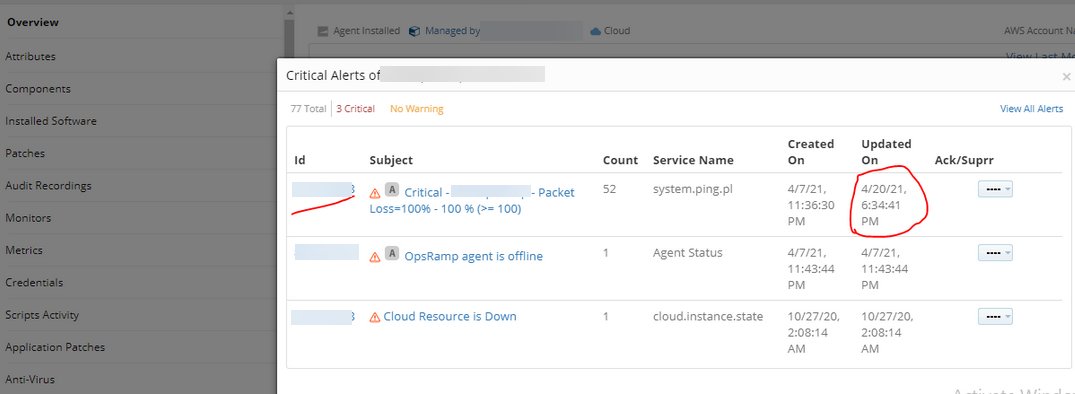
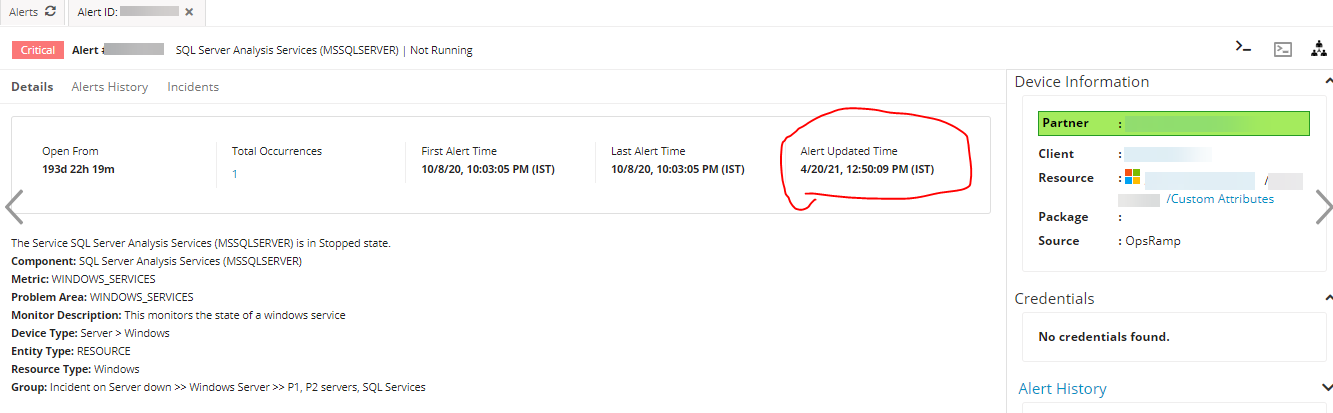
Job is not running on SQL server, but critical alerts are generated
No job is running on the SQL server, but multiple critical alerts are triggered specific to the SQL server job.
The jobs got disabled on December 21, 2020. After this date, the job was not run. Still there are job failure alerts running, since December 21st. The Multiple critical alerts are created on different dates on the same subject, metric, monitor, and frequency. The first alert that got created should heal (but did not heal); instead there are multiple alerts created. Incidents are also being raised.
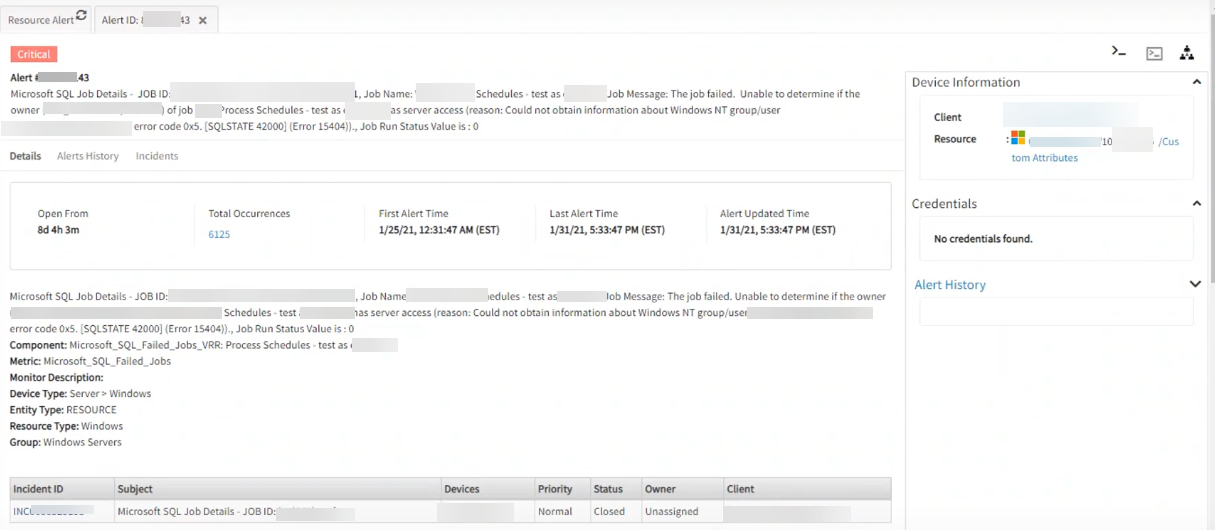
Critical alerts are being generated
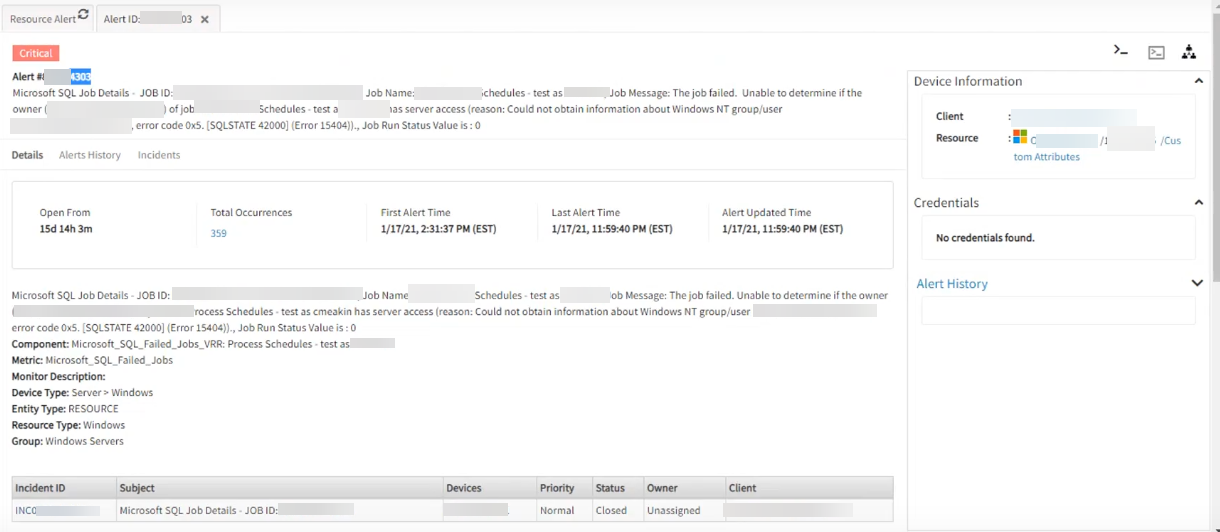
Critical alerts are being generated
Validated the issue from the script side. Suspecting few of the job names are having subset of another name as below:
Process Schedules - test as
Process Schedules
The starting of the job name is compared and this leads to matching with other job names which start with the same pattern. Fixed and replaced the script and validated the same.
The job failure critical alerts are not being triggered anymore. Customer Monitor Name is Microsoft SQL Failed Jobs.
Compute Monitoring
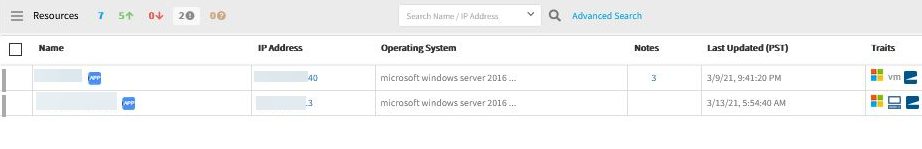
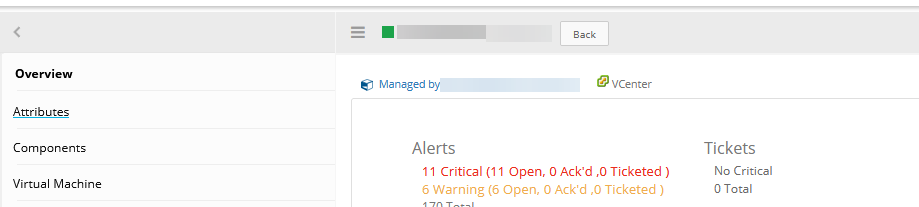
Nutanix VMs data is not populating (which resulted in unknown devices)
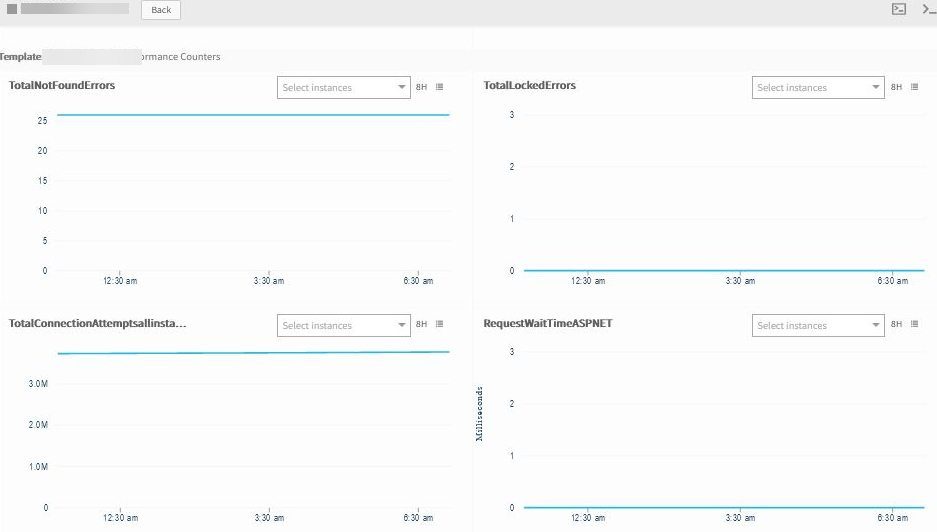
The “Prod Windows Servers - Nutanix VirtualMachine Performance” template is meant for the same device make/model, but no data is appearing when the latest metric value is checked.
- Agent is Installed
- Availability is enabled
- Monitoring is enabled
- Graphs look good
- Resource status is showing unknown.
- Port is open from end device.
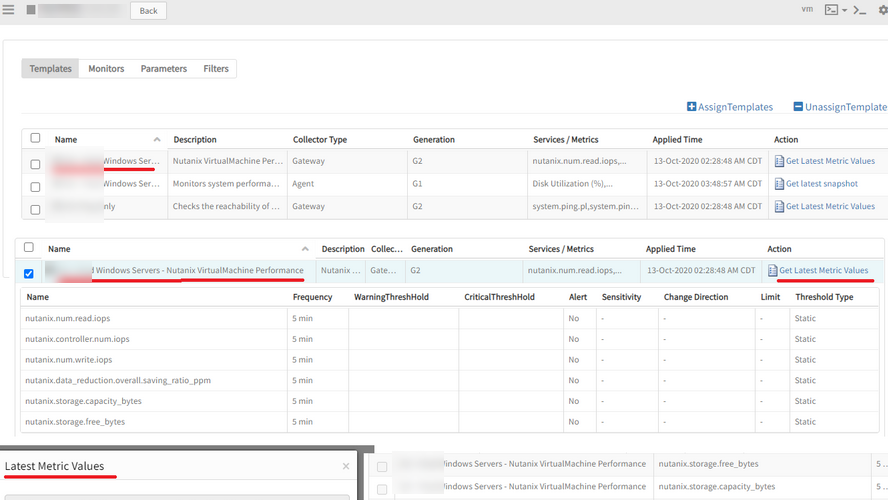
Nutanix VM data is not populating
Unable to collect data for the metrics in the template from API based on the queries, at the gateway end. Logs are not clear.
Pushed and updated the JAR files into the gateway.
Code fix given for all the metrics: num_read_iops, controller_num_read_iops, num_write_iops, data_reduction.overall.saving_ratio_ppm, storage.capacity_bytes, storage.free_bytes.
Graphs are populating perfectly. Issue is fixed.
Patch management and antivirus
Patch installation progress tracker
Users can now track patch installation progress right from the patch configuration page. You can see the approved, installed and failed patches in the patch configuration in quasi-real-time. This allows the patch admins to take corrective action on failed devices within the patch window.
Notification for superseded patches
Users can now choose to be notified every time a superseded patch is un-approved. Users subscribing to the patch scan notification email receive a summary of all approved patches that have since been unapproved because they are superseded.
Bitdefender antivirus support
Bitdefender antivirus is supported. Users can configure an antivirus update job to update Bitdefender definitions to the latest versions.
Recovery alert received late
Post patching agent has rebooted the server and received the recovery alert after 12 hours.
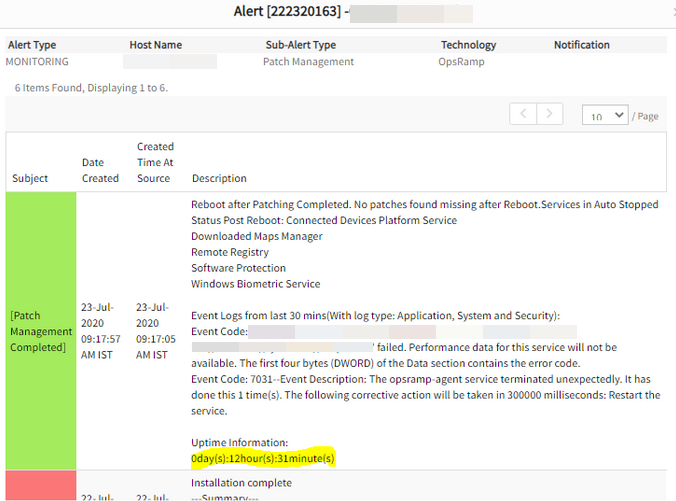
Received the recovery alert after 12 hours
Issue occurred because the system rebooted very quickly (within seconds) and the agent was checking time difference in minutes.
Handled the case where the system reboots within a few seconds.
Issue is fixed.
Reports and exports
Agent connectivity details in inventory report
The Inventory Report now includes an attribute for the agent connectivity method, for agent-managed devices. This attribute provides information on whether the agent has been installed to connect directly or through a proxy.
Include only specific hours of week in reporting period
The customizability of reporting periods is improved by allowing users to report on specific hours for each day of the week. Common usage for this feature is to schedule reports for business operating hours. This change is now available for the Alert Report, Availability Report, and Network Statistics Report.
Metered usage export
A new batch export type is available for exporting resource usage over a time interval. The usage export provides both a breakdown of metered usage by resource type and a breakdown of usage by tenant. This export provides insight into how resource consumption is metered.
Schedule Maintenance report is not running
Schedule maintenance report is running for a very long time. This report should be created every day as per the schedule.
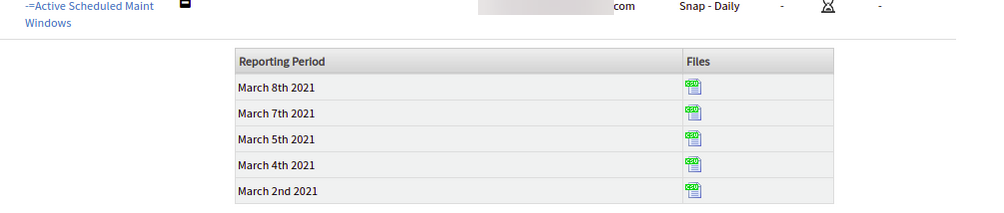
Schedule maintenance report is running for a very long time
Getting Memcache-related errors while loading the associated resources of scheduled maintenance window, which is causing failure of the report sometimes.
Handled the lazy and Memcache exceptions to generate the report. Issue is fixed.
The report is running perfectly.
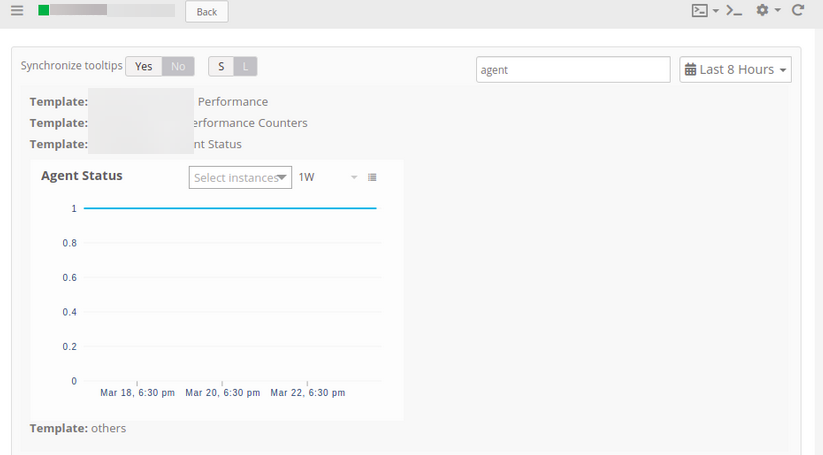
Custom reports are failing
Custom reports are scheduled to report on the agent status metric. The report runs every day. This report is now failing after 2-3 minutes.
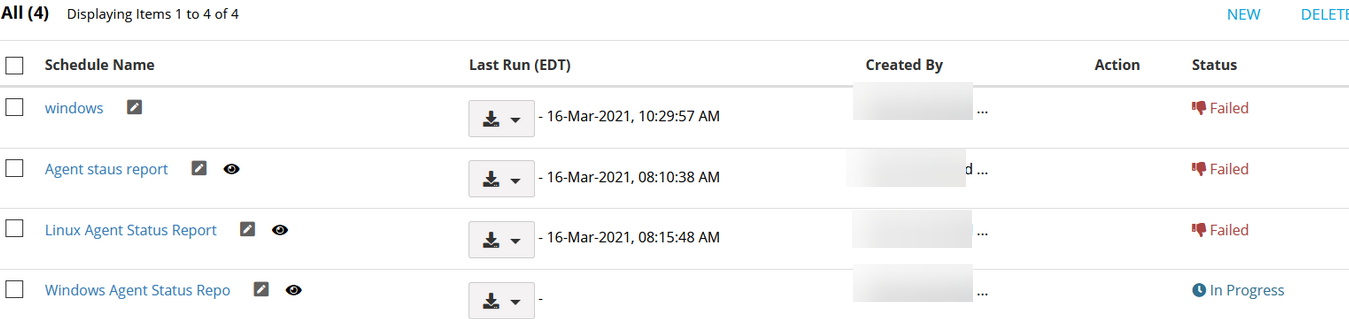
Custom reports are failing
RCA: If any resource is not configured with specified templates/monitors/metric then the API call fetches empty data/void data which causes the report to fail while rending data with void data in the reporting tool.
Handled if the resources are not configured with those specified metrics. Issue is fixed.
Custom reports are running perfectly.
Availability
Devices are in Unknown status
Agent is reporting online. Metric graphs are populating fine, but devices are showing unknown in the portal. Have recomputed the availability rule, but it is still the same. Have availability checked on agent status and the latest graphs are plotting fine.
Agent is online
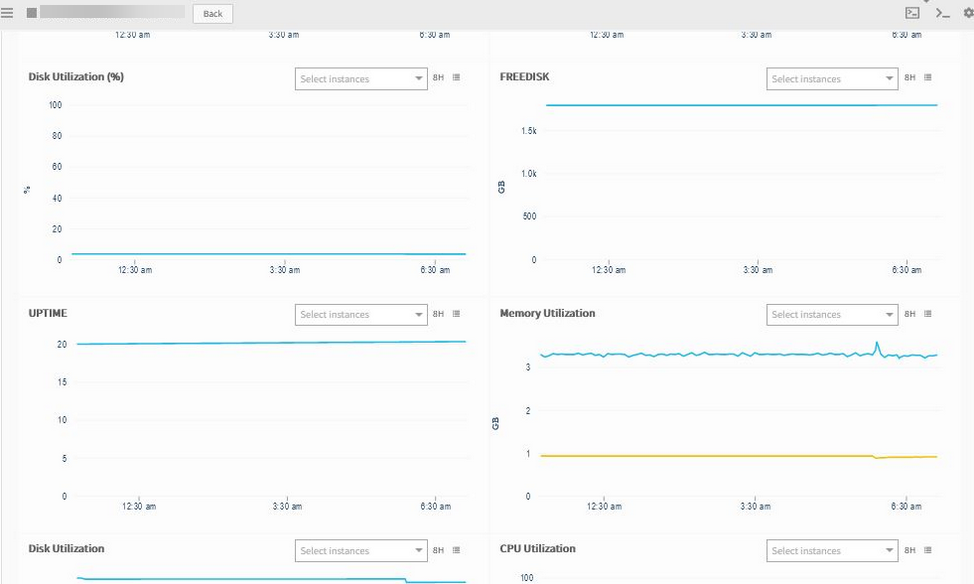
Graphs are plotting perfectly, but device is showing as Unknown
Graphs are plotting perfectly, but device is showing as Unknown
Found some stale entries in the backend database. Removed the entries and the resources are showing up. Also for one resource wrong template was applied. Once the customer removed the template, the resource is Up.
Device is showing up
Metrics are okay, but Resource is Grey
The availability is 100% and metrics are okay, but the resource is in Unknown state.
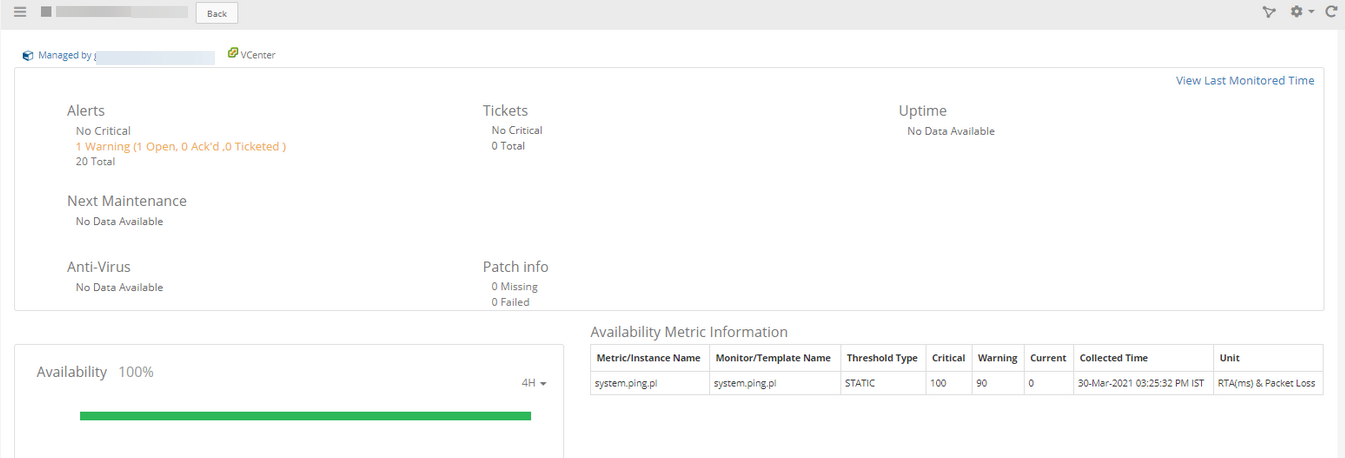
Availability is 100%, but resource is in unknown state
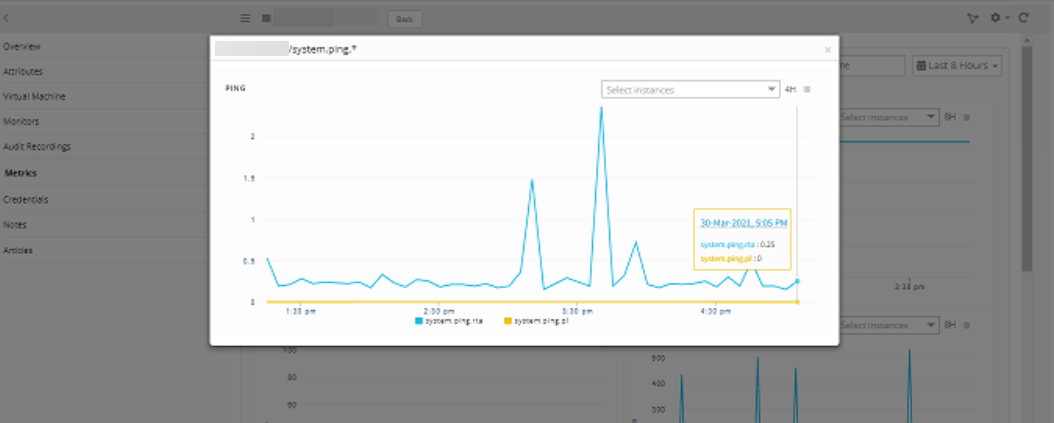
Metrics are displaying okay
The availability cache key which was used during the metric process to send a metric sample to the availability spark node is wrongly used. Due to the wrong cache key, not sending any metric sample to the availability spark node and hence expecting NO_DATA event and resources are moving to UNKNOWN state.
Making use of same cache key through the engine to avoid such issues. Issue is fixed. Resource is showing up now.
Resource is showing up
Remediation and automation
Timer boundary event
Often, during the runtime execution of a process automation workflow, there is a need to pause for a specific time interval before continuing to the next task in a sequence flow. The timer boundary event now adds this flexibility when creating workflows.
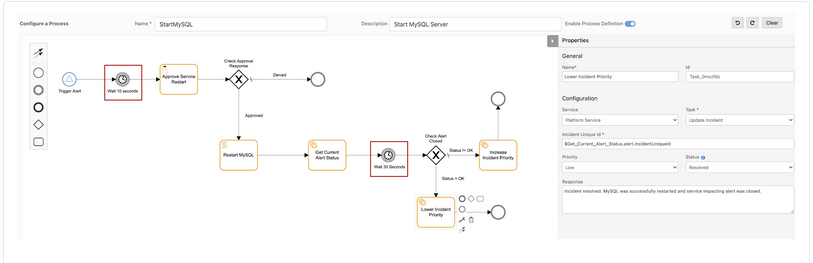
Timer boundary event process
Permission set
Administrators can now provide secure access to process automation features within the platform to only those users who are required to view or manage workflows.
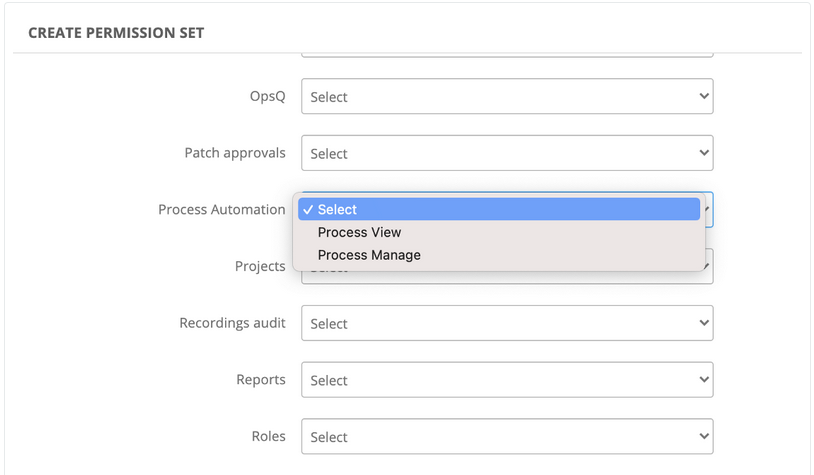
Permission set
Process definition and instance search bar
A new search bar is provided to enable automation users to rapidly search for process definitions or process instances that are available to manage and view.
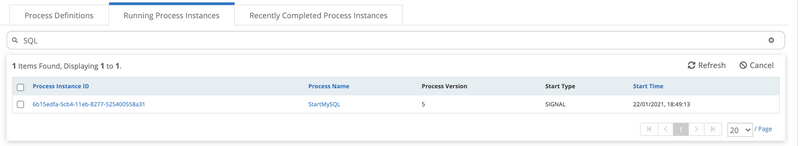
Process definition and instance search bar
Process automation is not running
The process automation for this customer is supposed to be running daily at 2AM, but is not running.
No running process instances:
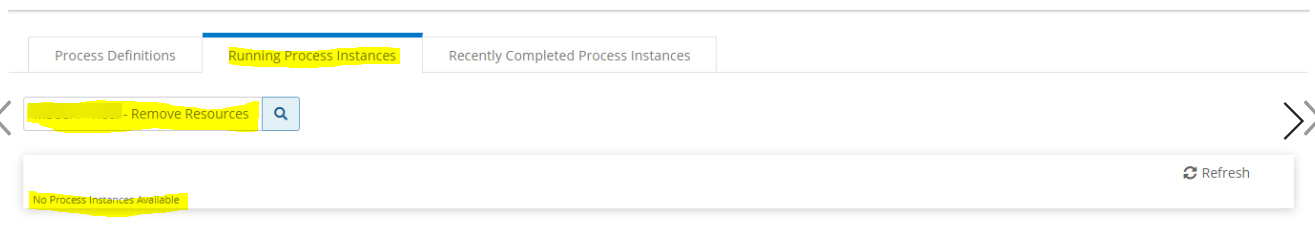
There are no running process instances
No recently completed process instances:
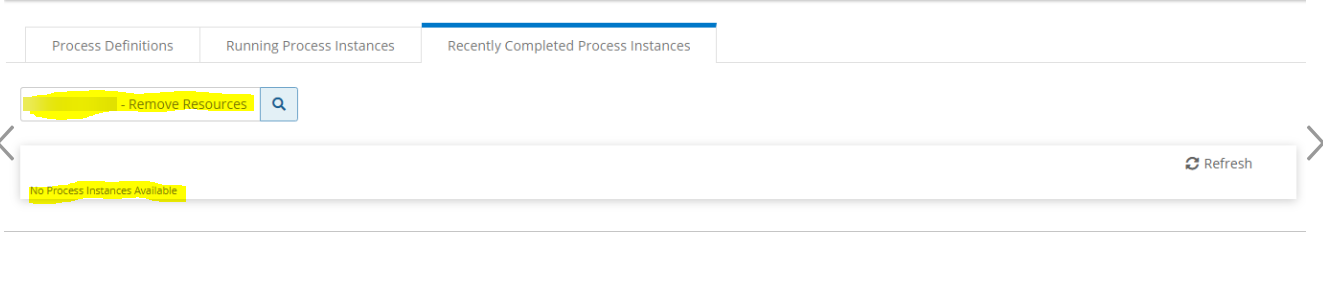
There are no Recently completed process instances
Have been using JSONObject.get(String) method till now. This is a deprecated method, which is returning JSONnull instead of null.
Now used the JSONObject.get(String,class) method. Issue is fixed.
Process automation is running perfectly.
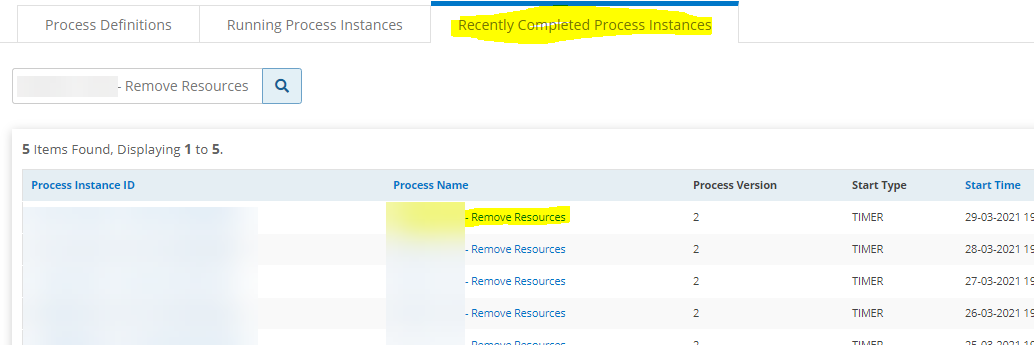
Process automation is running perfectly
Knowledge Base
Images are not loading in KB articles
Broken image is getting loaded in the KB article. This is happening when inserting the image using the editor.
Broken image is getting loaded
RCA: Path exposure security fix is done in image path. Reference vulnerability fix caused this issue when images are uploaded through TinyMCE editor.
Image path references are updated for images uploaded through editor.
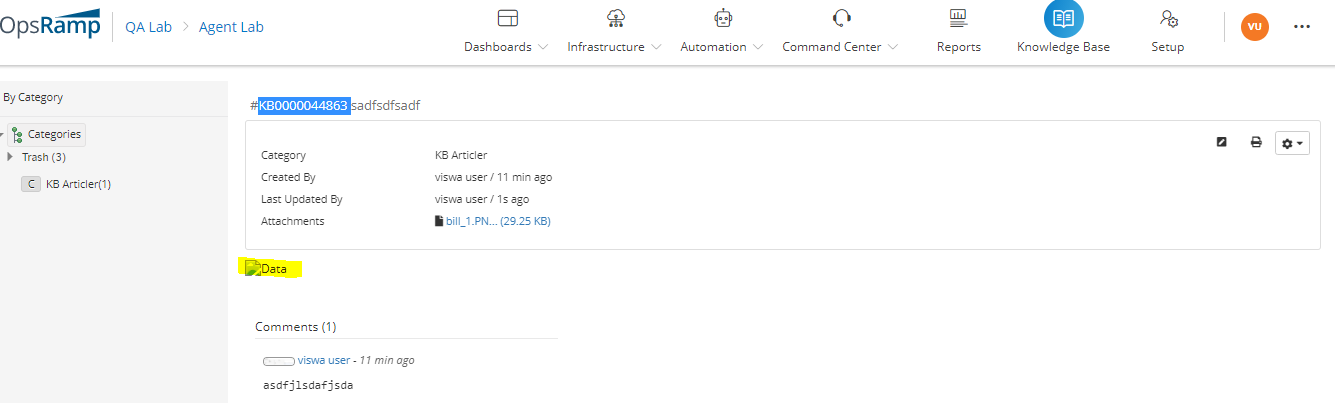
Issue is fixed. Images are loading now.
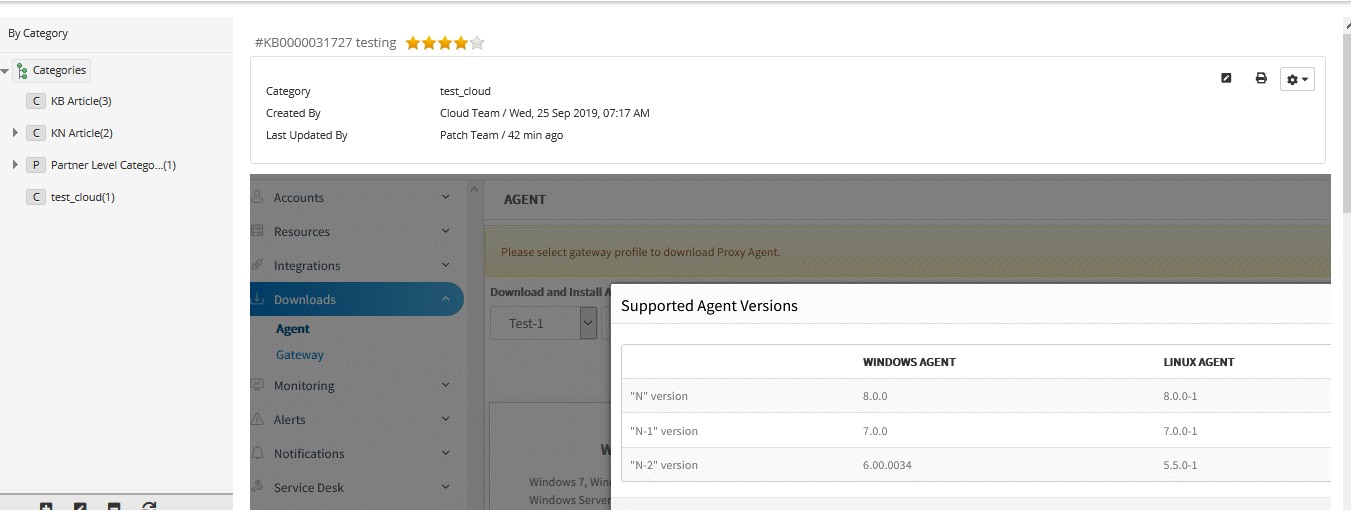
Image is loading in KB article
Classic Gateway
Garbled characters in SNMP Trap
An alert processed by SNMP Trap is garbled.
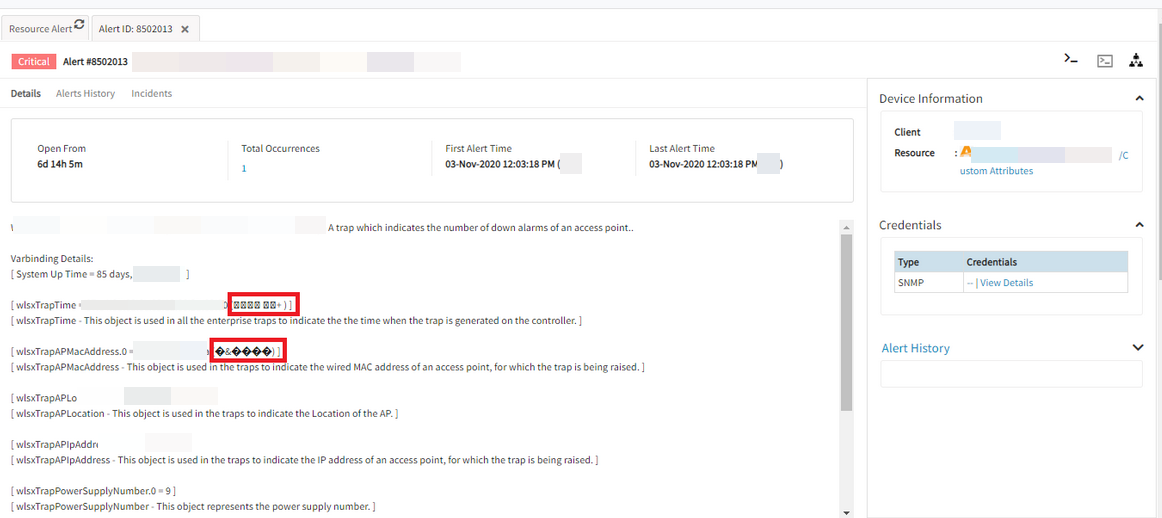
Garbled characters in SNMP Trap
Introduced a new value for dataType field in varBindDefinitionNO table, DATETIME.
Issue is fixed.
Cisco devices reporting as “Other”
The Cisco devices are reporting with Make, Model and OS details as “Other/Unknown”. Able to perform SNMP walk on the devices. The sysDescr and sysObjectID are providing data and not showing Null.
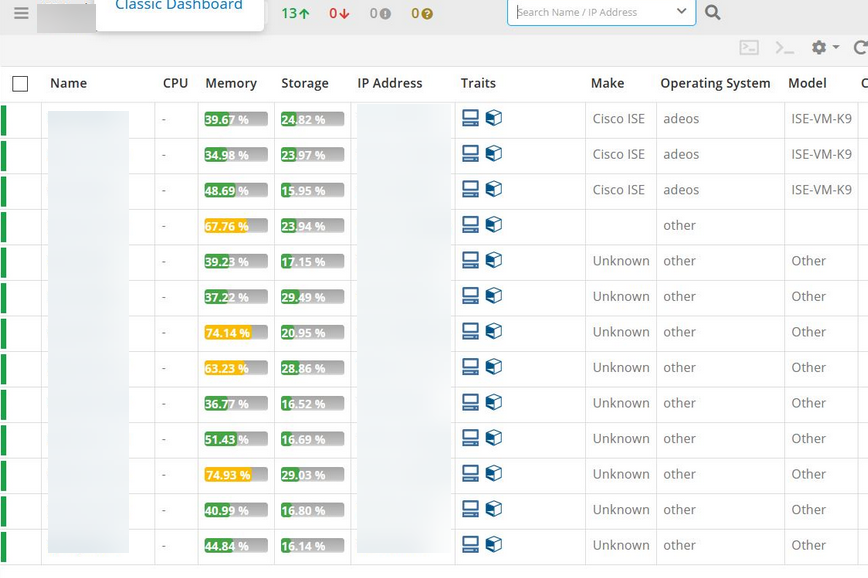
Devices are reporting with Make, Model and OS details as Other/Unknown
The credential added to the device does not match with the credential in the Discovery Profile.
Credentials in the Discovery Profile
Credentials added to the device
Unable to do the SNMP walk.
Customer has added the correct credential. The devices are reporting with the values perfectly.
Clustered Gateway
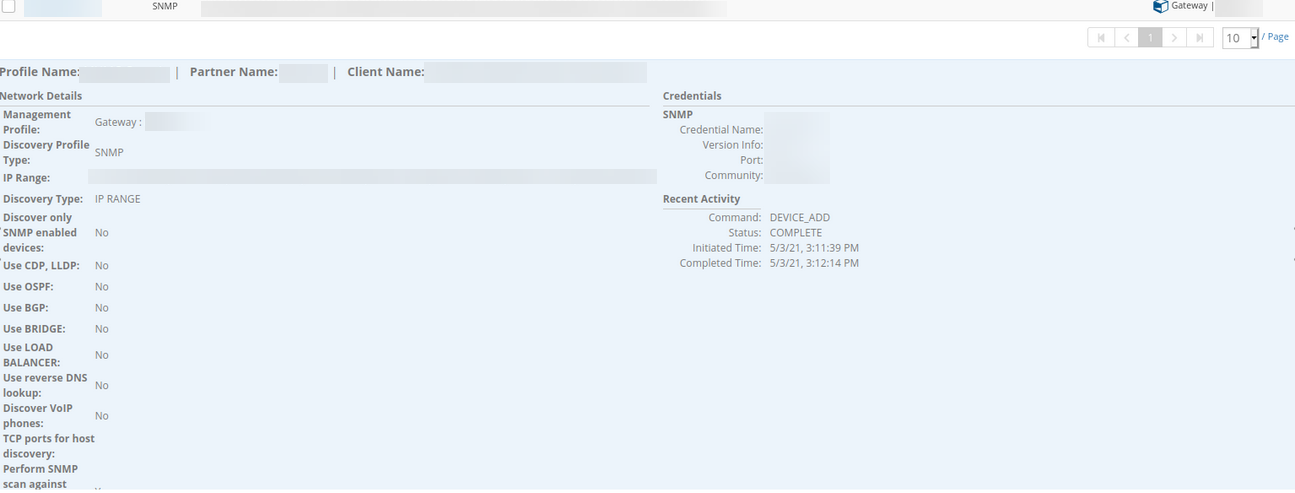
SNMP discovery is not showing results
SNMP discovery is not showing results
Device discovery is not getting completed due to timeout issue. ‘Nmap’ is configured to 15000 ms and devices are taking longer than 25000 ms to complete the same Nmap scan when done manually.
As some devices take more time to respond, increased the timeout. Issue is fixed.
Able to discover the devices.
Integrations
Roles do not appear in Integration
After creating custom integration and selecting Monitoring as Category, unable to select Roles.
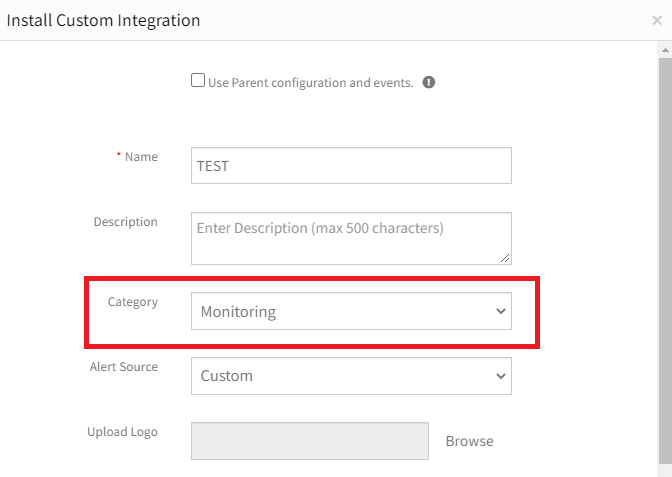
Select Monitoring as Category
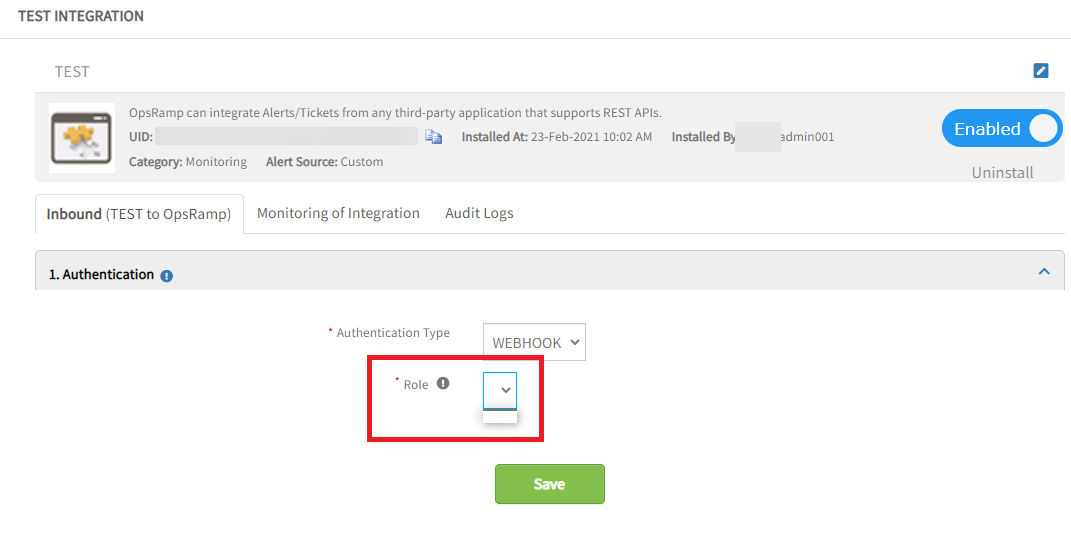
Unable to select Roles
In DB the opsramp_api_user and also the roles are against service_provider, but loading the roles against the solution_provider, so getting empty values.
Issue is fixed. Loading the roles based on organization id which is against the opsramp_api_user.
Able to select Roles.
AWS Integration failed
After integrating an AWS account using the IAM AssumeRole and External Id, the resource scan failed with the “Scan Failed Access key ID cannot be blank.” error.
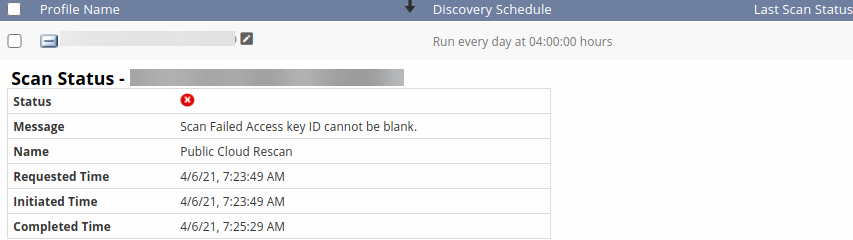
Resource scan failed
While creating AWS integration with external ID, getting “LazyInitializationException”. Fixed it. Also there is configuration issue. Issue is fixed.
Integration is getting installed successfully.
Import Adapter Configuration Metrics Issue
Adapter Metrics Configuration is not allowing to Import if there is no warning value. It is displaying a message, “Failed to import adapter configuration metrics data”.
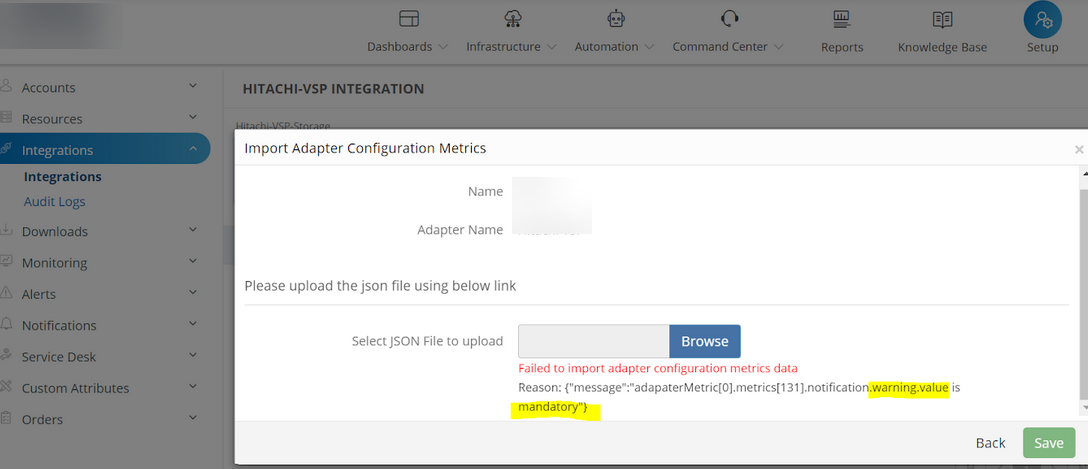
Adapter configuration error message
As per design, Warning Operator, Warning Threshold, Critical Operator and Critical Threshold values are mandatory in adapter install integration payload. Customer does not have Warning Threshold value for few metrics, when importing the adapter metrics.
Issue is fixed. Made the Warning/Critical threshold values as optional instead of mandatory in installed integration API. Both the warning and critical threshold values cannot be empty. The user has to input 1 value at least (either warning or critical).
Import Adapter Configuration Metrics is accepting even if warning threshold value is not given.
Remote Consoles
Wrong JP keyboard layout through remote console
When connecting through (RDP) remote console, some keys in JP keyboard layout are not correct.
On host device, the actual layout is like this:1234567890-^\qwertyuiop@[asdfghjkl;:]zxcvbnm,./\
For the same device, when connecting to RDP console, it is like this:1234567890-&]qwertyuiop"asdfghjkl;+{ zxcvbnm,./]
Issue is fixed. The layout is displayed properly in the Japanese keyboard.
Partner level dashboard is showing as No Data Available
After logging in to multiple devices in OpsRamp for different clients, the Active Console widget on Partner level Dashboard is showing “No Data Available”. Also validated using Java Based RDP, but still the Active Console information is not populating on the dashboard.
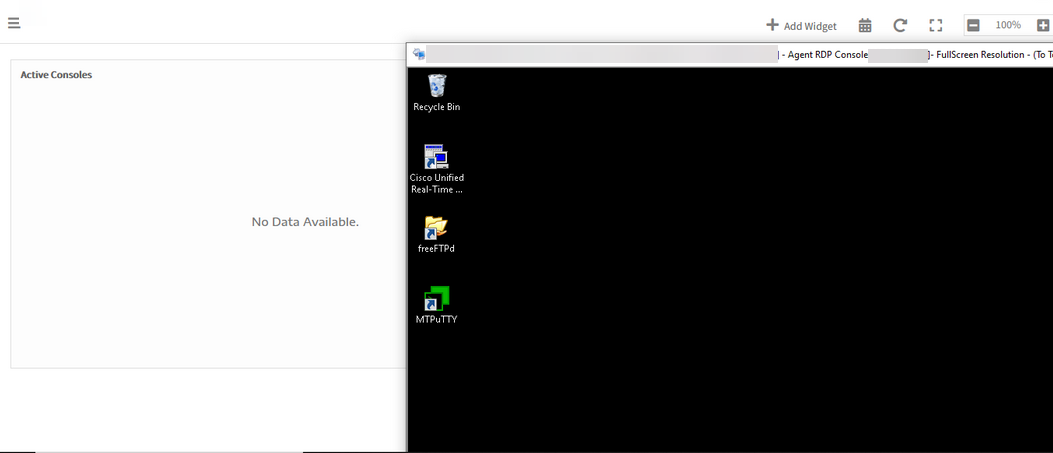
Active console widget on Partner level dashboard shows No Data Available
There should be active consoles at the client level to validate the Active console widget at the partner level. The consoles have to be launched to see the data on the widget.
Due to Java EOL, removed support for JNLP earlier. Now java consoles are made available.
Whoever has JNLP consoles enabled, they will be able to get active consoles widget support for JNLP. If they launch consoles for different devices using JNLP and web console, then they can see both JNLP and web console icons on the widget.
Can see both JNLP and web console icons under the widget
Issue with Audit recording
Audit recording is not working as expected.
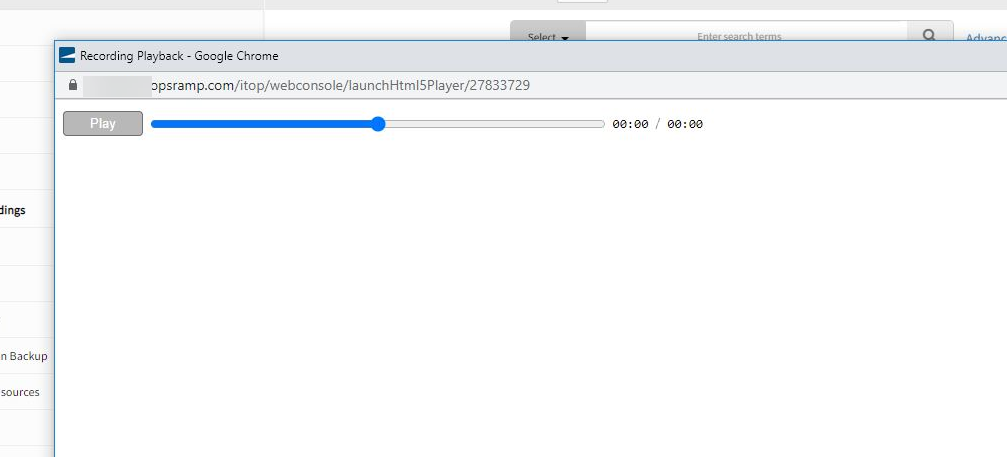
Audit recording is not playing
Guacd and consolegrid process graphs are showing down during this recording period. The guacd service is down at this time. There is maintenance happening during this time period.
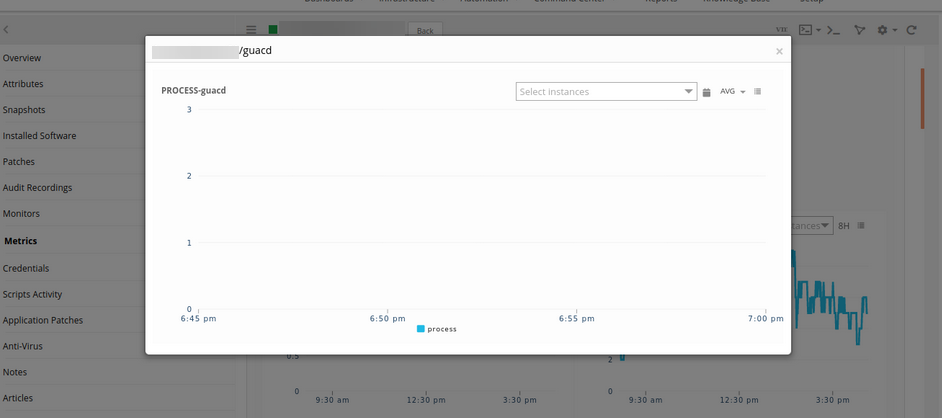
Guacd process graph is showing down
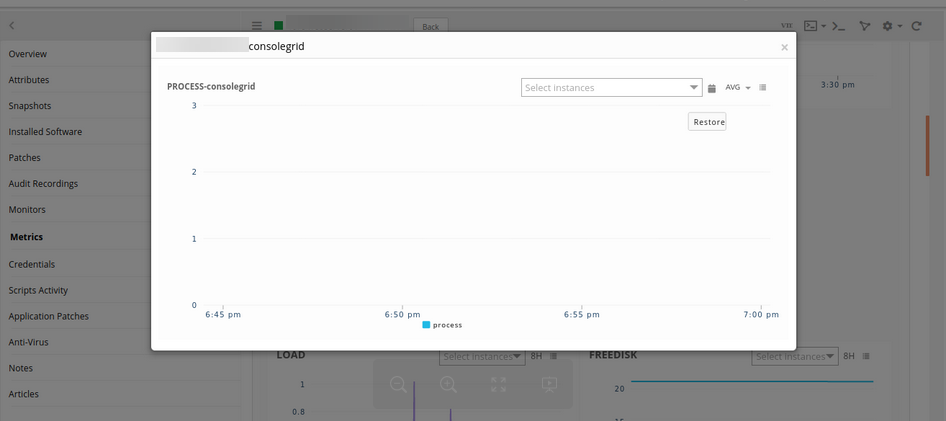
Consolegrid process graph is showing down
There is no /opt/datastore/ mount path in the pod web console node2, after the node is created.
Issue is fixed. Able to get audit recordings from both the nodes.
RDP to SWF and CLI Recording Search features are removed
The following features are disabled:
Converting RDP to SWF
Converting RDP to SWF uses abode flash player, which is deprecated. It requires more computational power and setup to convert every recording into SWF.CLI Recording Search
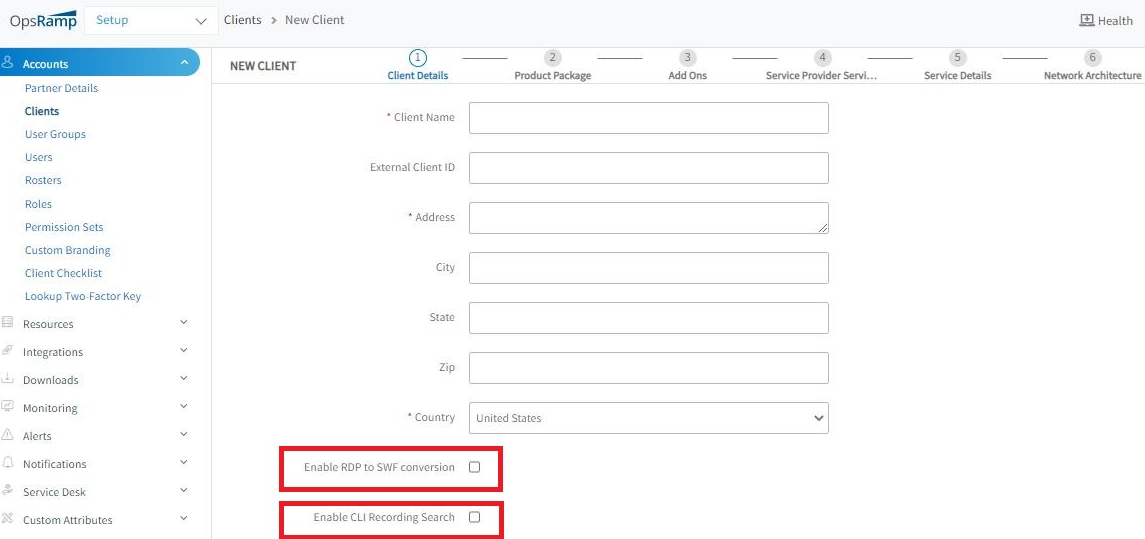
These features are deprecated
From this release 9-0-0, these features will be deprecated from the UI (removed them from add/edit client pages), so they will not be in use.
Issue with RDP consoles
Issue with the RDP consoles for both Java and Browser based. Encountered null pointer exception with 0005 error code, on a specific day for 3 hours. After that all consoles are connecting without any issues.
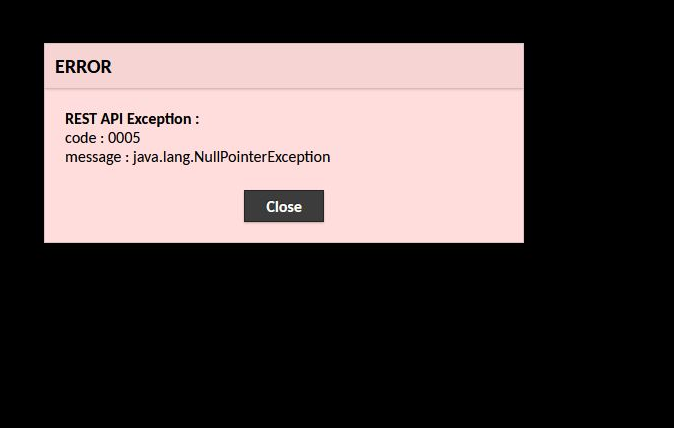
Issue with Browser RDP console
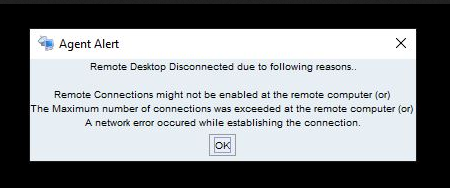
Issue with Java RDP console
It is a cache failure issue.
Refreshed memcache. Issue is fixed. The consoles are working perfectly.