Release Date: November 2018
Dashboards and User Interface
Inventory summary
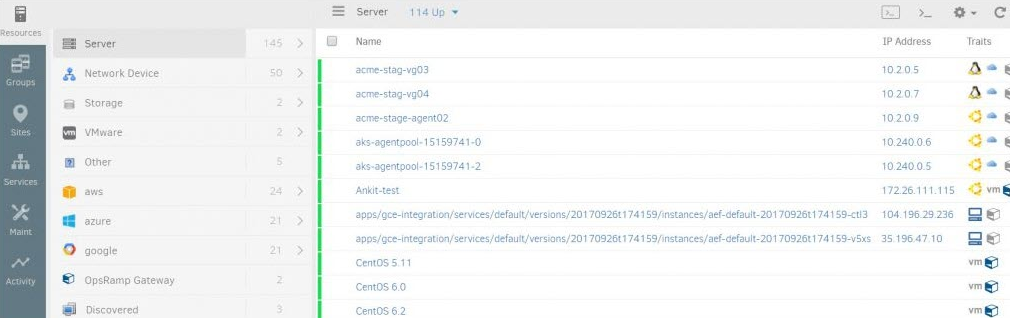
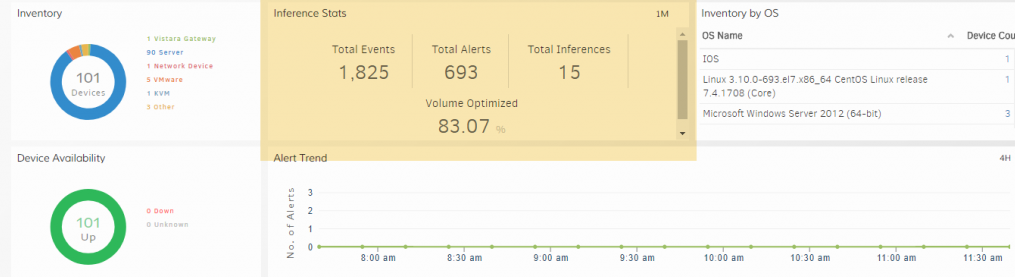
The Infrastructure (Beta version) page now shows an inventory summary:
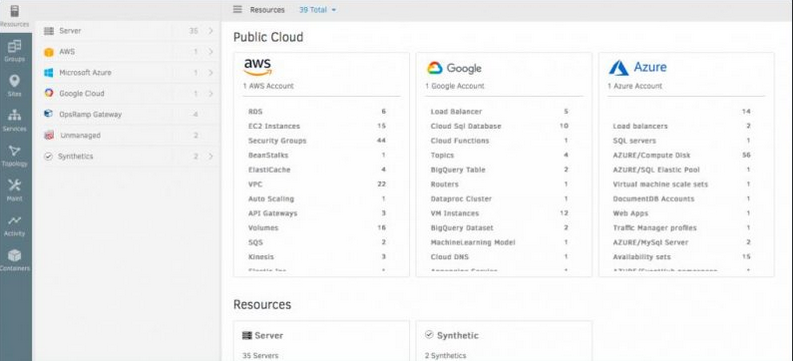
Inventory summary
Inventory summary
Consolidated resource attributes view
For each individual resource, a new tab Attributes is introduced to consolidate resource attributes, hardware or cloud information.
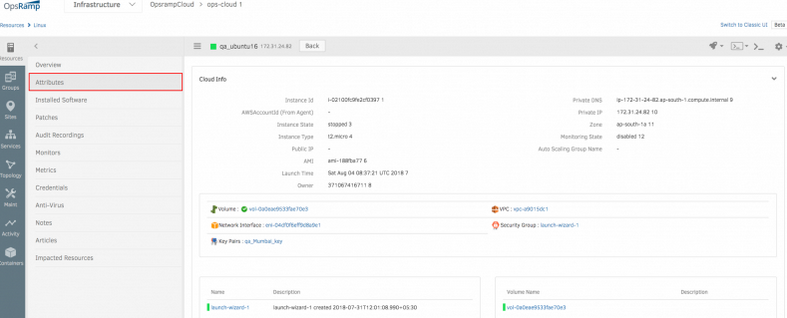
Consolidated resource attributes view
Enhancements to Geo-widget for dynamic loading/zooming capability, and to show availability summary status with click-on
Threshold rules are not working
Threshold rules are not working
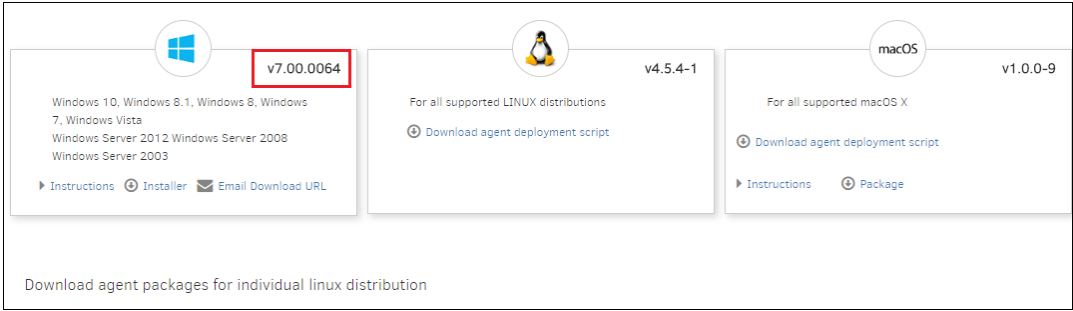
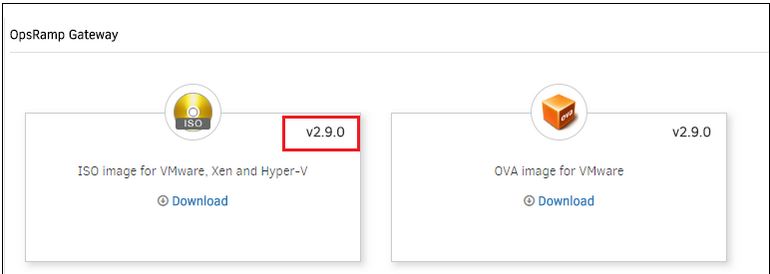
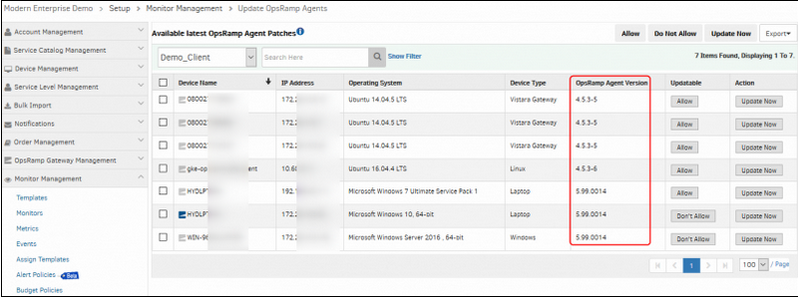
Display Build Number for Agent and Gateway
Now, user can see the latest version number tagged on Agent and Gateway available for download in OpsRamp Portal.
Display Build Number for Agent and Gateway
Display Build Number for Agent and Gateway
Display Build Number for Agent and Gateway
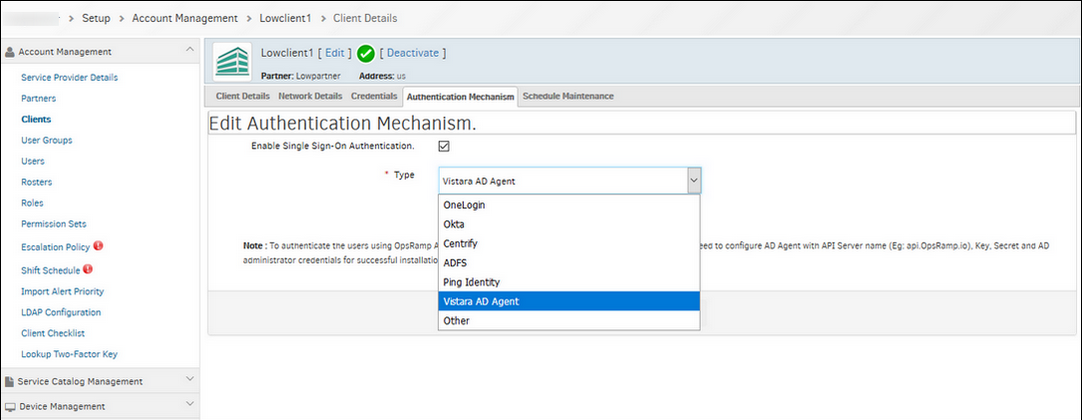
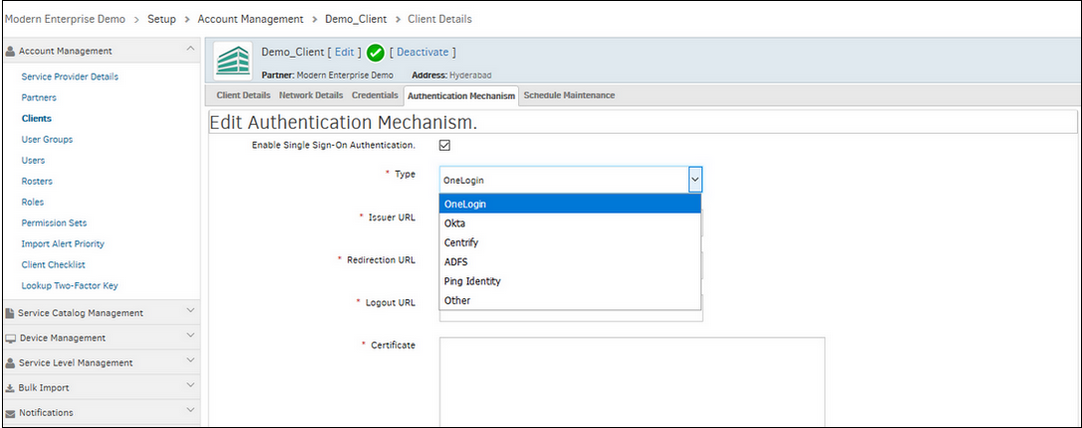
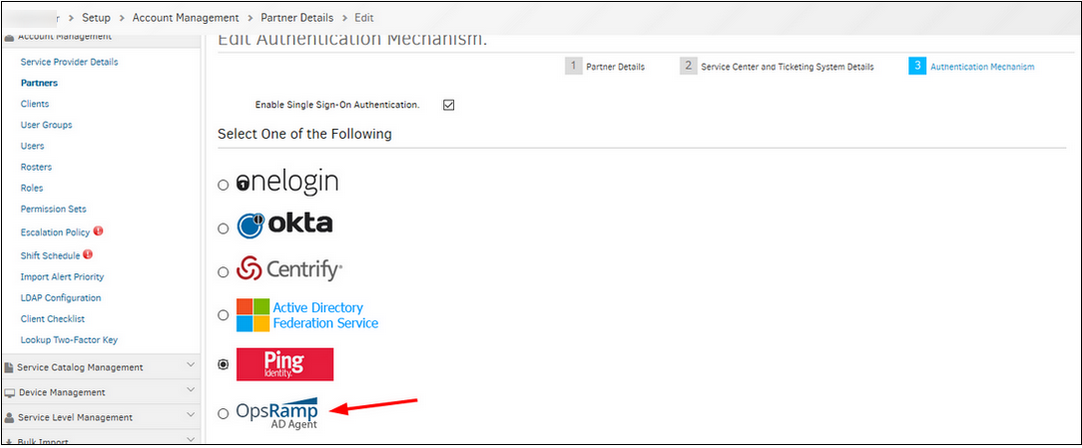
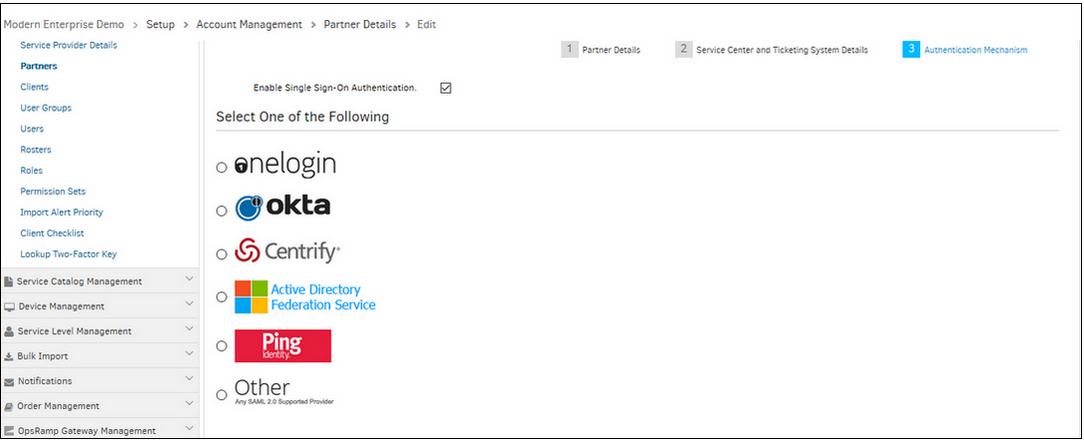
Removed SSO-AD Agent method option from Partner and Client setup pages
Removed SSO-AD Agent method option
Removed SSO-AD Agent method option
Removed SSO-AD Agent method option
Removed SSO-AD Agent method option
Removed SSO-AD Agent method option in authentication sections from Partner and Client setup pages.
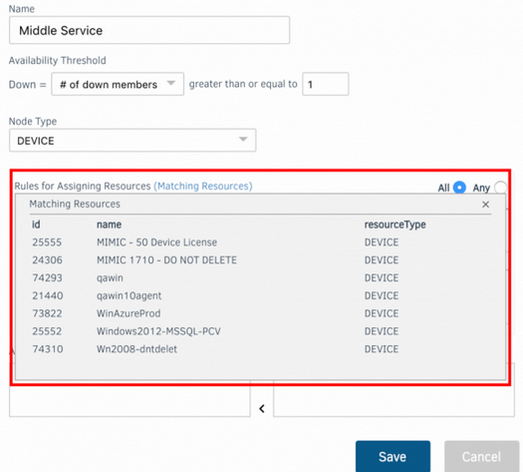
Added Matching Resources section for dynamic rules in new service maps UI
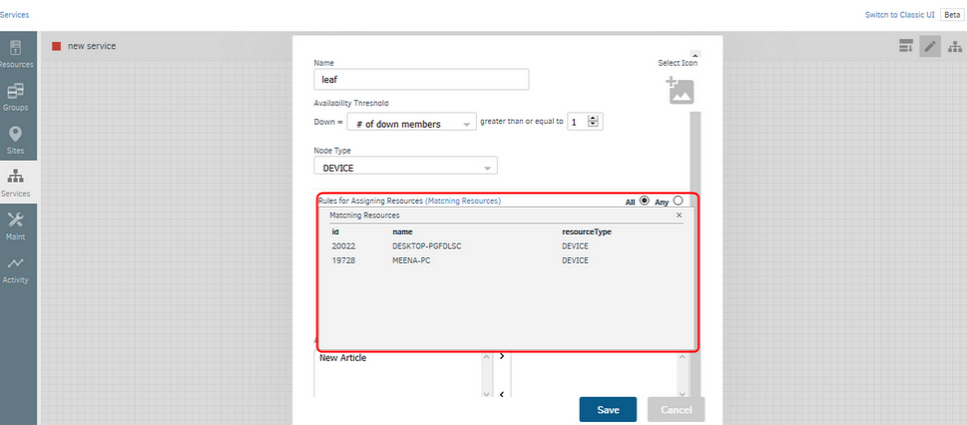
Added Matching Resources section for dynamic rules
The resources that match the filter criteria are displayed on clicking Matching Resources.
The New Infrastructure Overview page shows a list of upcoming maintenance windows for a resource
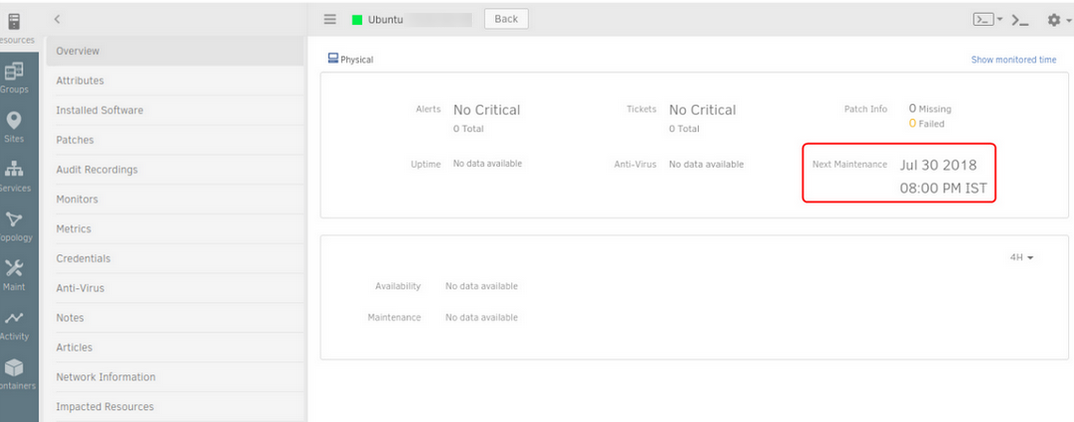
List of upcoming maintenance windows for a resource
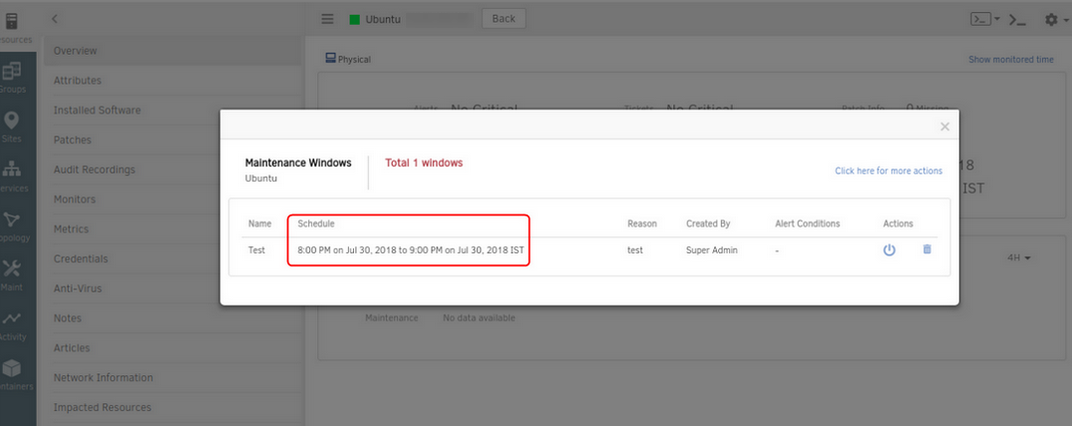
List of upcoming maintenance windows for a resource
The WSUS icon is displayed on the Overview page for Windows devices when the device is WSUS enabled
The WSUS icon is displayed on the Overview page
The WSUS icon is displayed on the Overview page
When device is WSUS enabled, the respective icon is displayed on the resource list and on the Overview page of the device. This device must be a Windows device.
LDAP configuration option is not supported
The LDAP configuration option is removed in all the logins.
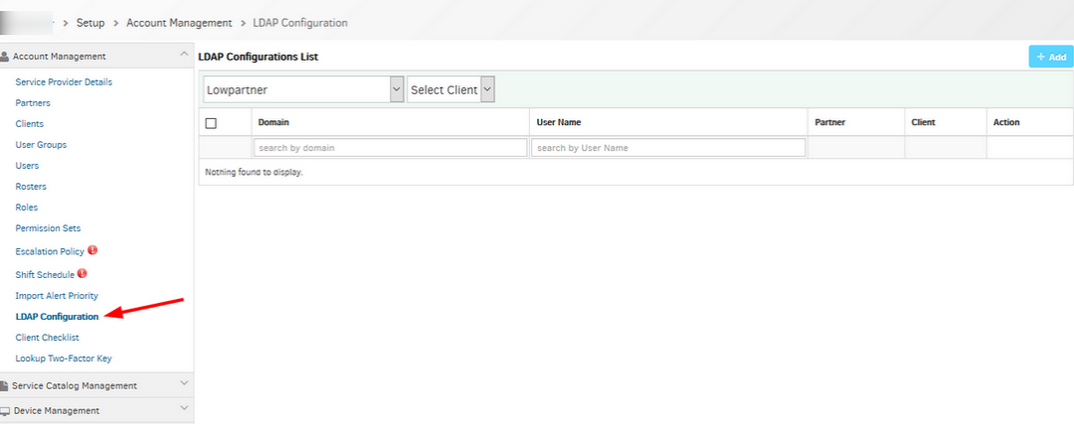
LDAP Configuration option is not supported
New Widgets
This release now includes three new widgets:
- Geographical distribution: The new Global Assets widget shows a geographical distribution of your IT assets. This includes assets in your data centers as well as on the cloud.
- Cloud spend to date: The new Cloud Cost Insights widget shows spend on public clouds to date. You can view a breakdown on spend by cloud account, by custom attributes (example, denote business units) and other attributes.
- Cloud spend trend: The new Cloud Cost Trend widget shows a trend of spend on public clouds over time. You can view trend by resource type, custom attributes, and other attributes.
These widgets are available at the Partner and Client levels.
New Dashboard for Cloud
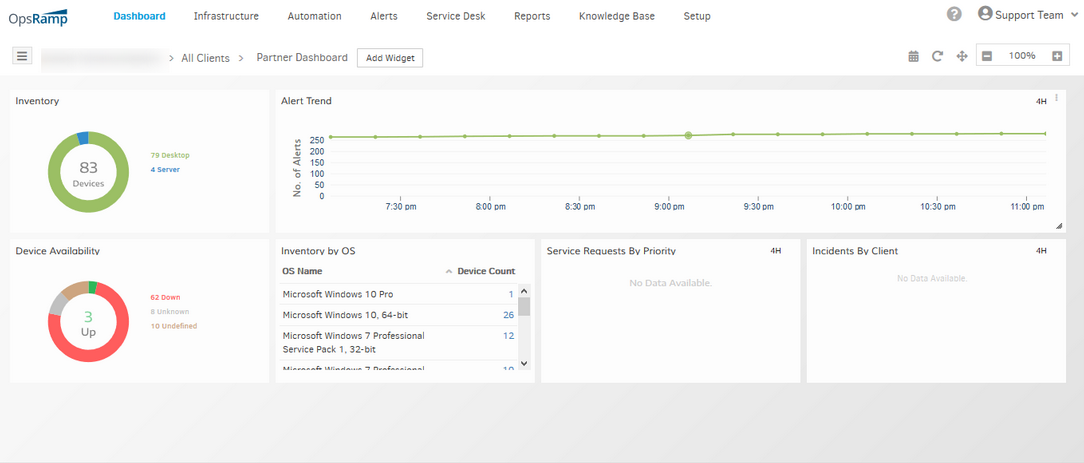
A new shared dashboard is now automatically created for partner and client users if you have any public cloud integration configured. This new Cloud Dashboard comes with the new cloud widgets to give you overview of your cloud assets and spend.
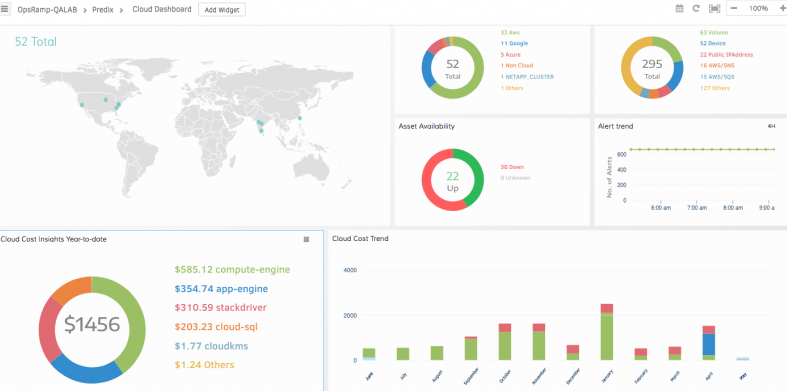
New Dashboard for Cloud
New Infrastructure Navigation UI (Beta)
This release brings a new UI to navigate through your resources, device groups, sites and service groups. The new UI offers:
- A new and modern look and feel
- A flattened navigation model that is more intuitive and scales to large inventories
- Customizable column ordering for device listing pages
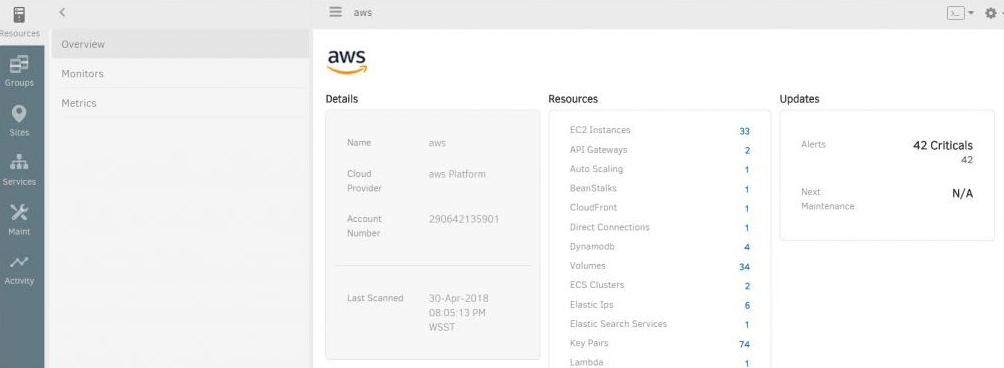
- Inventory summaries for public and private clouds
- Vertically laid out details tabs for each resource that are easier to locate
New Infrastructure Navigation UI (Beta)
New Infrastructure Navigation UI (Beta)
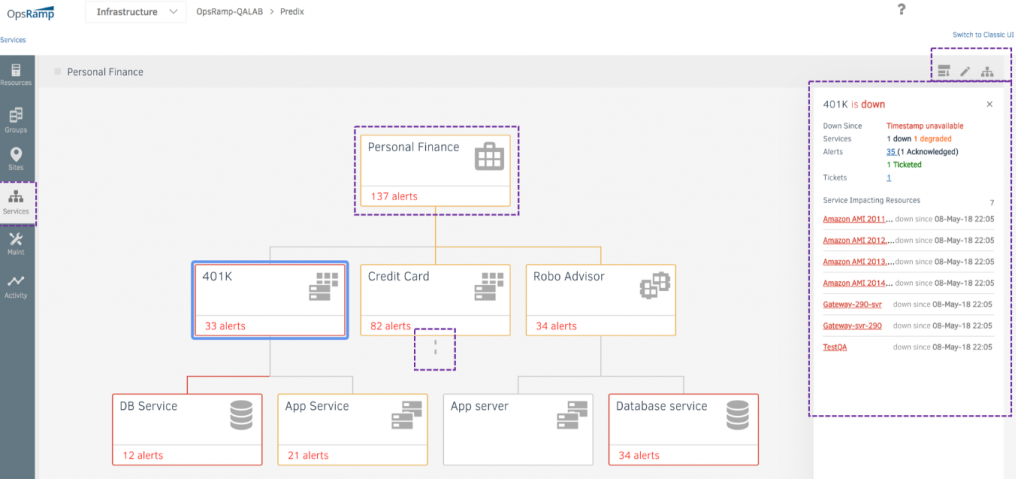
New Service Groups (Beta)
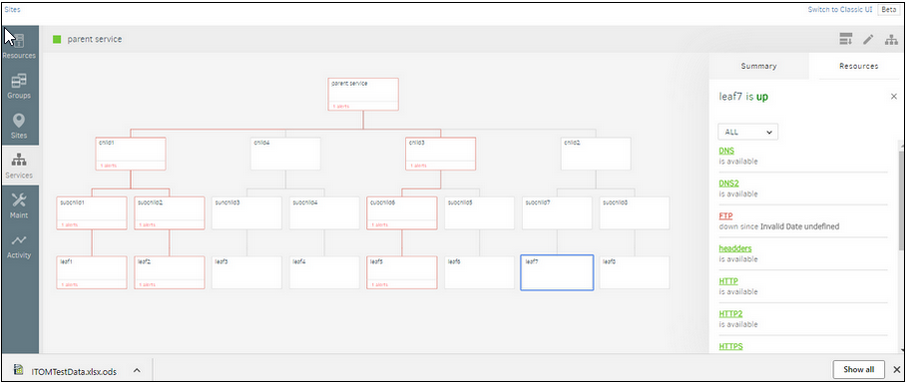
This release brings new and improved version of service groups. The new version of service groups provide a faster and easier way to organize, visualize and monitor the managed resources:
- Get a simplified line-of-sight between an IT service and resources impacting its availability
- Create and configure service groups from a new simplified UI
- View all relevant information about a service’s availability in one place
- Associate service with icons to easily identify key services
New Service Groups (Beta)
Note: Existing service groups defined in your account will continue to function unchanged. The new service group feature will continue to be in Beta over upcoming releases and will replace current service groups in a future release.
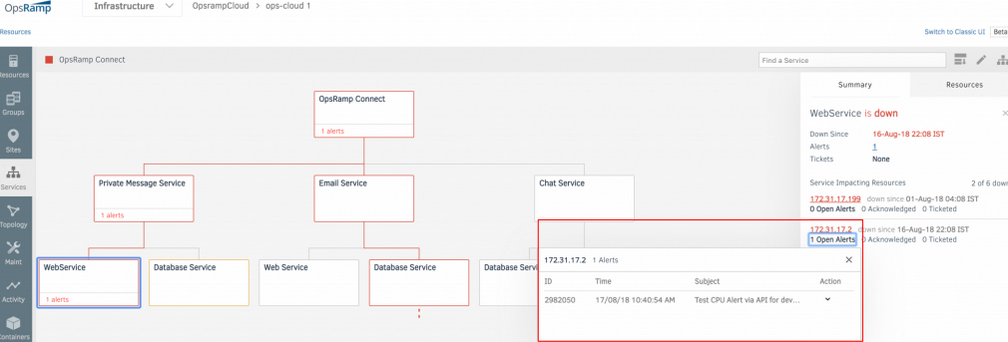
Clicking on the Open Alerts count in Summary tab of Service Maps shows same alerts for all Devices across all Partner/Clients
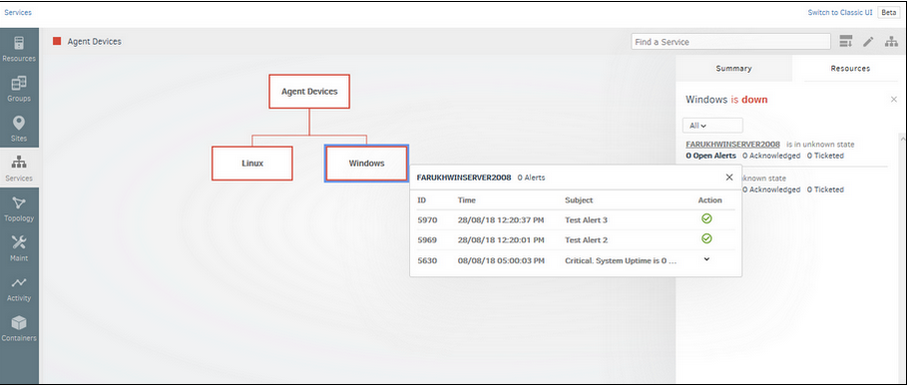
Clicking on the Open Alerts count in Summary tab of Service Maps shows same alerts for all Devices across all Partner/Clients
Alerts are displaying correctly
Issue is fixed. Alerts are displaying correctly for all devices across all the partners and clients.
Threshold rules are not working on the New service maps
Created a service map with 3 levels and applied the availability rule on them The Availability rules are not getting applied for the services.
Threshold rules are not working
Issue is fixed. The threshold rules are working correctly in the New Service maps.
Inconsistent Discovery Time
Discovery profiles are set to 1:00 PM, however, the GUI shows the time of execution as 9:00.
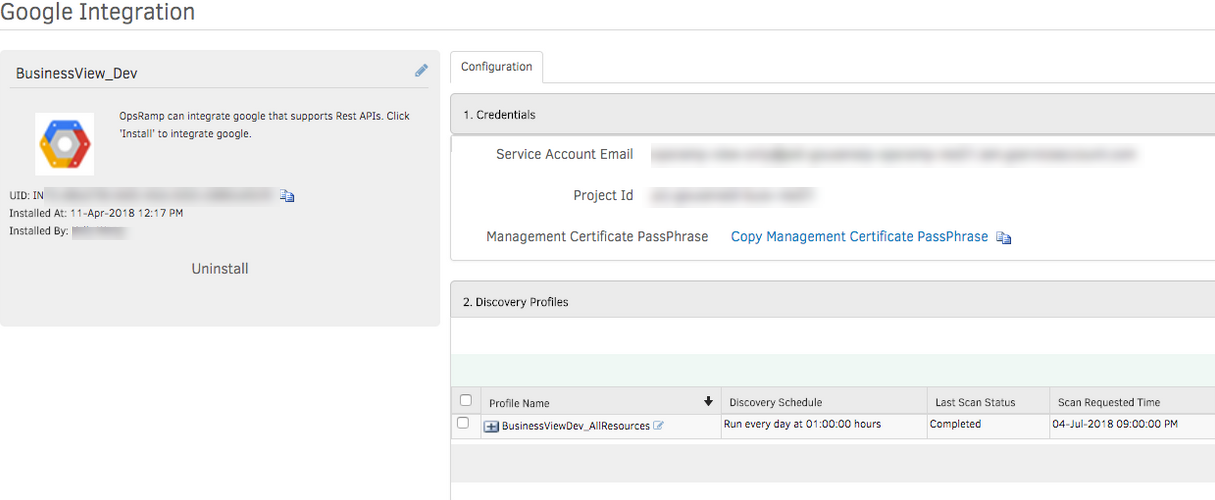
Inconsistent Discovery Time
Found this is happening with timezones where daylight savings take effect. Here the time was recorded as EDT, and unable to recognize this as EST, and hence it is running by default in GMT. Basically some of the timezones code has changed.
Taking client timezone to run discovery schedule job. Taking client timezone full string instead of codes and using it to schedule job.
Issue is fixed. Discovery time is showing perfectly.
Service Group
The following improvements are introduced in Service Groups to bring impact visibility and improved performance:
View alert within a service group
You can now see alerts impacting the availability of a service group within the service group and take these actions, in-place:
- Acknowledge
- Suppress
- Permanent Suppress
View alert within a service group
Impacted services within Alert details page
Impacted Service Groups attribute is introduced to assess the impact on a business service by a Down resource.
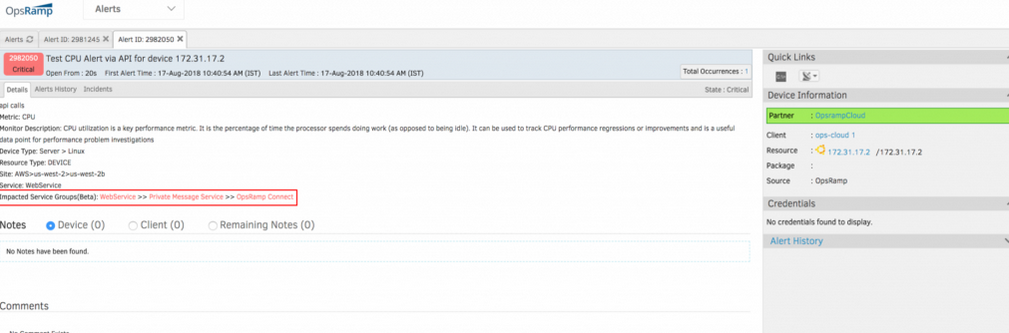
Impacted Service Groups attribute is introduced
Note: Impacted service groups are linked to access service groups page.
Matching resource preview in configuration page
Users can use Matching Resources preview in the Service Group configuration window to preview resources that match the filter criteria before adding them to a service group.
Matching resource preview in configuration page
Import feature to add existing service groups to new service groups
Import Service group feature allows user to import commonly used service groups into other newly created or existing service groups. For example, if a user wants to monitor active directory business service which is part of multiple larger services, they can create this service once and use Import feature to import active directory service into multiple different services groups. This simplifies and reduces the time needed to create a service group.
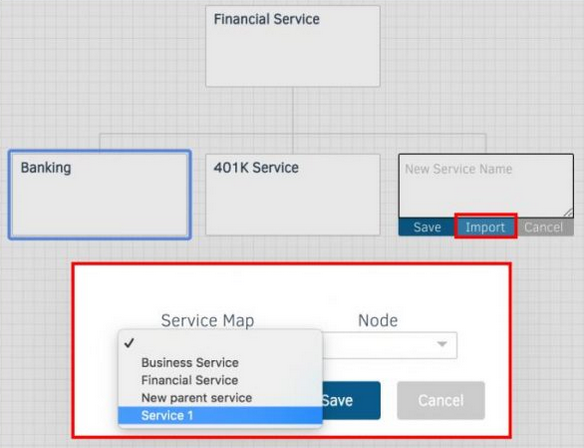
Add existing service groups to new service groups
Note: The new service groups will continue to be in Beta over the upcoming release and will replace current service groups in a future release.
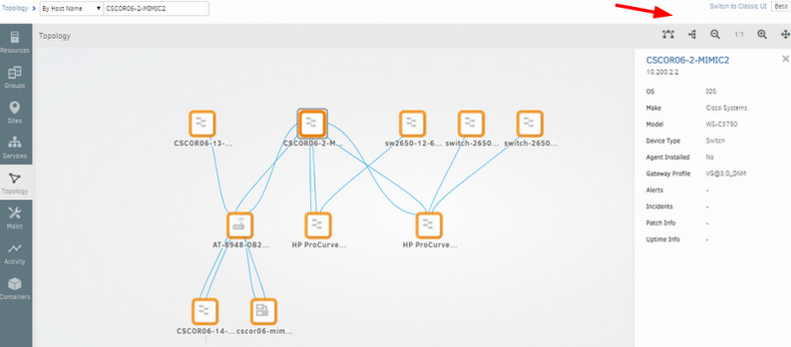
Topology Explorer (Beta)
Topology Explorer introduces dynamic Network and Application dependency mapping.
Network dependency mapping
Dynamically plot network dependency maps for any resource that has LLDP, CDP or SNMP protocols enabled. User can visualize these maps in Topology Explorer UI by providing a seed IP address or a hostname.
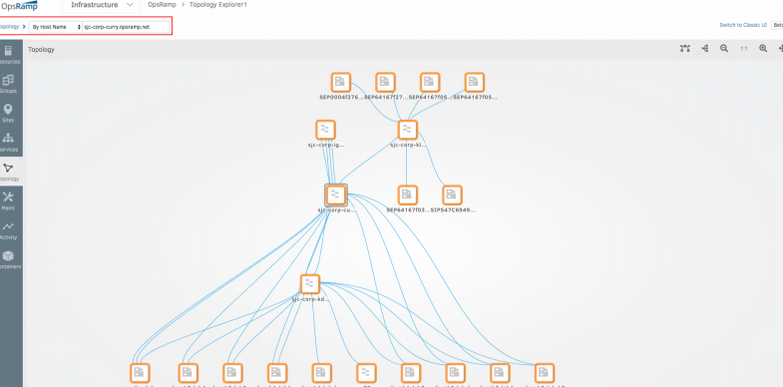
Network dependency mapping
Application dependency mapping
Users can dynamically discover and visualize dependencies for supported applications by providing application name in the Topology Explorer UI.
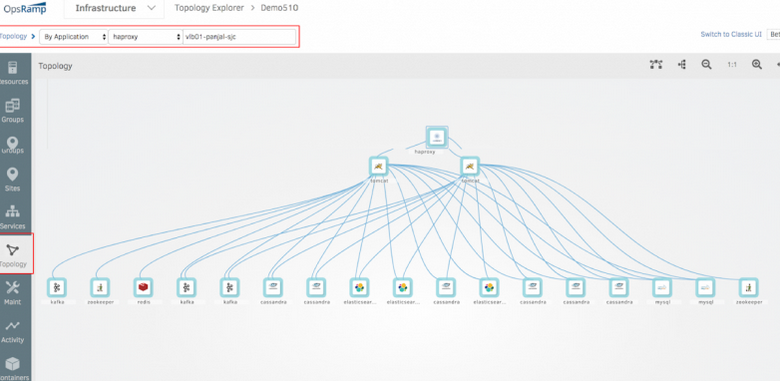
Application dependency mapping
Availability
Undefined – as a new Availability State
Undefined is a resource state that is introduced to differentiate between a resource not being monitored and a resource not collecting data (Unknown State). The following improvements are added in this release:
- Infrastructure UI, Dashboards, Widgets, and Reports are updated to reflect the new Undefined state.
- Default availability state is now Undefined. Metrics such as Agent status, Tunnel Status, Cloud Instance state, and Ping are availability metrics by default.
- Current resources without availability metrics will be moved to Undefined State.
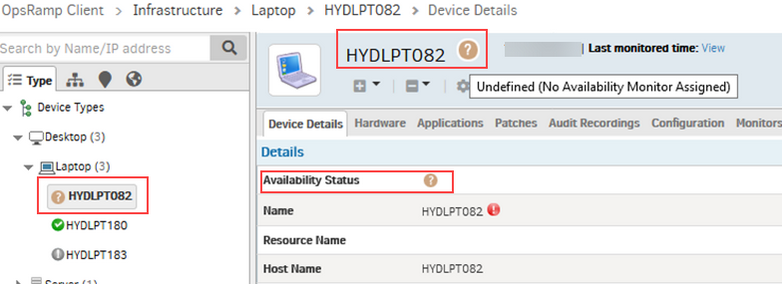
Undefined – as a new Availability State
- Availability widget is enhanced to show availability metric information.
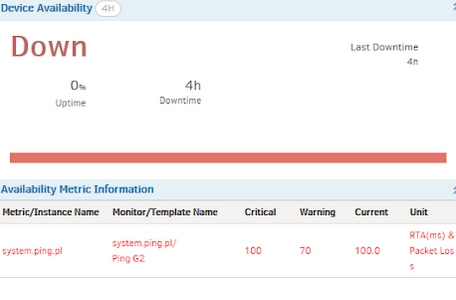
Availability widget is enhanced
New functionality (Availability Settings option) has been provided
New functionality (Availability Settings option) has been provided to define Resource Availability status during a Scheduled Maintenance Window.
The user can now choose the Resource Availability Status as Current (Default), Up, Down or Unknown for those Resources which are being set in Maintenance Mode. This can be set at any level i.e., Service Provider, Partner or Client.
The user can define the resource availability status on the ‘Client Creation’ or the ‘Edit Client’ pages.
- The user selects the Resource Availability Status as Current (Default):
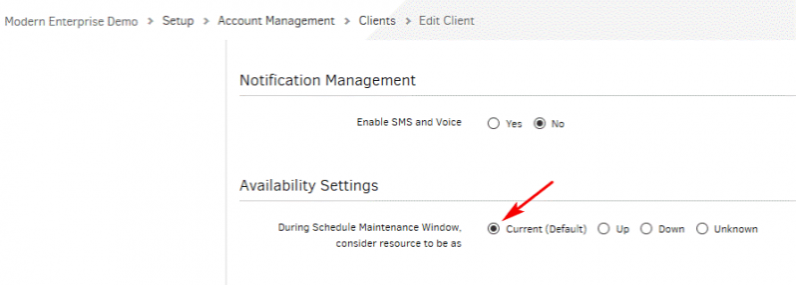
The user selects the Resource Availability Status as Current (Default)
The user creates the Client Schedule Maintenance period, which can be seen on the Schedule Maintenance List page.
The Infrastructure page shows all the devices with the Current availability status.
The Infrastructure page shows all the devices with the Current availability status
- The user selects the Resource Availability Status as Up:
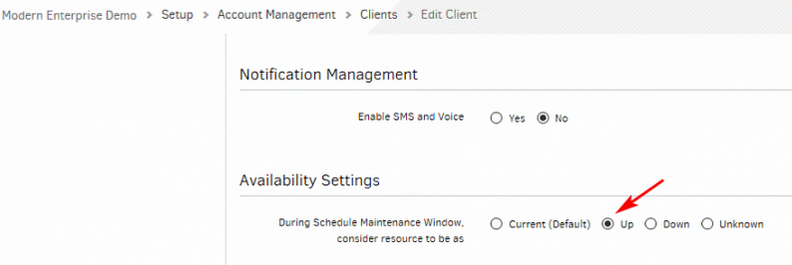
The user selects the Resource Availability Status as Up
The Infrastructure page shows all the devices with the availability status as Up, irrespective of the actual status of the devices.
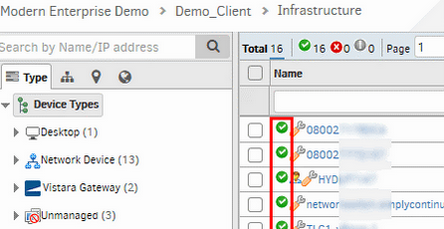
The Infrastructure page shows all the devices with the availability status as Up, irrespective of the actual status of the devices
- The user selects the Resource Availability Status as Down:
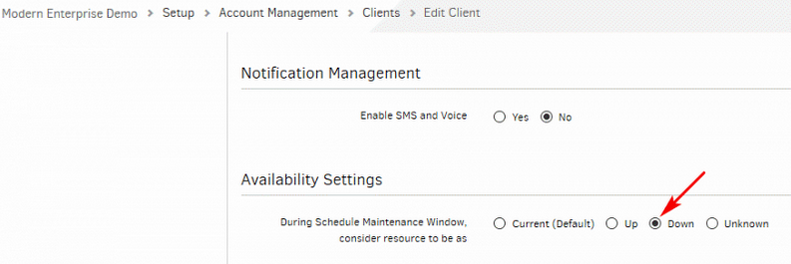
The user selects the Resource Availability Status as Down
The Infrastructure page shows all the devices with the availability status as Down, irrespective of the actual status of the devices.
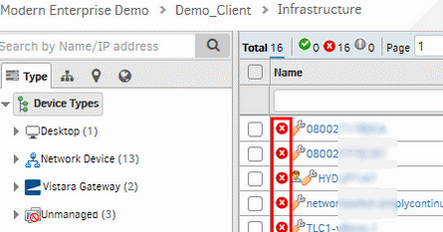
The Infrastructure page shows all the devices with the availability status as Down, irrespective of the actual status of the devices
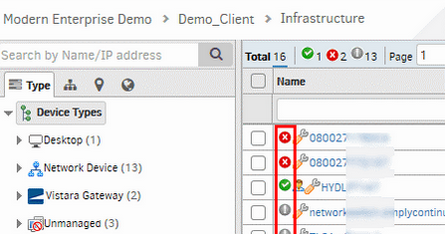
- The user selects the Resource Availability Status as Unknown:
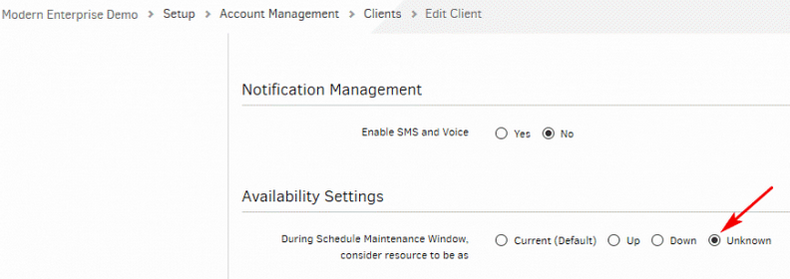
The user selects the Resource Availability Status as Unknown
The Infrastructure page shows all the devices with the availability status as Unknown, irrespective of the actual status of the devices.
The Infrastructure page shows all the devices with the availability status as Unknown, irrespective of the actual status of the devices
Synthetics
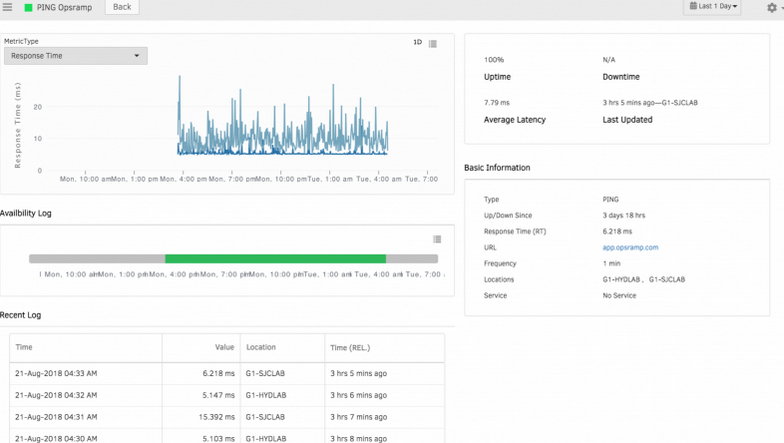
Improved synthetics overview
The synthetics page now has an improved layout to bring together key information into a single page.
Improved synthetics overview
Port field is accepting negative values while creating/editing synthetic monitor
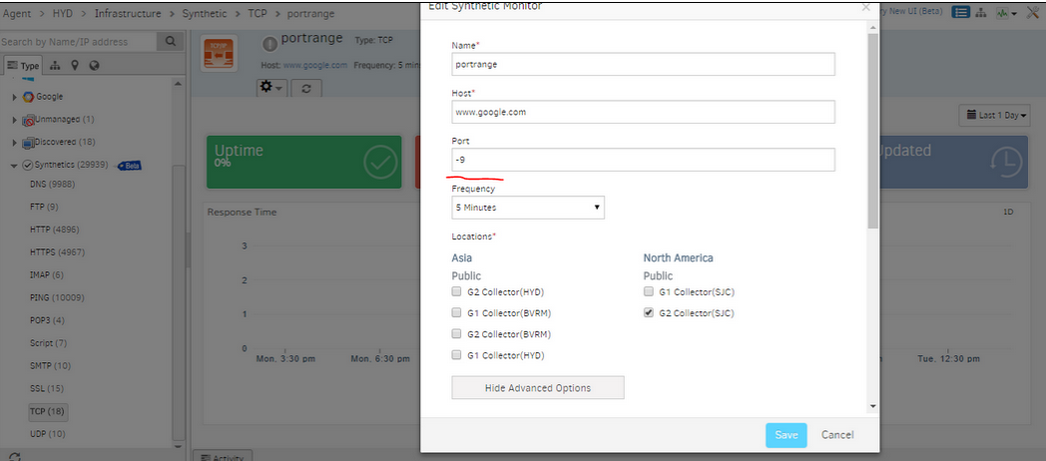
Port field is accepting negative values
Issue is fixed. Validation is provided for the port field so that only valid port number can be entered.
Email Round-Trip Time Monitor
A new synthetic monitor RTT (Email Round-Trip Time) is introduced to monitor the end-to-end functionality of your email server to ensure the transmission and reception process of email is functioning properly.
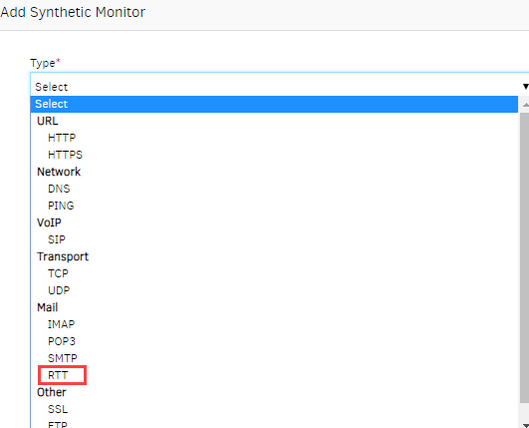
Email Round-Trip Time Monitor
Public and private locations
User can perform synthetic monitoring from public and private locations.
Public locations
OpsRamp has now extended public locations for synthetic monitoring. Below table shows the public locations supported by OpsRamp:
| Asia Pacific | Europe/Middle East | North America |
|---|---|---|
| Mumbai, India | Frankfurt, DE | Atlanta, GA, USA |
| Singapore, SG | London, England, UK | Dallas, TX |
| Fremont, CA, USA | ||
| New Jersey, NJ |
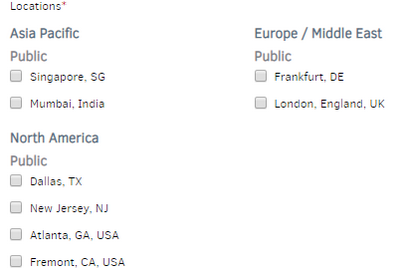
Public locations
Private locations
User can now perform synthetic monitoring through Gateway installed in their On-Premise location. Enable synthetic agent on Gateway. The Gateway management profile name appears as the On-Premise location name.
Note: Enabling of synthetic monitor on Gateway is available from Gateway version 3.1.0.
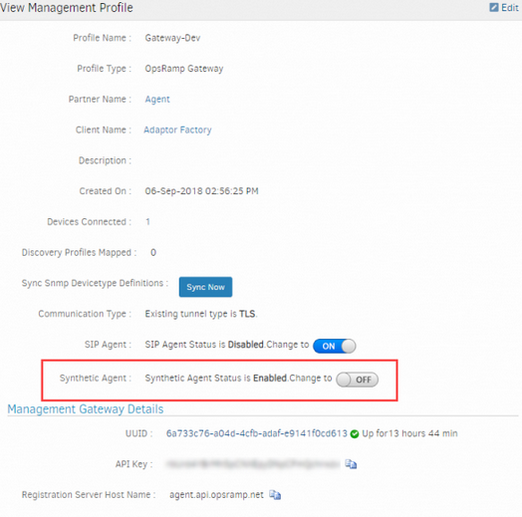
Enabling of synthetic monitor
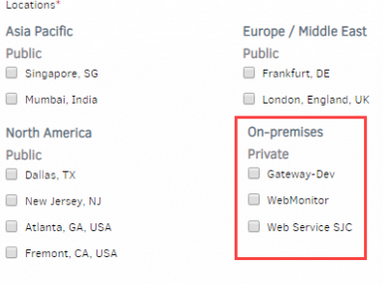
Private locations
Alert Management
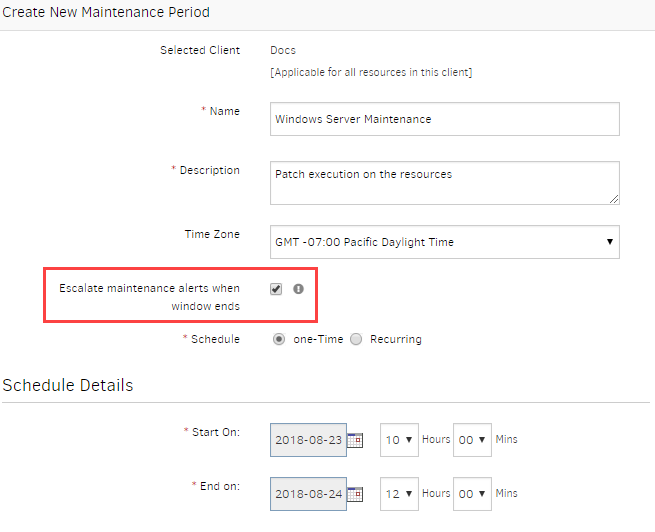
Escalate alerts after device maintenance
Users can now escalate maintenance alerts after a maintenance window is completed.
Escalate alerts after device maintenance
Escalation based on Alert state transition
Escalation policies can be configured to trigger on alert state transitions to Warning and Critical states.
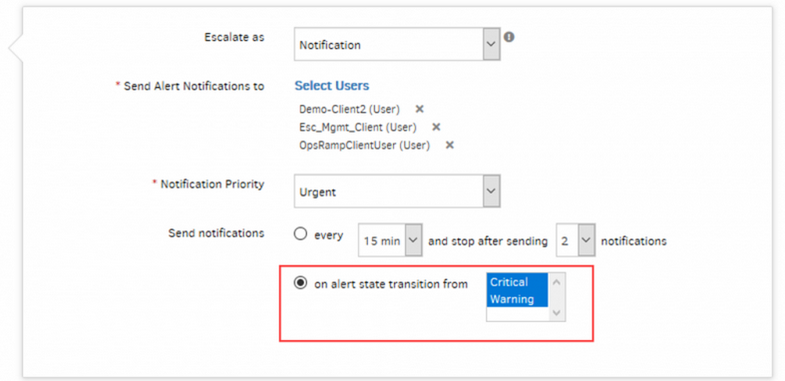
Escalation based on Alert state transition
Schedule Maintenance
Standing maintenance windows
You can now configure recurring maintenance windows without an end date.
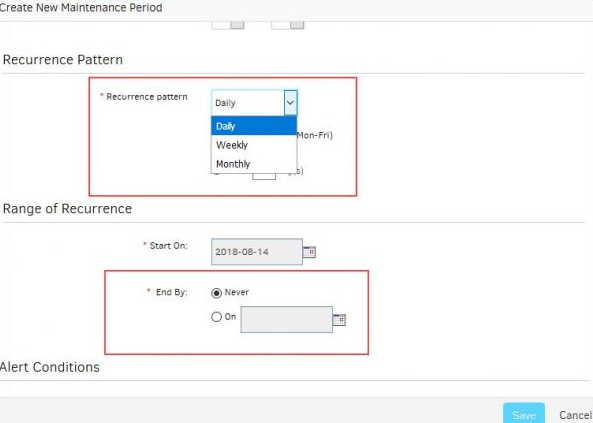
Recurring maintenance windows without an end date
Multi selection in Resource Types filter
You can now select multiple values for Resource Type filter in Alert Browser View.
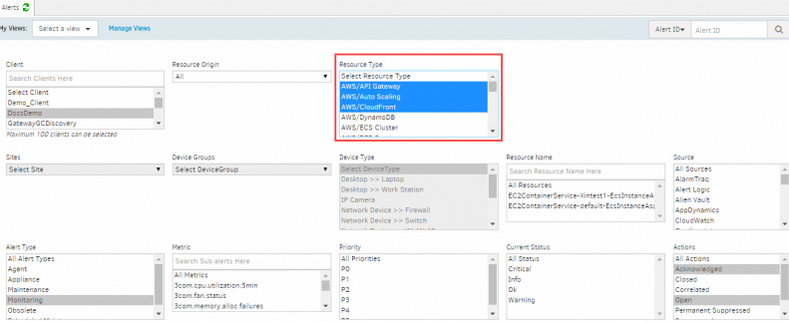
Multi selection in Resource Types filter
Sites and Device Groups selection is enabled only if Resource Type is ‘Device’, and the maximum resource type selection allowed is 10.
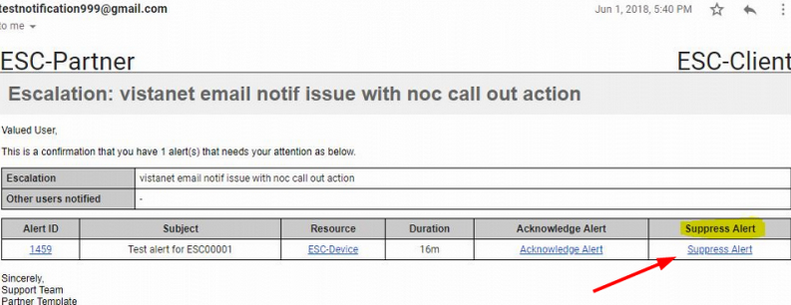
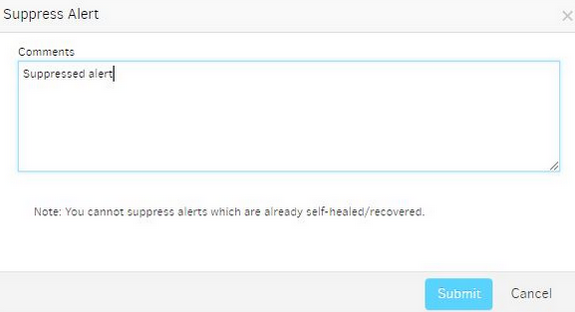
Token for Suppress action
You can now use Suppress Alert token in alert notifications template for suppressing the alert. An alert can now be suppressed by clicking the Suppress Alert link provided in the E-mail.
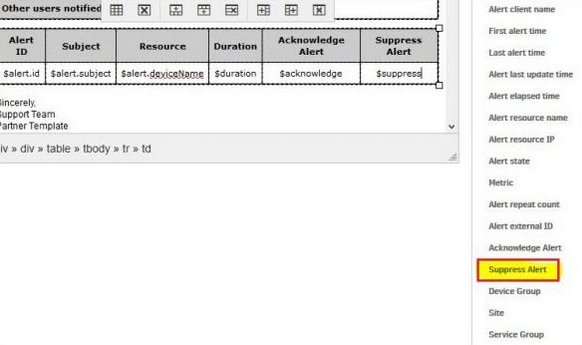
Token for Suppress action
Token for Suppress action link
Token for Suppress action
Recovery notifications
User will now get Problem or Recovery email notifications based on Alert state.
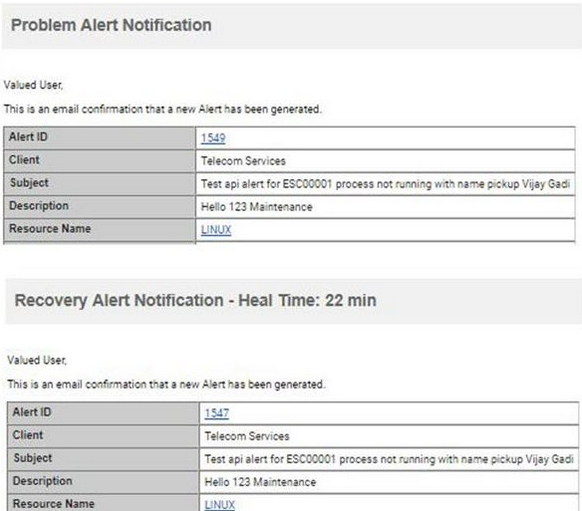
Recovery notifications
Renamed getAlert API payload from managedByVistara to managedByOpsRamp
Changed name Vistara to OpsRamp in variable names, Method names and references.
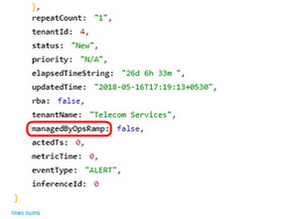
Renamed getAlert API payload
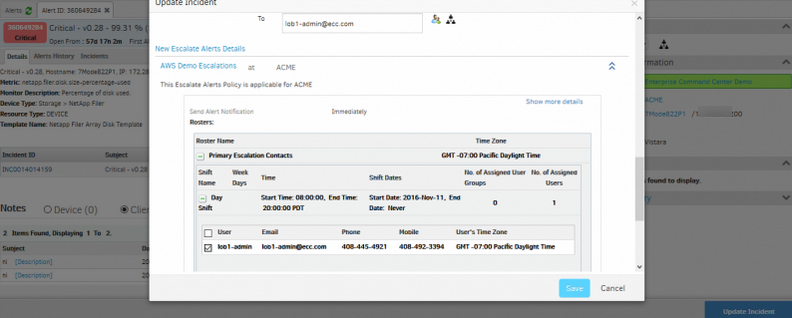
Added new tokens in the New escalate alerts functionality
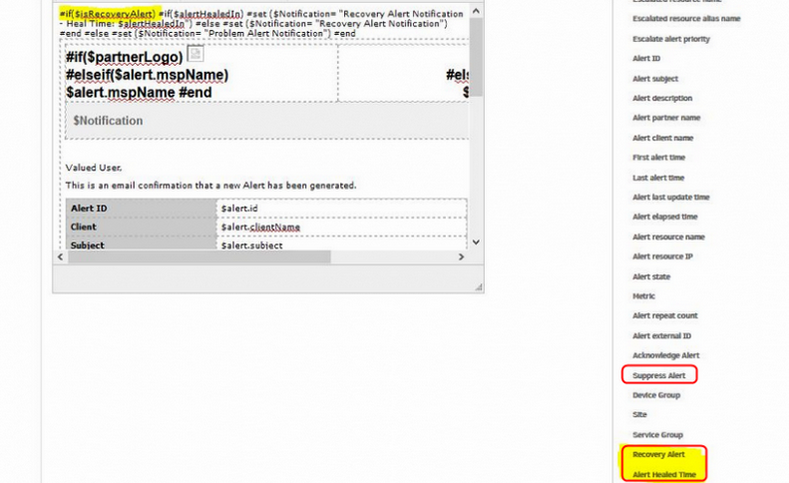
Added new tokens
Added new tokens (‘Recovery alert’, ‘Alert healed time’, and ‘Suppress alert’) and also provided support, for dynamic Email subject and content, in New escalate alerts policy.
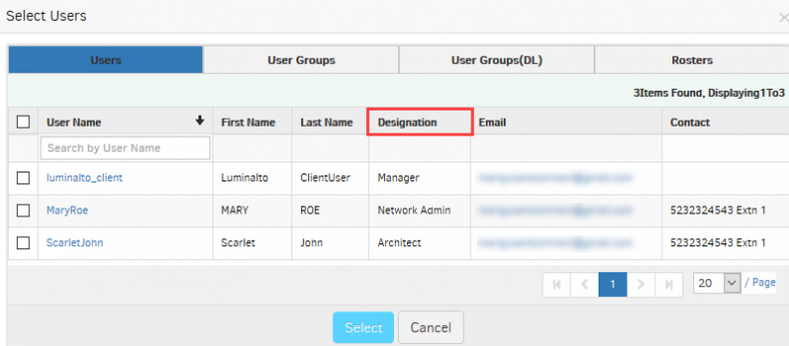
Designation column in User list
Now you can view the designation of the user to prioritize appropriately in Rosters and User group.
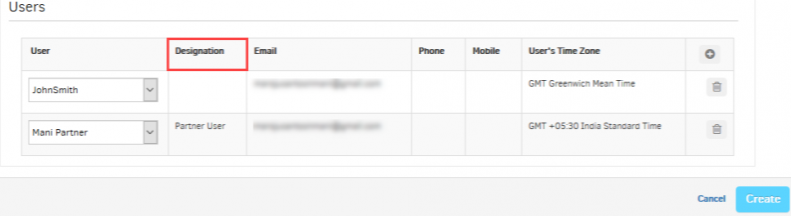
Designation column in User list
Designation column in User list
Alert Correlation
OpsRamp can now automatically correlate alerts that are likely related to the same issue and create an Inference. Once alerts are correlated to an Inference, you can manage them as one – acknowledge, escalate, and create incidents once – instead of responding to each alert individually. Inferences help you:
- Recognize alerts that important, from alerts that are noise.
- Focus your efforts on the cause of the issue, instead of the symptoms.
Inference
Inference
Inference
See Help, for details on how the Inference feature works.
Shared Alert Views
You can now share alert views with other users within your organization.
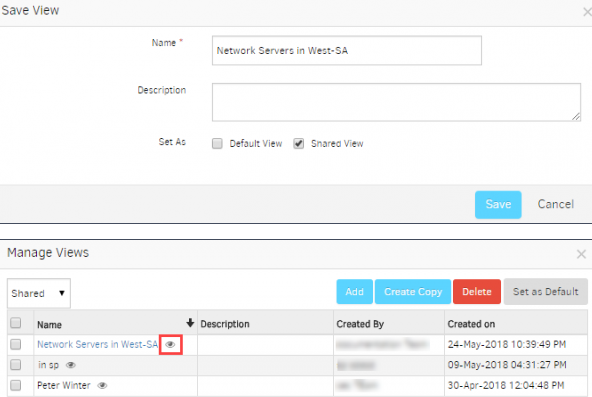
Shared Alert Views
Partner user can share and receive filters with his Partner level users only. Similarly, Client and SP user.
Alert filter views are of 3 types: All, Private and Shared.
All: Includes both Private and Shared views.
Private: Includes user created views.
Shared: Includes user shared and received views.
New option Create Copy is provided, which the user can use to clone an existing filter and can modify easily.
User is not allowed to edit and delete other users’ shared filters, but can set them as default.
Sorting and search options are provided to use filters.
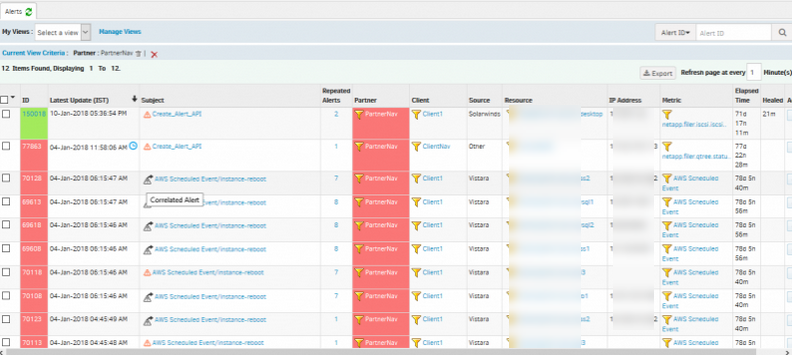
Total Correlated alerts shown as count, on the Alerts listing page
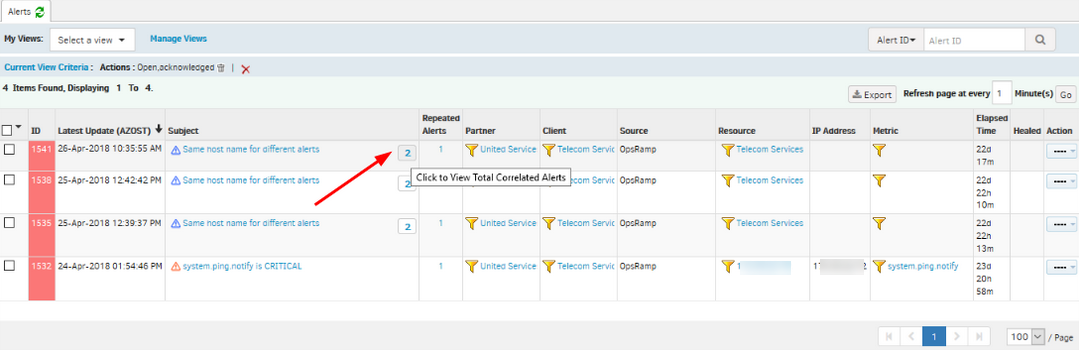
Total Correlated alerts shown as count
Total Correlated alerts shown as count, on the Alerts page (only for inference alerts and RCA). The user can hover over the value to view the title.
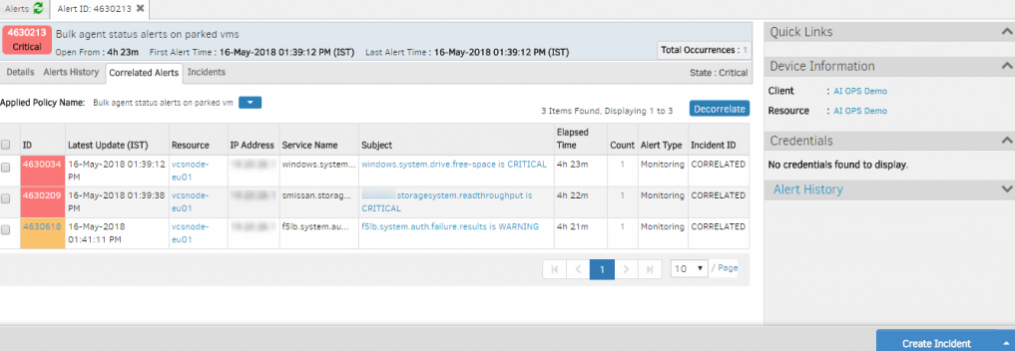
Functionality is provided to de-correlate the alerts correlated to RCA
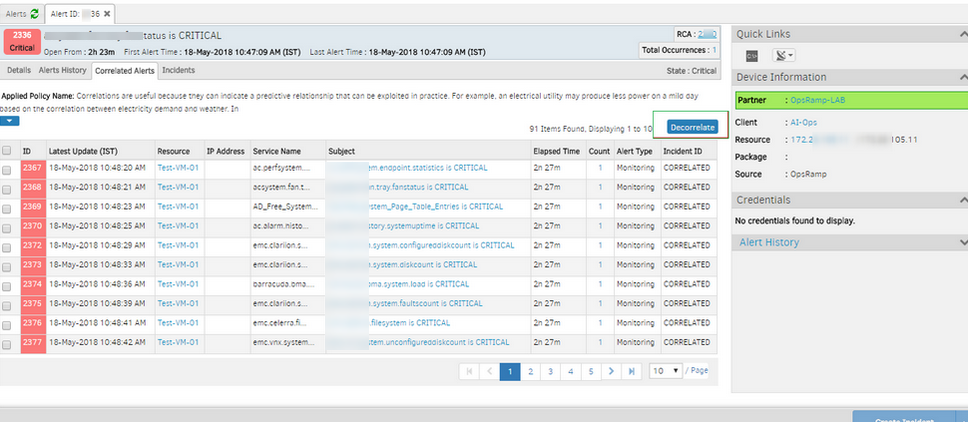
Functionality is provided to de-correlate the alerts correlated to RCA
The Decorrelate button is provided to de-correlate the alerts that are correlated to the RCA.
If the user has Alert Manage permission only then the Decorrelate button will be visible. User with Alert view Permission cannot see the Decorrelate button for both Inference & RCA alerts
The Enable Alert Correlation option is removed from the UI
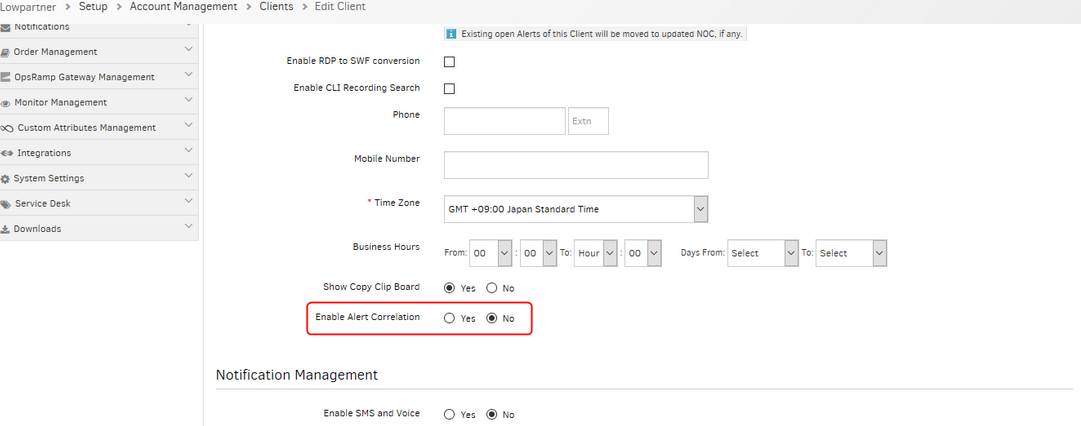
The Enable Alert Correlation option is removed from the UI
The Enable Alert Correlation option is removed. This option will not appear now while Creating or Editing a client.
Default value and dropdown options order in algorithm-based correlation changed, time span set at 15 min
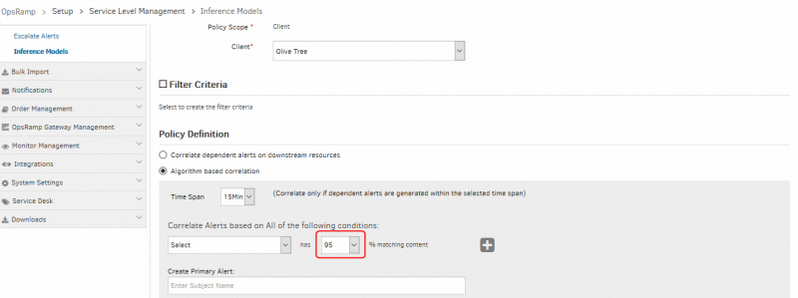
Default value and dropdown options order in algorithm-based correlation changed
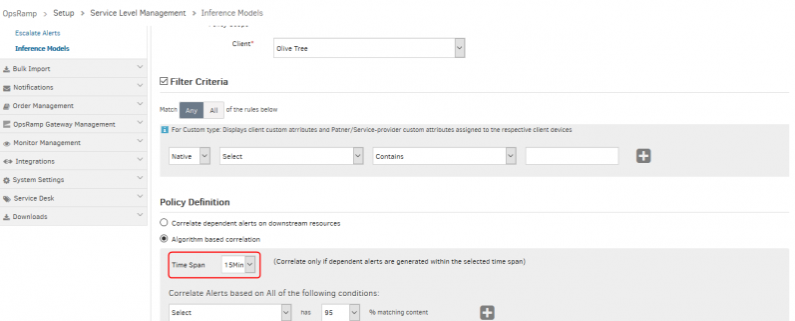
Default value and dropdown options order in algorithm-based correlation changed
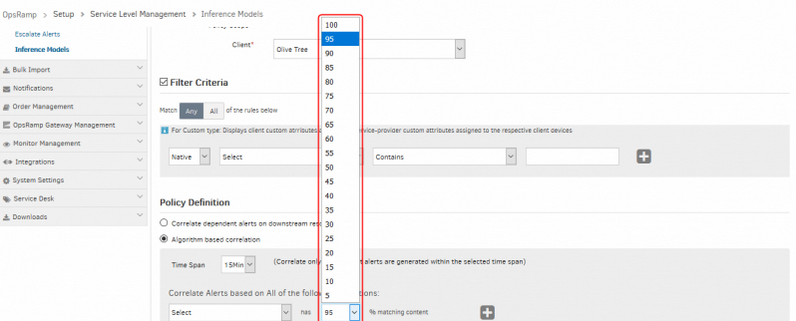
Default value is set as 95 in the matching percentage field
Dropdown values in the algorithm-based correlation are now shown in descending order (previously, the values were shown in ascending order), and the default value is set as 95 in the matching percentage field.
Default value of time span in both algorithm-based correlation and dependent based correlation is set as 15 min.
Up to 50 metrics can be added for both Upstream and Downstream metrics, while defining the policy
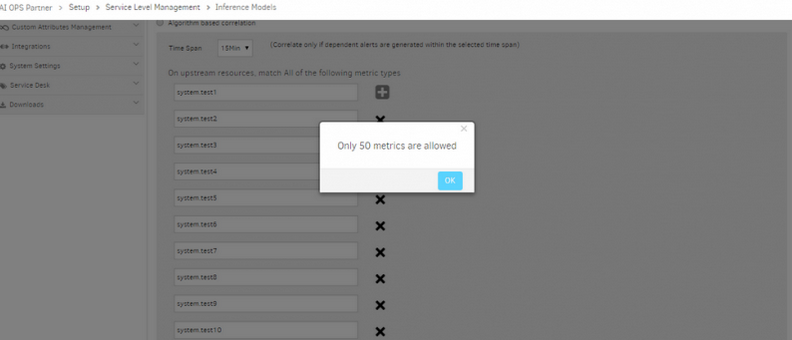
Up to 50 metrics can be added for both Upstream and Downstream metrics
A message appears, ‘Please check the data’ for any exception while saving the Inference Model.
Partner and Client Level Dashboard showing Alert Correlation Widget
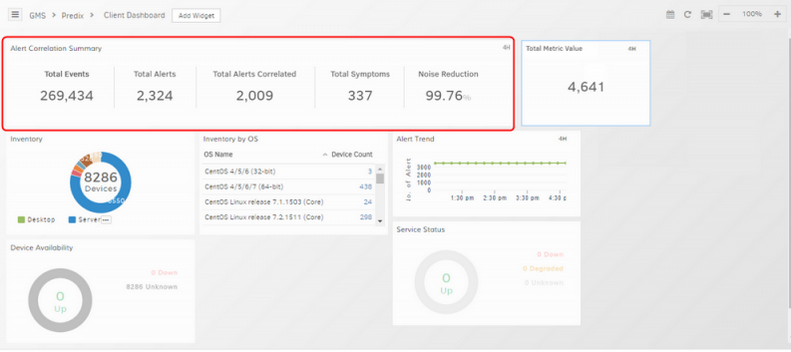
Partner and Client Level Dashboard showing Alert Correlation Widget
The Partner and Client Level Dashboards show the Alert Correlation Widget with the total alerts correlated and the Noise Reduction percentage.
Escalate Alerts Policy – Only Active shifts can be seen on the alert browser
The active shift is highlighted in green.
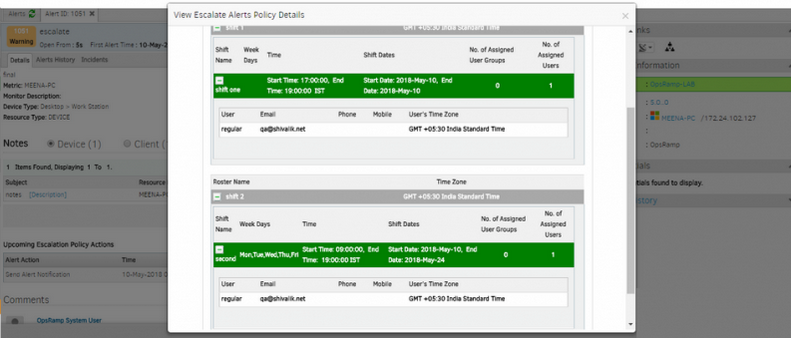
Only Active shifts can be seen on the alert browser
Events with same Event ID, Source and Different Description are no more dropped as redundant alerts
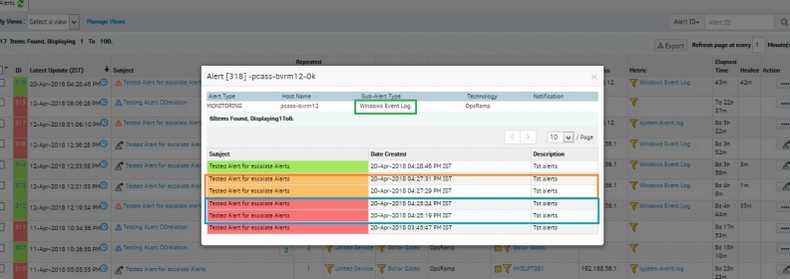
Events with same Event ID, Source and Different Description are no more dropped as redundant alerts
Event logs that match the selection criteria in a single probe interval will merge into a single alert.
Partners who do not have Setup access can view the templates description as a tooltip on mouseover
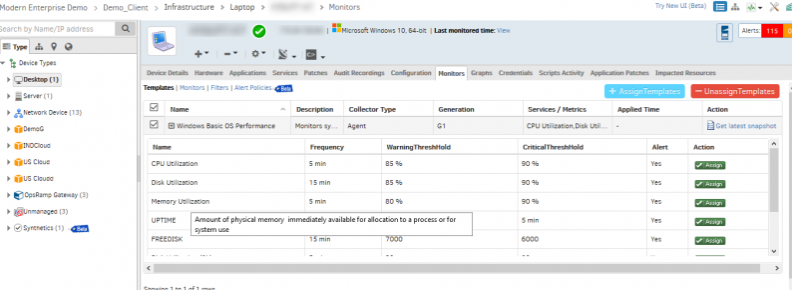
View the templates description as a tooltip on mouseover
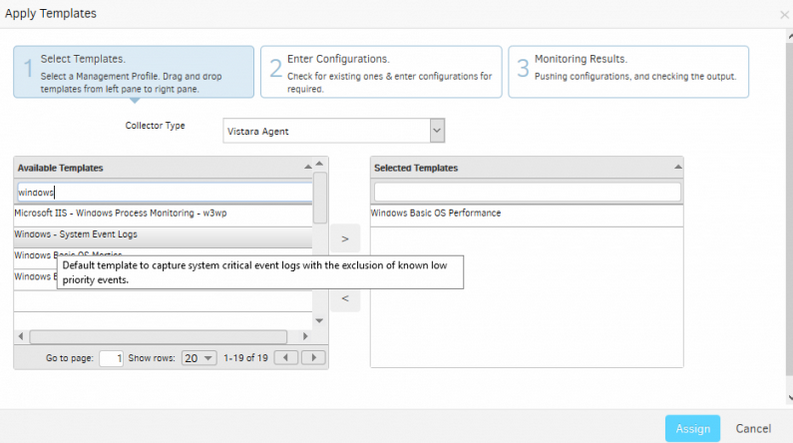
View the templates description as a tooltip on mouseover
Support custom attributes in alert correlation policy
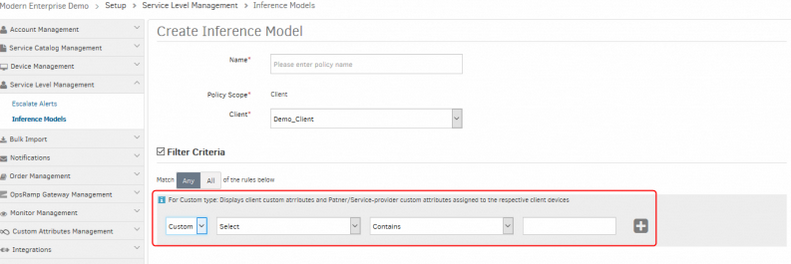
Support custom attributes in alert correlation policy
The user can now select Custom as filter criteria while creating Inference Models.
Easier navigation from alert to resource details
You can now go from alert details to resource details in a single click. The alert details page now includes relevant resource and resource component related links.
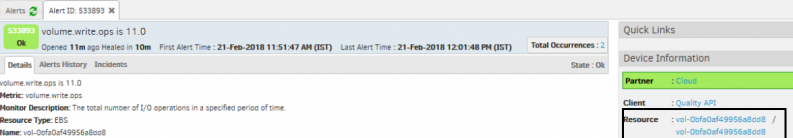
Easier navigation from alert to resource details
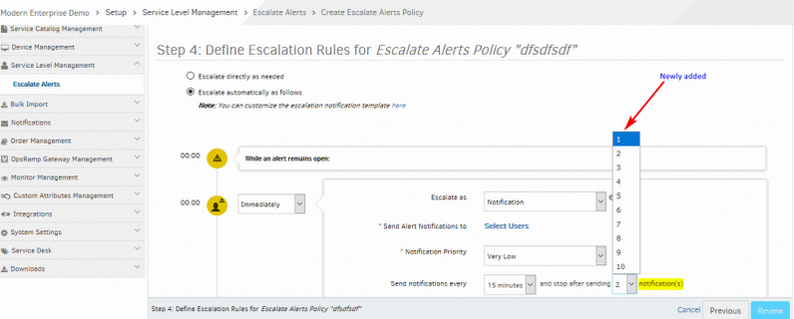
Repeat notification limits in alert escalation policy
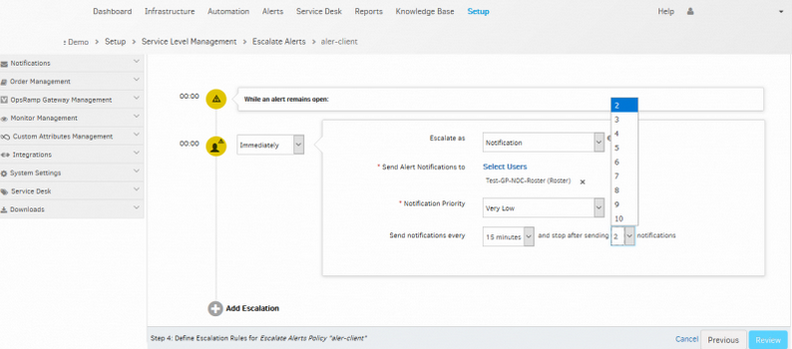
User can define the number of notifications
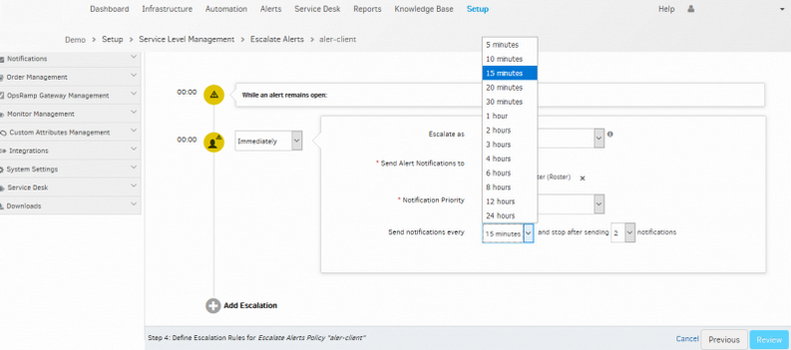
Default repeat frequency is 15 minutes
User can define the number of notifications (from 2 to 10) for each level of Escalate alert policy.
The notification limit is 2, and default repeat frequency is 15 minutes.
The “None” option is removed for repeat frequency.
Alert metric filters within schedule maintenance
You can now specify alert metric related conditions in defining a schedule maintenance window.
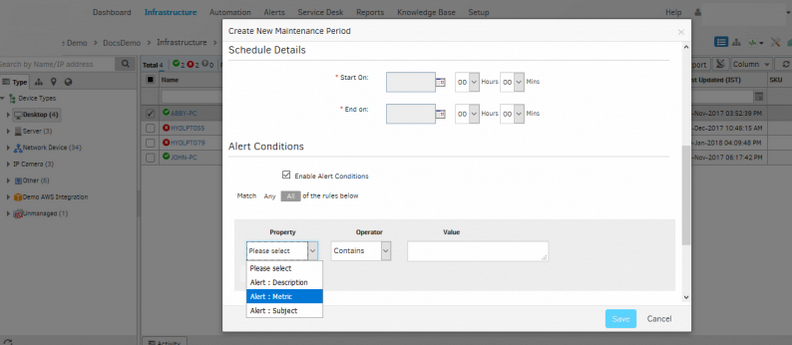
Alert metric filters within schedule maintenance
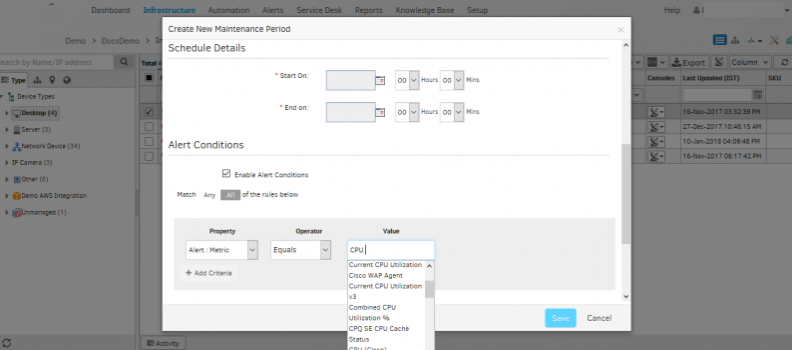
User can select the metric value
The user can schedule maintenance window for a device. Alert metric is added as a condition. The user can select the metric value. When the alerts which are sent to the device match the alert configured, the alerts will be moved to the scheduled maintenance window.
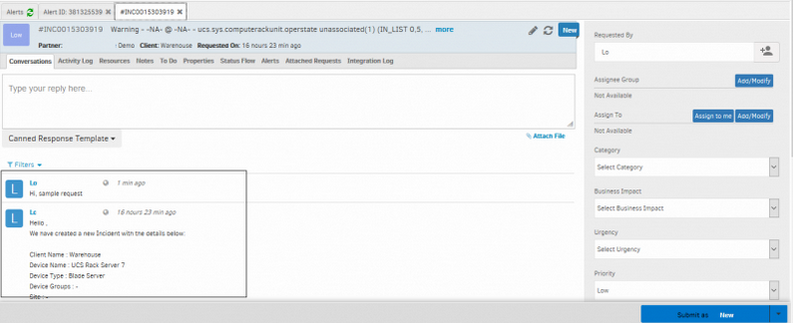
Alert time stamp details in the incident descriptions
Alert related timestamps are now available in the incident description. The email incident notification description will now also have the alert timestamps of associated alerts.

Alert time stamp details in the incident descriptions
Optimize the data shown in Comments section on alert description page
Optimize the data shown in Comments section on alert description page
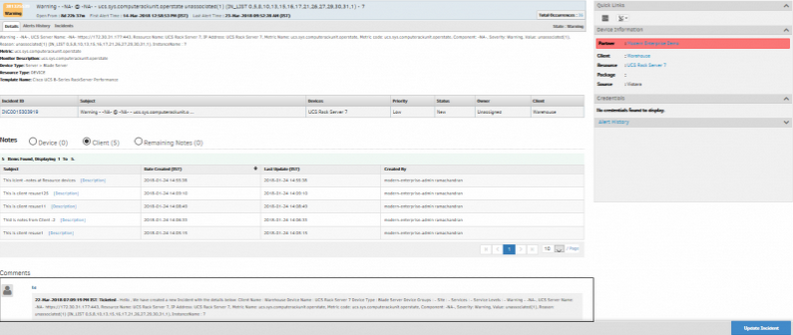
Optimize the data shown in Comments section on alert description page
After an Incident is created, the comments related to the incident used to appear in the Comments section of the Alert Detail page. Now, the comments will not show on the Alert Detail page. Incident comments will show on the Incident page.
Show only alert related details, in quick links, instead of showing all escalate alert policies
Only alert related details in quick links
User can now see only the notification related details in the Alert view page and Service desk page.
The escalate alert functionality works when alert is created via Email integration
The escalate alert functionality works when an alert is created via Email integration, and it is a third-party device (not in OpsRamp).
Escalate alert functionality works when an alert is created via Email integration
Escalate alert functionality works when an alert is created via Email integration
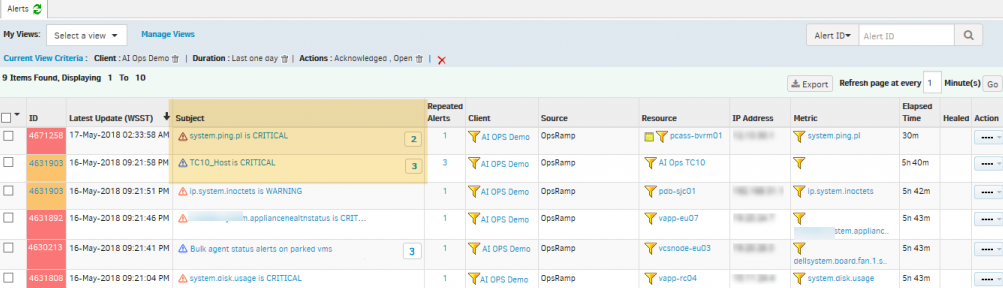
Third party alerts are also included in the Escalation alert functionality.
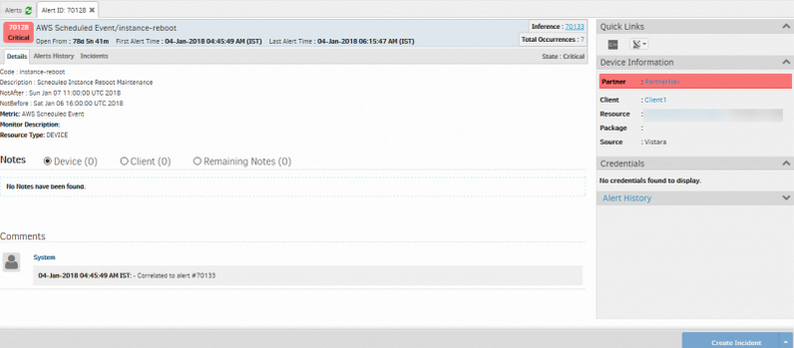
It is named as Correlated Alert as shown above, in the Subject column.
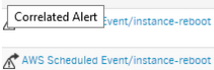
Correlated Alert
This is correlated to the alert, that is shown as Inference on the Alert Details page.
Limit repeat notifications in alert escalation policy
You can now limit the number of repeat notifications to one in an escalation policy.
Limit the number of repeat notifications to one
The previous release (4.9.2) had repeat notification selection range as 2-10. With 4.9.3 users can now select ‘1’ as an option and the notifications would stop after notifying once.
Legacy Escalation Policies no longer available
As announced earlier, legacy escalation policies and shift schedules have been migrated to escalate alert policies and rosters. You can now see your newly created policies and rosters under Setup tab:
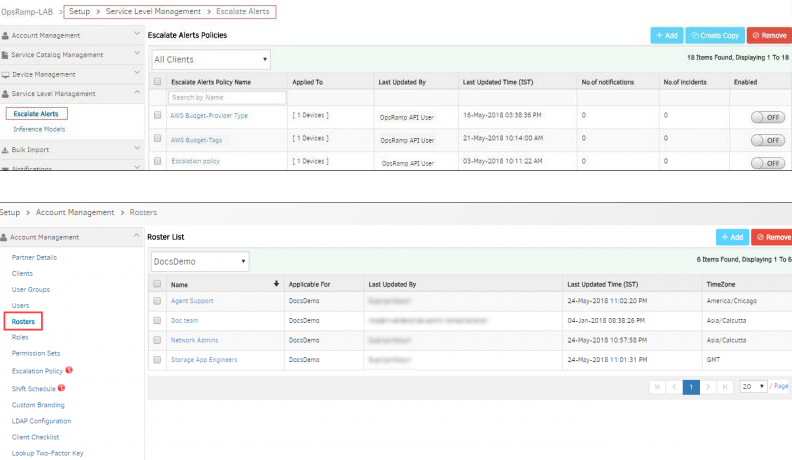
Legacy Escalation Policies no longer available
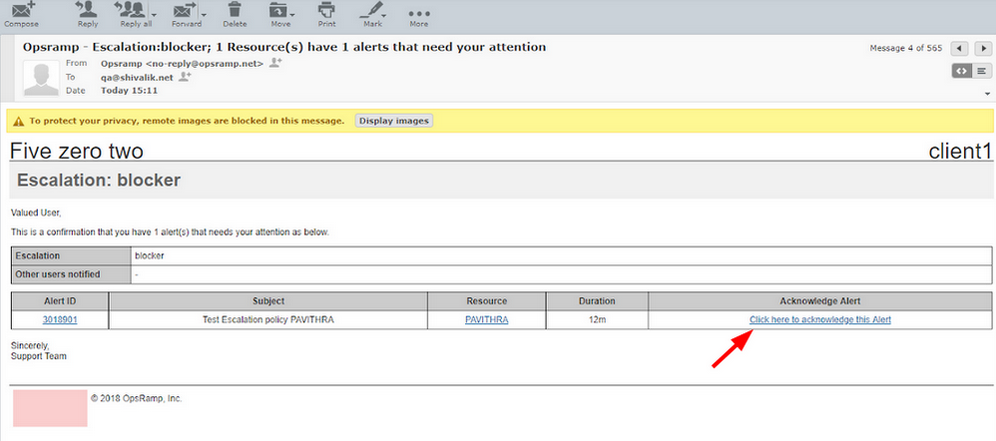
Suppress and Acknowledge alerts from E-mail not working
The user cannot suppress or acknowledge alerts from E-mail, as the link is not redirecting to SSO provider, and it is prompting to login directly to OpsRamp.
Cannot suppress or acknowledge alerts from E-mail
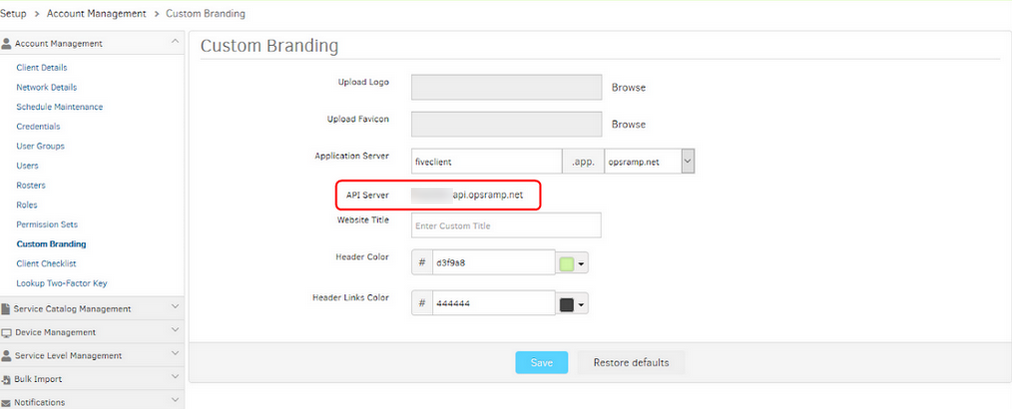
Custom branding URL will be added
Custom branding URLs which are specific to client and partner will be present in E-mail if and only if organization level logo is present for that specific and partner. As this client is not having logo at client level, custom branding URL is not sent in escalation E-mail.
Issue is fixed. Acknowledge and Suppress links in the E-mail are redirecting to the Endpoint URL. The user can acknowledge and Suppress alerts successfully. So, if the user (Partner/Client) has defined custom branding, the custom branding URL will be added.
Resource Management
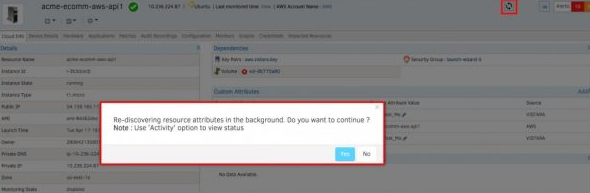
Sync button is provided on the Device details page to get information from agent and cloud
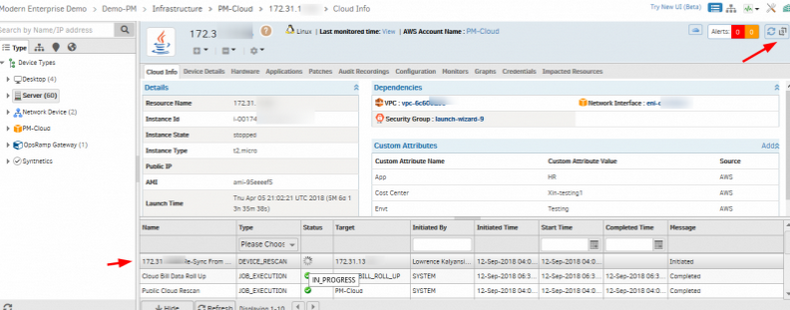
Sync button is provided on the Device details page
Sync button is provided on the Device details page, showing the latest information from agent and AWS, azure and Google cloud instances. The activity log shows the details.
Added new attribute vCenter name against VMware/host in filter criteria
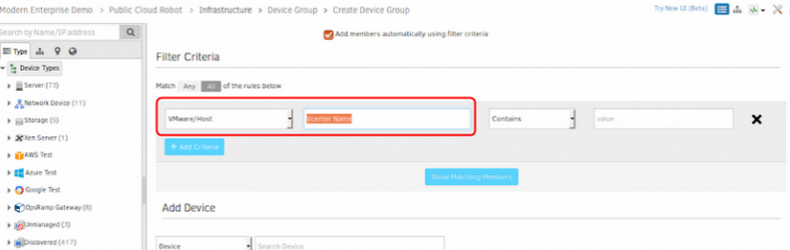
Added new attribute vCenter name
Cloud Management
In-depth monitoring of cloud databases
This release provides in-depth monitoring of cloud relational databases to track database performance natively, in greater detail. For AWS Relational Database Service (RDS), the in-depth monitoring of the following databases is supported: MySQL, PostgreSQL, SQL Server, Amazon Aurora, MariaDB, and Oracle. Using AWS RDS for MySQL as an example, the key customer benefits are:
- Two levels of cloud database monitoring to choose from: Cloud-native API Cloudwatch, direct integration with MySQL database using the OpsRamp Gateway.
- Direct integration with MySQL in AWS RDS provides the following performance metrics which are not available via CloudWatch APIs: Transaction and query throughput, query execution performance, connection errors and buffer pool usage.
- These critical database performance metrics can also be used to set thresholds and alerts for user actions.
The same in-depth monitoring capability and customer value also apply to Azure Database for MySQL, Azure Database for PostgreSQL, Azure SQL Database, and Google Cloud SQL.
Now you can discover AWS S3 resources, monitor performance, and receive CloudWatch alarms and CloudTrail events from AWS S3 bucket
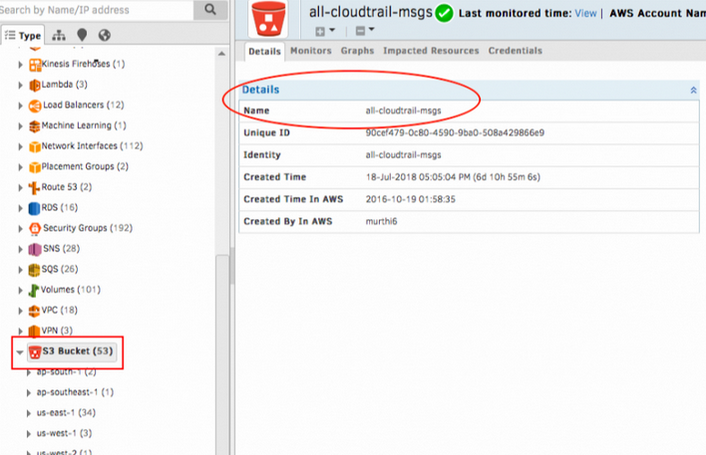
Discover from AWS S3 bucket
User can onboard Azure Germany cloud resources and monitor the performance of these resources in OpsRamp. User gets visibility of Azure assets across the globe even though Azure Germany is isolated from the rest of Azure.
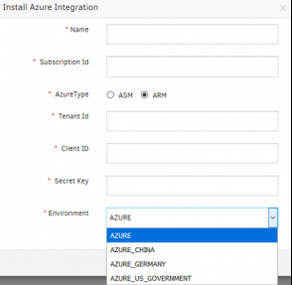
Visibility of Azure assets across the globe
Cloud Spend Visibility
You can now track your spend on your Amazon AWS, Microsoft Azure, and Google Cloud Platform accounts:
- Track spend by cloud account, region, type of cloud service and resources tagged with custom attributes.
- Configure budget policies track spending against defined budgets and get alerts when spending exceeds budget.
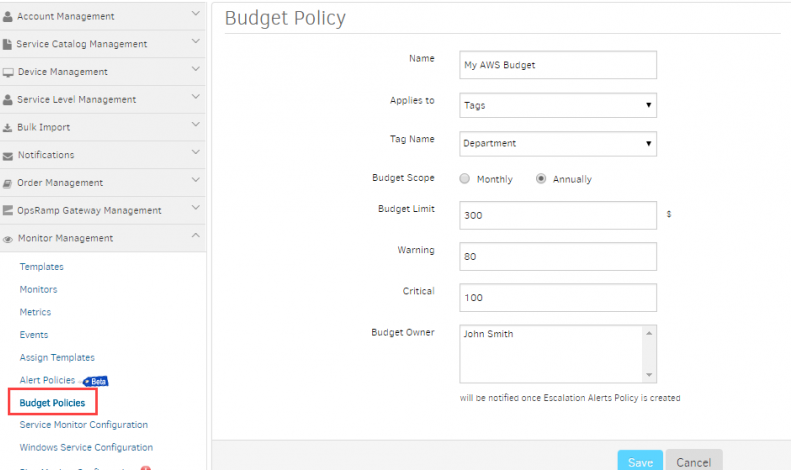
Cloud Spend Visibility
Added 12 months option in Cloud Trend widget, in monthly view type
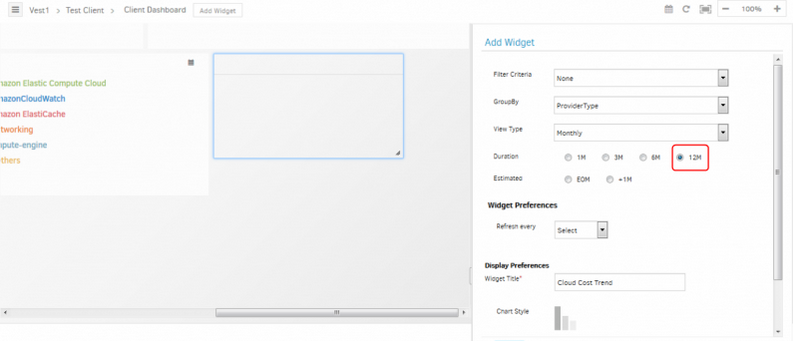
Added 12 months option in Cloud Trend widget
Provided ability to aggregate cost based on cloud account tags in Cost widgets
Provided ability to aggregate cost based on cloud account tags in Cost widgets
The user can now aggregate cost of all resources under the account when these tags are selected for Group By options in Cost widgets and Budget policy.
Export CSV option provided in Cost Trend Widget
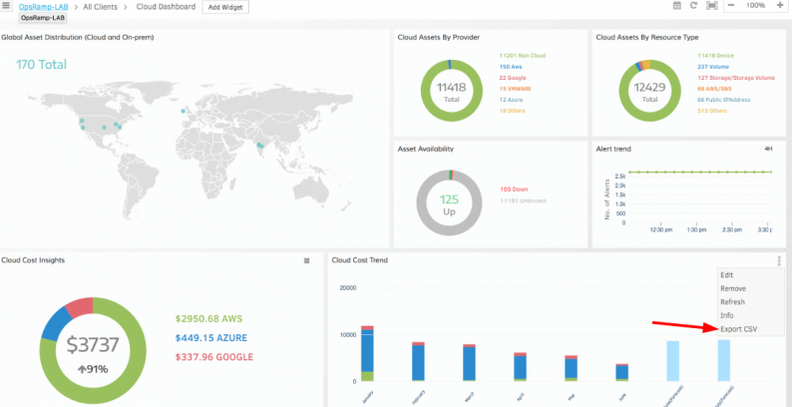
Export CSV option provided in Cost Trend Widget
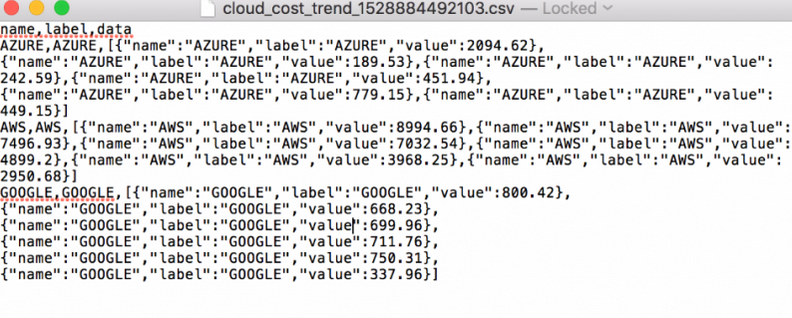
Export CSV option provided in Cost Trend Widget
Export CSV option is provided for Cost Trend, which exports data in CSV format.
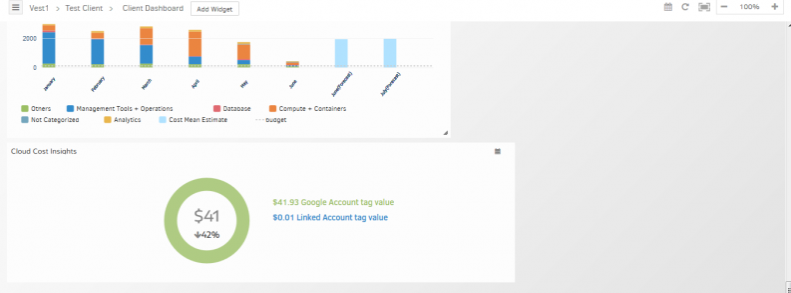
Monthly breakdown of Cost by provider type and accounts can be viewed
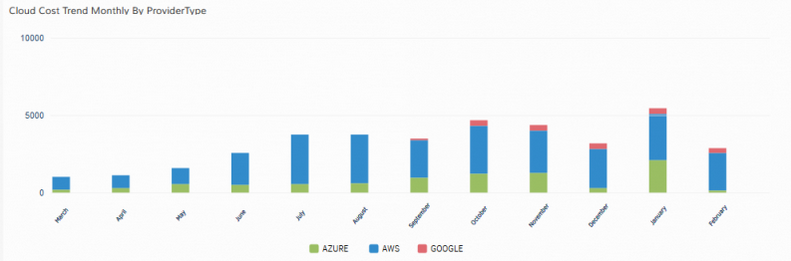
Monthly breakdown of Cost by provider type and accounts
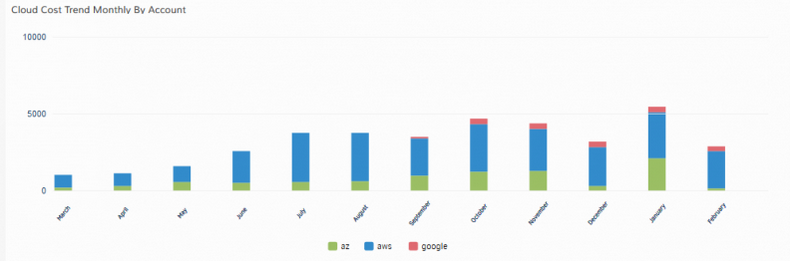
Monthly breakdown of Cost by provider type and accounts
Monthly breakdown of Cost by Provider Type and Accounts can be viewed using Cloud Trend widgets.
Yearly breakdown of Cost by provider type and accounts can be viewed
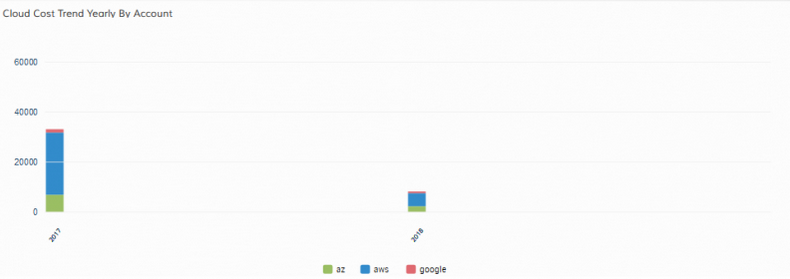
Yearly breakdown of Cost by provider type and accounts
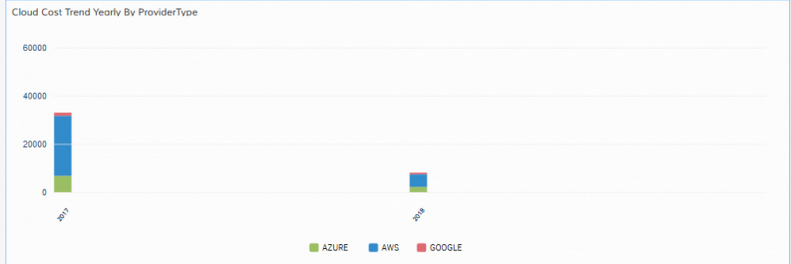
Yearly breakdown of Cost by provider type and accounts
Yearly breakdown of Cost by Provider Type and Accounts can be viewed using Cloud Trend widgets.
Region wise resources are displayed in Geo Map widget, for Cloud and On-prem
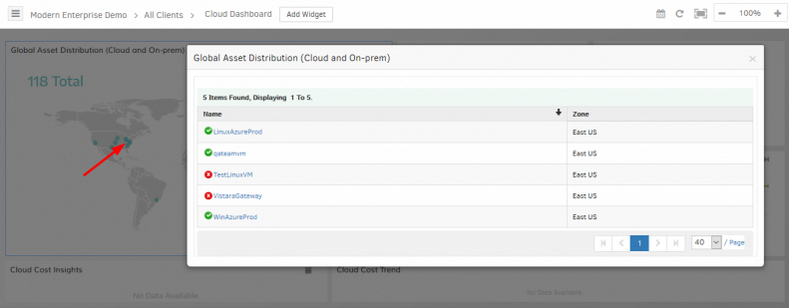
Region wise resources are displayed in the Geo Map widget
Region wise resources are displayed in the Geo Map widget when the user clicks on the map points. The availability status of the resources can also be seen.
Improved support for Amazon Web Services Relational Database (RDS)
You can now use the database name attribute in device management and auto-incident policies.
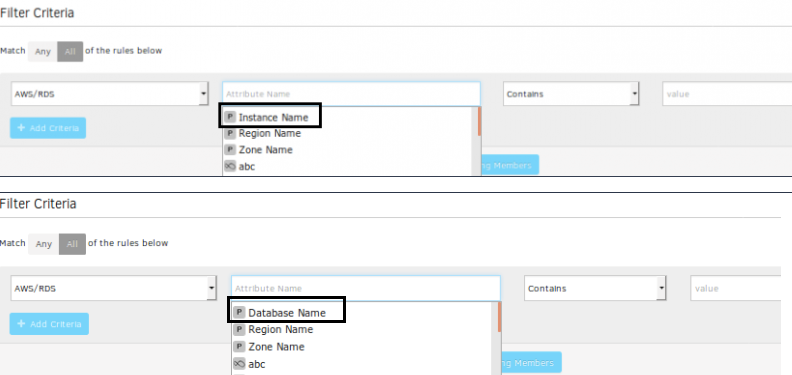
Improved support for Amazon Web Services Relational Database (RDS)
Four new Azure database metrics have been introduced
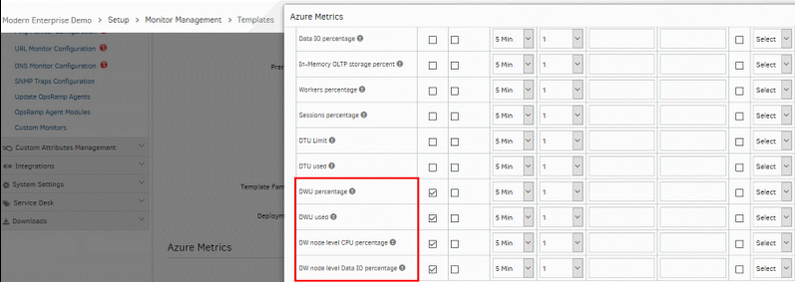
Four new Azure database metrics have been introduced
Microsoft has introduced the following 4 metrics for Azure SQL database:
- DWU percentage
- DWU used
- DW node level CPU percentage
- DW node level Data IO percentage
We have added these metrics in our platform.
Patch Management
Custom patch ratings with Patch Feeds
Now, you can apply you own patch ratings to patches using a Patch Feed. A Patch Feed is a new type of integration that enables to associate custom ratings with Windows and Linux patches published by the OS vendor. You can instantiate your own Patch Feed, apply custom ratings to patches via APIs and patch devices against custom rated patches.
Custom patch ratings with patch feeds
See Help, for more details.
Dependent patches automatically applied
Patch jobs that are configured with the auto-approve option now automatically apply all patches that are dependent on whitelisted patches. Prior to this release, dependent patches were not automatically applied with auto-approve option.
Note: Auto approval of patches should be selected in the patch job configuration.
Provided UI for patch integrations

Provided UI for patch integrations
The user can create Windows and Linux Patch Integrations under SP, Partner and Client.
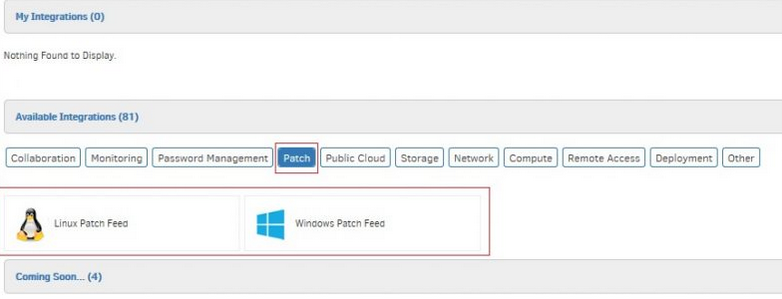
Provided Windows and Linux patch integrations in Available Integrations
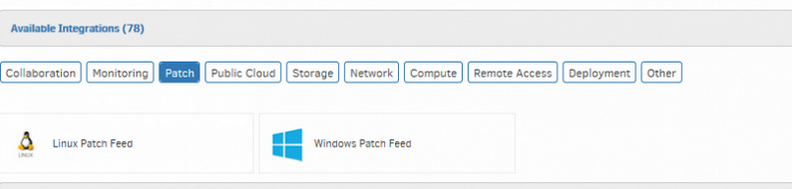
Provided Windows and Linux patch integrations
Also, provided Patch as a separate category in Available Integrations.
Patch Management view fusion
- Starting with this release, OpsRamp patch management Classic view will be fused with the current New patch management view.
- The new view will have the functionality of both the views being merged.
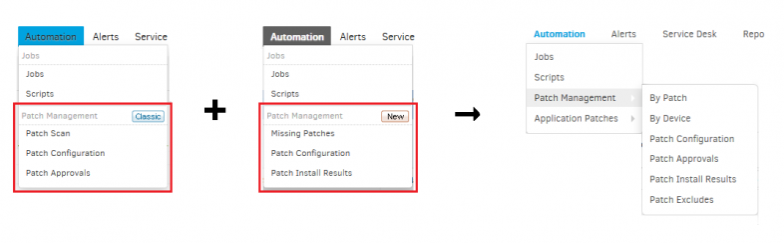
Patch Management view fusion
Approving patches with the improved patch management UI
Starting with this release, OpsRamp users will have to use the new UI for patch management for approving patches. The new UI will provide all existing functionalities of each of the earlier patch management views, plus additional capabilities like search within each of the categories. Users can approve patches using the following views:
- By Patch : Gives a list of all the missing patches in the client, with the current status of each patch w.r.t the list of devices it is missing in, installed in, approved in, and also the list of devices in which that patch installation was executed but failed.
- By Device : Gives a list of all the devices in the client that are missing any patches, along with the list of missing patches, installed patches and approved patches for each of the devices.
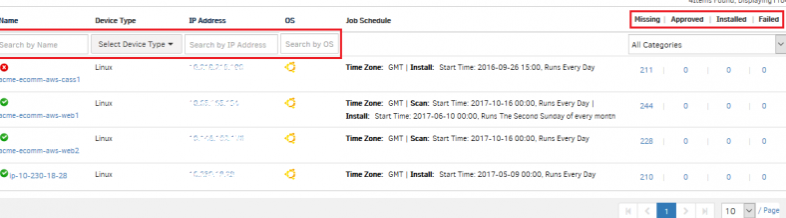
Approving patches with the improved patch management UI
See Help, for detailed procedure on how to approve patches using the modified UI.
Improved Patching UI in infrastructure
This release brings an improved UI in the patches tab of a given device in the infrastructure. The improved UI offers:
- Ability to search through the available patches using patch name, severity and category of the patch
- Ability to quickly navigate between missing, approved, installed and failed patches.
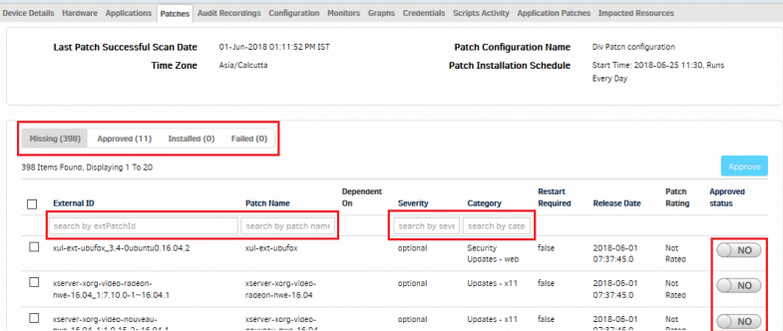
Improved Patching UI in infrastructure
Note: Starting this release users cannot approve/unapprove a given patch for all devices of a given client in the Infrastructure page. But, the same can be achieved using the new patch management view. See Help, for details on how this can be done.
Resource Attributes
Improved discovery of Resource attributes
This release brings consistent updates to resource attributes. As a result, the following changes are introduced:
Resource Name and Host Name
Dedicated Resource Name and Host Name attributes can be used to consistently capture the name attribute from different collectors (Agent, Cloud, Gateway). Resource Name is introduced to capture name assigned by a hypervisor or public cloud provider and Host Name is updated to capture name assigned by the Operating System.
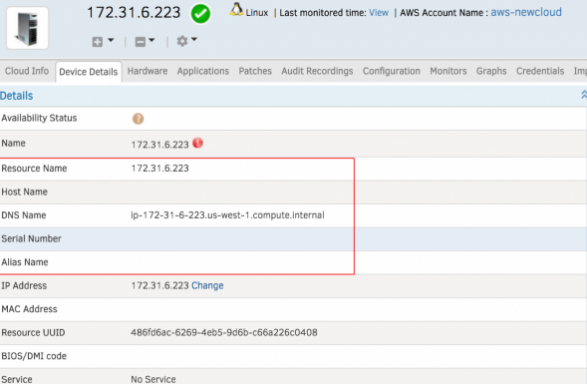
Resource Name and Host Name
Rescan Option
Rescan option can be used to update resource attributes at any given time.
Rescan option
Note: Discoverable attributes such as Host Name, Resource Name, DNS Name, Serial #, Device Type, Make, Model, OS etc. are no longer editable. Name field has been removed during the process of Creating/Editing a device.
Decommissioning a Resource
The Decommission feature allows users to retire a resource and retain its attributes. With this new feature:
- Users can decommission any resource from infrastructure page or API
- Decommissioned resources are permanently removed from OpsRamp
- Users can retrieve decommissioned resources using Get and Search APIs
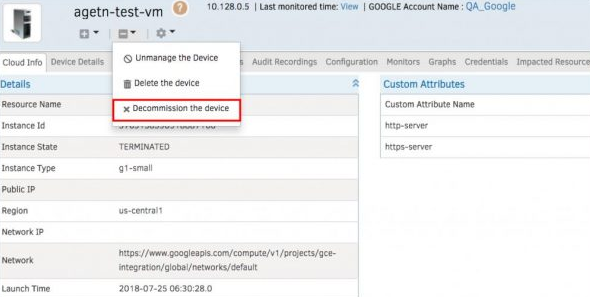
Decommissioning a Resource
Configuring ‘Resource Decommission’ feature as part of client setup
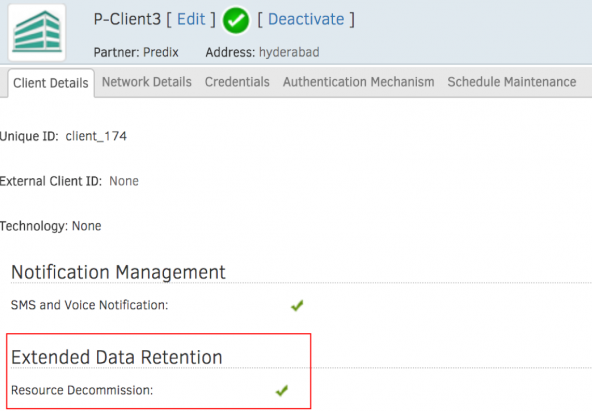
Extended data retention
Note: The Decommission feature is available as part of the Extended Data Retention module
Custom Attributes
OpsRamp Custom Attributes created after September 2018 release will have their source name reflected as OpsRamp (instead of Vistara).
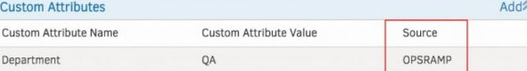
Source name reflected as OpsRamp
Source name reflected as OpsRamp
Reports
Alert and Cloud Cost Reports
Custom Reports feature is extended to support Alert and Cloud Cost reporting.
Custom Alert Report
Enhanced filter criteria can be used to customize Alert reporting. These custom reports also provide summarized alert charts on alert trending, top servers with most alerts generated, and other analytics for alerts.
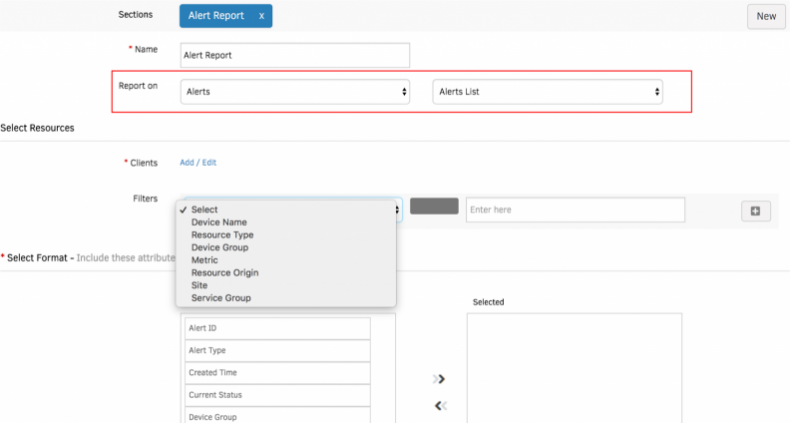
Custom Alert Report
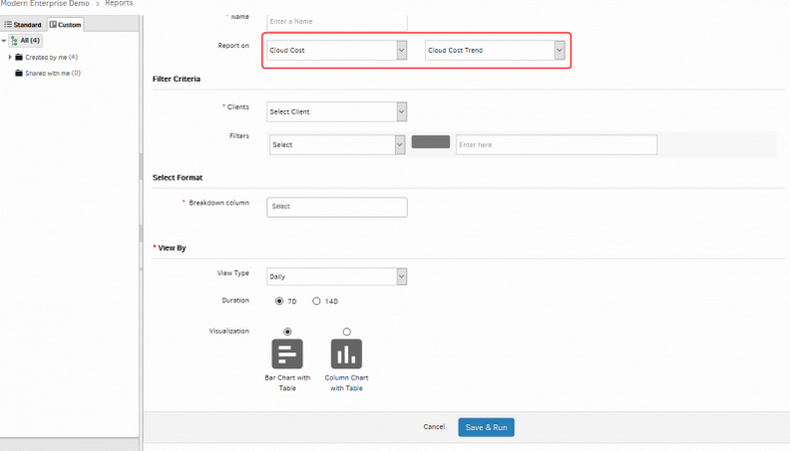
Cloud Cost Report
Users can generate cost analytics and cost historic trend reports for a given time period.
Cloud Cost Report
See Help, for more details on how to configure Custom Reports for Alert and Cloud Cost reporting.
Monitor Details Report
‘Device Status (online/offline)’ column has been updated to ‘Device Status’
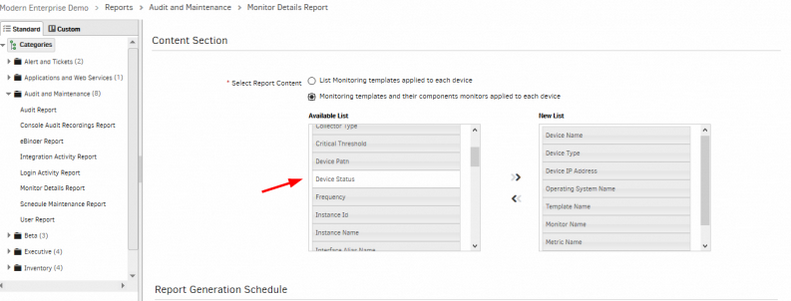
Device Status (online/offline) column has been updated
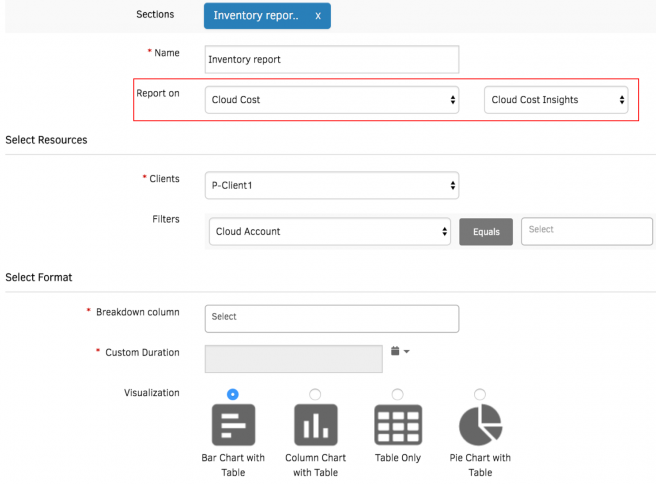
Added Alerts/cloud cost sections, filter support for Device group and Site in Inventory and Metric section (Report Composer)
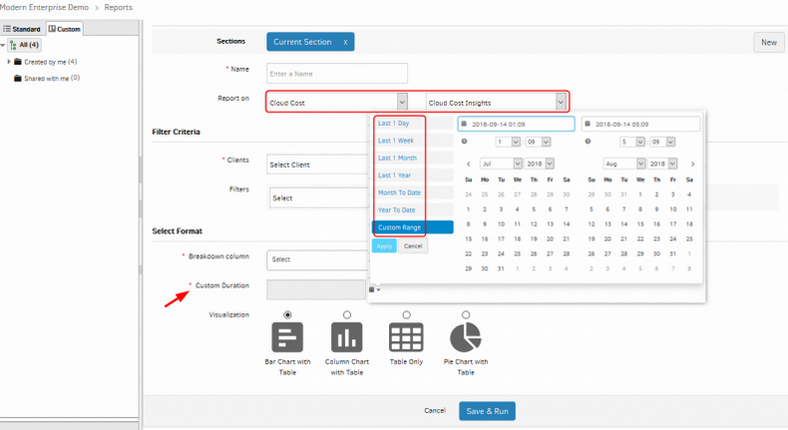
Cloud Cost section added: Cloud Cost – Cloud Cost Insights / Cloud Cost Trend
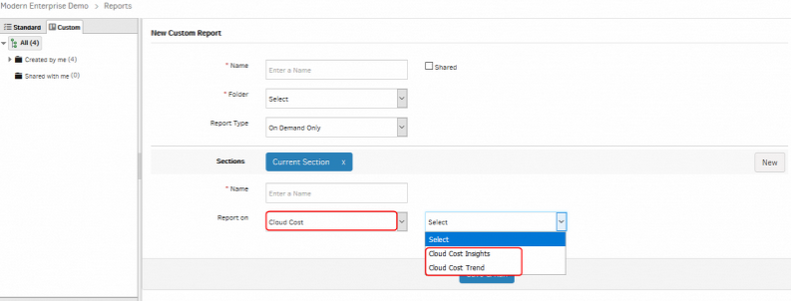
Cloud Cost section added: Cloud Cost – Cloud Cost Insights / Cloud Cost Trend
Cloud Cost section added: Cloud Cost – Cloud Cost Insights / Cloud Cost Trend
Cloud Cost section added: Cloud Cost – Cloud Cost Insights / Cloud Cost Trend
The Cloud Cost Insights has Custom Duration option, where the user has the option to select custom range duration and generate report accordingly. Apart from this, there are Last 1 Day, 1 Week, 1 Month, 1 Year, Month To Date and Year To Date options.
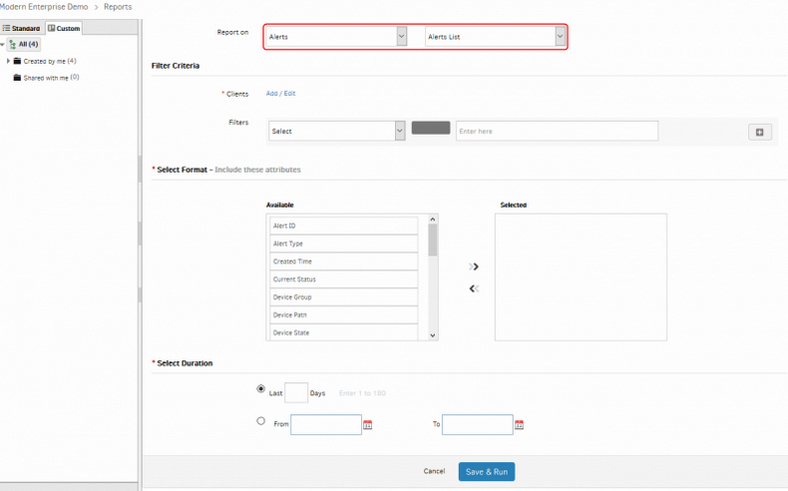
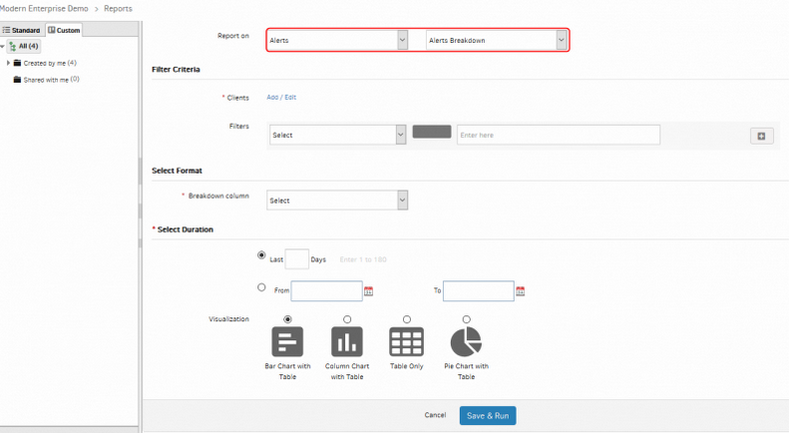
Alerts section added: Alerts – Alerts List / Alerts Breakdown
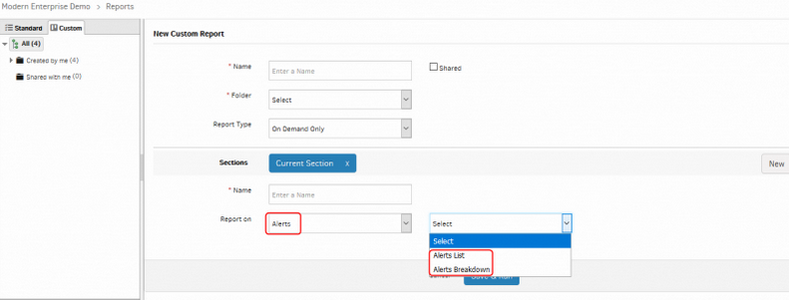
Alerts section added: Alerts – Alerts List / Alerts Breakdown
Alerts section added: Alerts – Alerts List / Alerts Breakdown
Alerts section added: Alerts – Alerts List / Alerts Breakdown
Added Current Status/Alert Type/Source filters to Alerts report
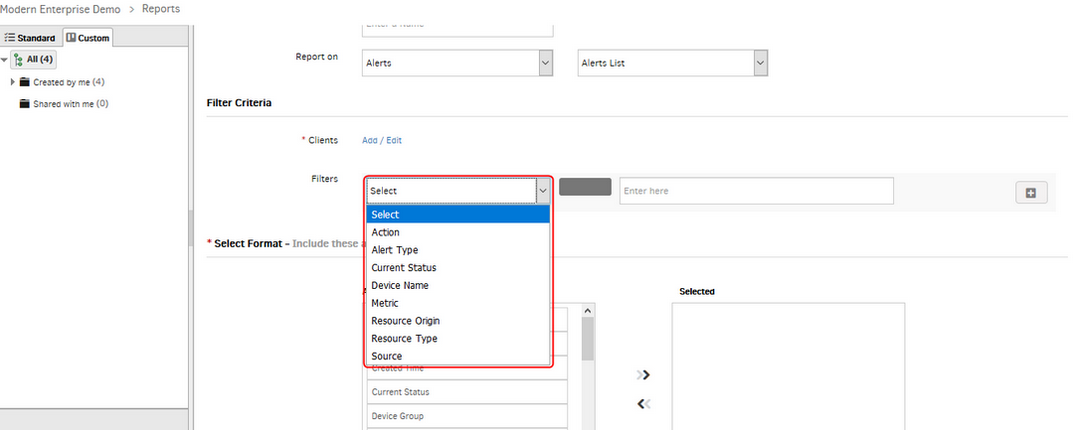
Added Current Status/Alert Type/Source filters
Custom Reports Resource Selection Using Filter Criteria
You can now select resources using filters on Device Name, Make, Model, Device Type or Resource Type, or a combination of these filters.
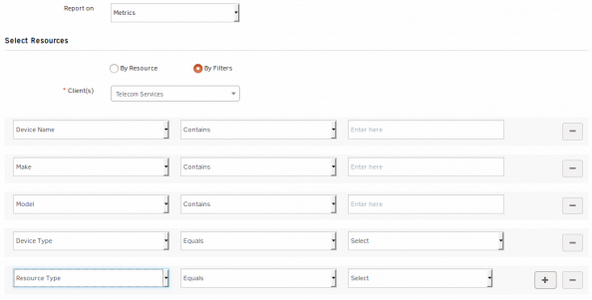
Custom Reports resource selection using Filter Criteria
Up to 5 metrics in the same section are available for Metric Report
- You can now select up to 5 metrics in the same section for metric report. Metrics can come from different Templates and Monitors.
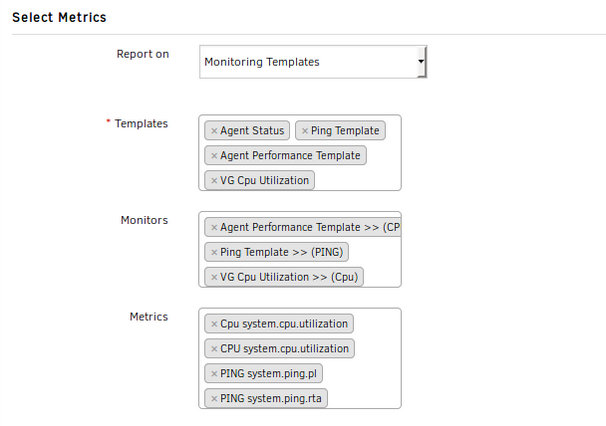
Select up to 5 metrics in the same section for metric report
- Custom reports also supports Synthetics Monitors.
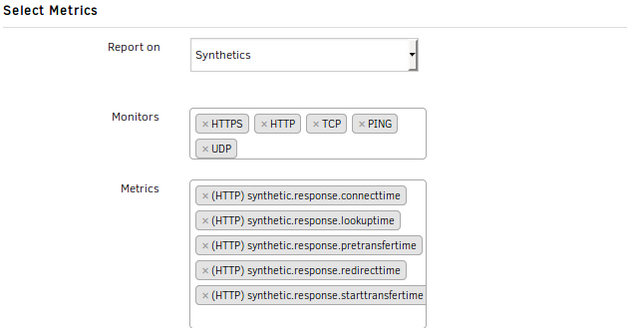
Custom reports also supports Synthetics Monitors
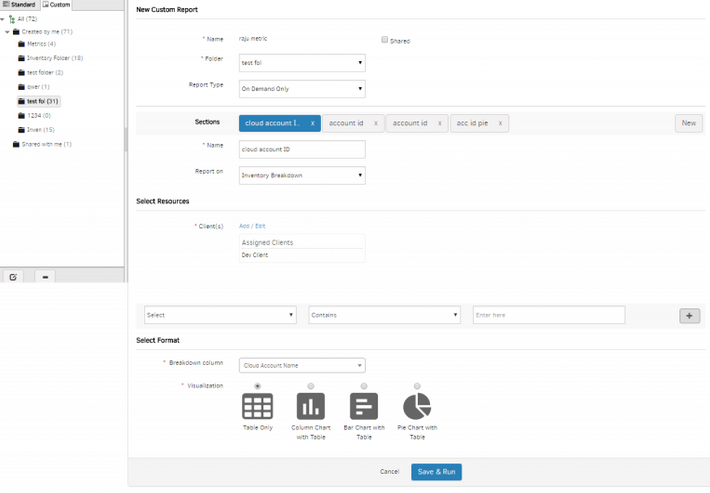
Custom Reports
The new Custom Reports feature enables you to design your own reports with customized content:
- Design spreadsheet style reports for inventory and metric data
- Schedule reports to run at a specific time
- Share reports with other users in the organization
- Organize reports easily within a folder
Custom Reports
See Help, for more details on how to configure Custom Reports.
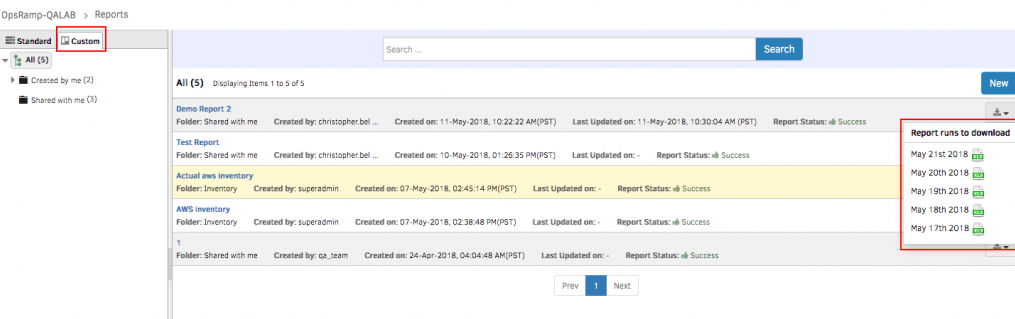
The user can download a report on clicking the Custom report name on the listing page.
Reports cannot be downloaded when the report is in queue / in progress state.
Last day of the month is added as an option for a monthly recurring schedule
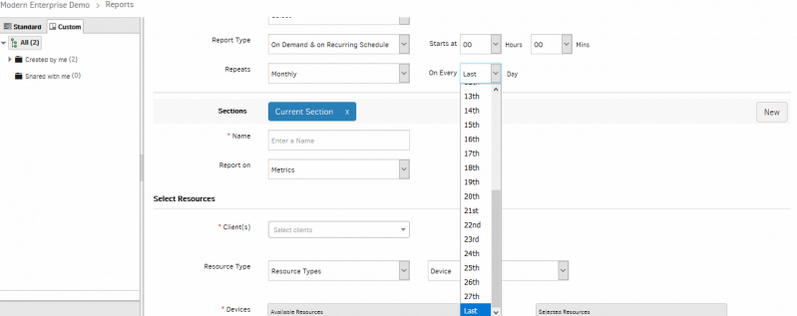
Last day of the month is added as an option
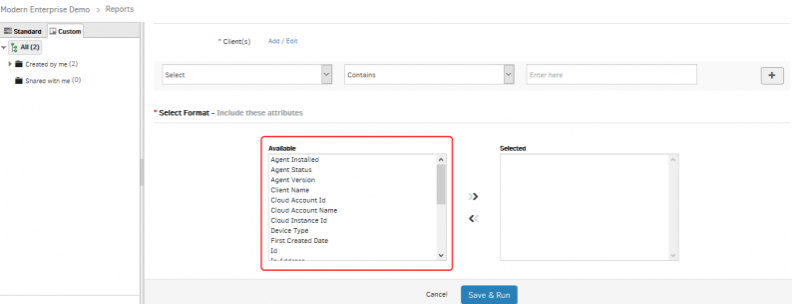
Attributes are listed in alphabetical order
Attributes are listed in alphabetical order.
Added Breakdown columns Cloud Account Name and Cloud Account ID for Custom Inventory Breakdown report
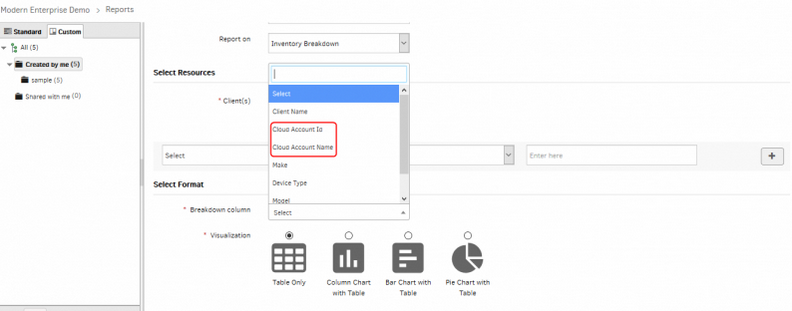
Added Breakdown columns Cloud Account Name and Cloud Account ID
E-mail notification will be sent to the user who created Custom report and to all the users of the organization
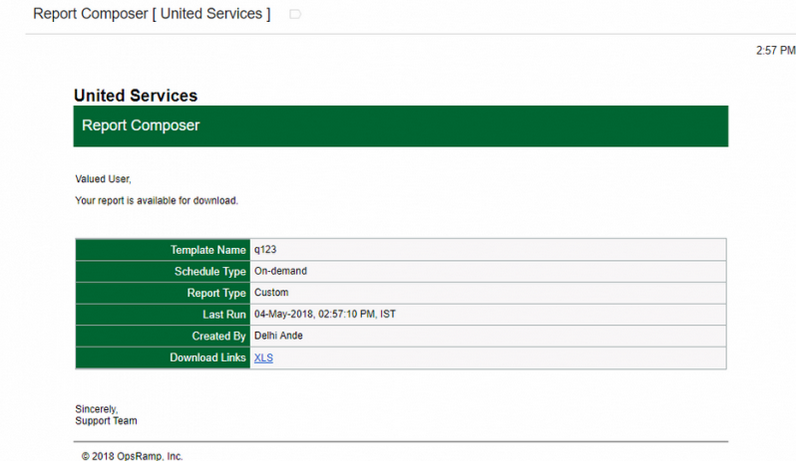
E-mail notification will be sent to the user who created Custom report and to all the users of the organization
Whenever a Custom report is created, an Email notification is triggered to the user.
If the user creates a Custom report with Shared option enabled, an Email notification will be sent to all the users of the organization who have the report notifications enabled in their User Profile.
All/Multiple Clients can be selected when creating custom report
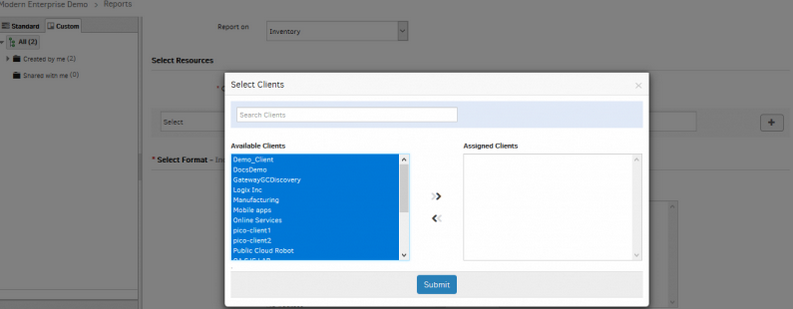
All/Multiple Clients can be selected when creating custom report
When creating a Custom report on Inventory, multiple clients can be selected (up to 100 clients) using the multi-search feature.
The number of records in the report is limited to 50,000.
Download a Custom Report
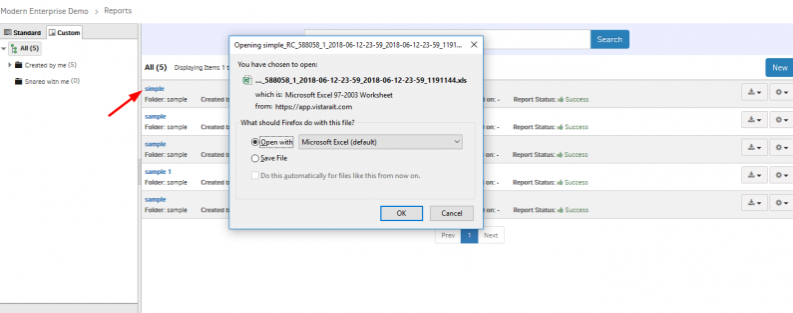
Download a Custom Report
The user can download a report on clicking the Custom report name on the listing page.
Reports cannot be downloaded when the report is in queue / in progress state.
Edit, Run, and Delete features provided for Custom reports
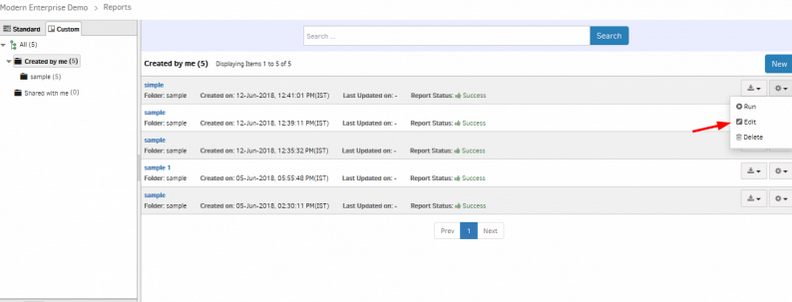
Edit, Run, and Delete features provided for Custom reports
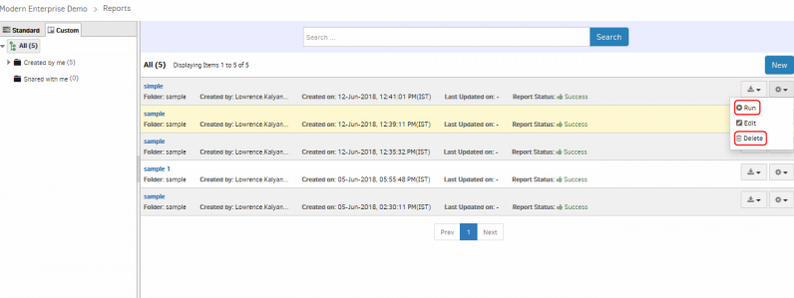
Edit, Run, and Delete features provided for Custom reports
The schedule can be re-run whenever the user needs.
Pagination feature provided for Custom reports
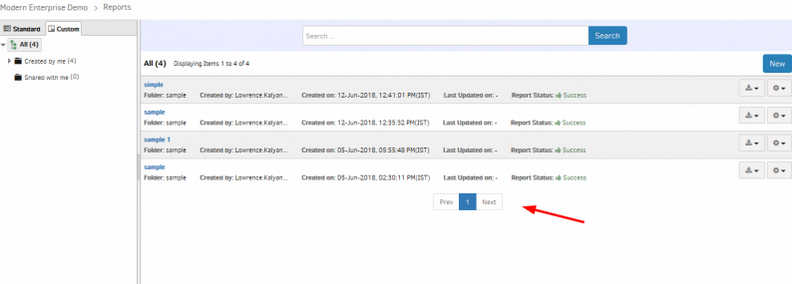
Pagination feature provided for Custom reports
Feature is provided for Custom Report Folder deletion
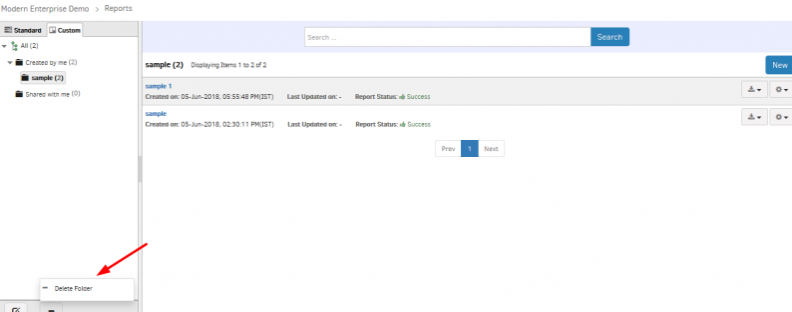
Feature is provided for Custom Report Folder deletion
Multi-sheet report can be generated with integration
Multi-sheet report can be generated with integration
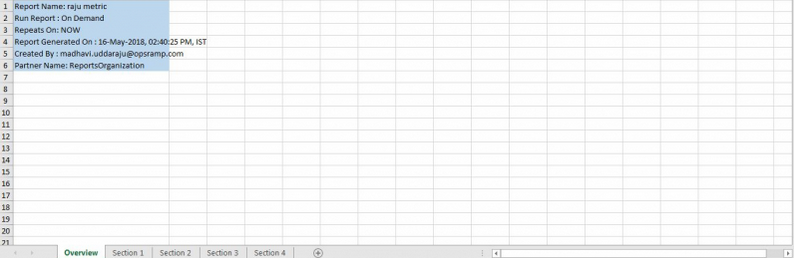
Multi-sheet report can be generated with integration
Multiple pages are integrated. Multi-sheet report can be generated.
Improved Availability Report
You can now report on the availability of resources for the previous day.
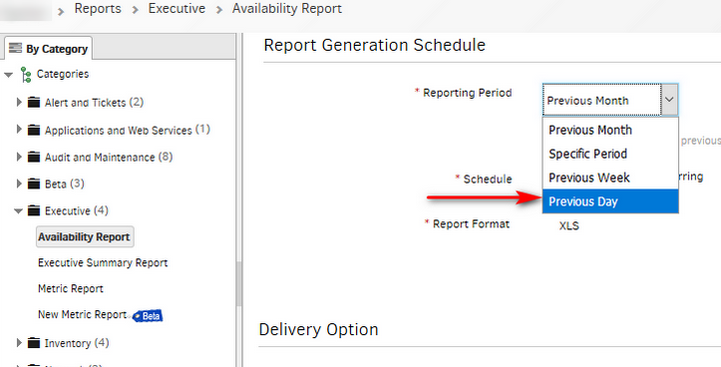
Improved Availability Report
Users can now avail a predefined period (Previous Day) in Report Generation Schedule of ‘Availability Report’ and ‘Metric Report’.
Increased Export Limits for Service Desk – Unresolved Tickets
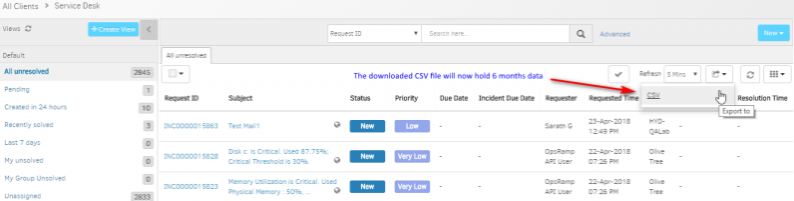
Increased Export Limits for Service Desk – Unresolved Tickets
Export functionality within Service Desk – Unresolved Tickets can now include 6 months data which was previously set to 1 month.
Reports that are no longer available
As announced previously, the following reports will no longer be available. Please use the recommended replacement reports below:
| Reports No Longer Available | Recommended Alternative |
|---|---|
| Storage Report | Custom reports |
| Virtualization Report | Custom reports |
| VoIP QoS Report | VoIP QoS reports based on Call Data Records are no longer supported |
Re-branding related changes
Change in agent installation directory
The OpsRamp agent will be installed in a new directory, starting with this:
| OS | Current directory | New directory |
|---|---|---|
| Windows | C:Program FilesVistaraAgent | C:Program FilesOpsRampAgent |
| Linux | /opt/vistara/agent | /opt/opsramp/agent/ |
Note: Agents that are already installed on your devices will continue to reside in their current directory – i.e.C:Program FilesVistaraAgent on Windows and /opt/vistara/agent on Linux. Only newly installed agents will be installed in the new directory.
Email Notifications Headers
The from address in email notifications will now be:
- from: no-reply@opsramp.com
- mailed-by: opsramp.com
Offline Alert Subject
- Vistara Agent offline will now appear as OpsRamp Agent Offline.
- Vistara Gateway offline will now appear as OpsRamp Gateway Offline.
Alert Source
The alert Source and Origin will now show OpsRamp in the filter values across the modules below:
- Alerts Browser and Reports
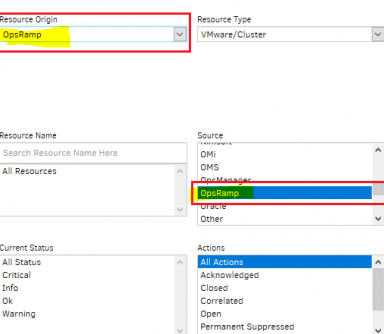
Alerts Browser and Reports
- Escalate Alert Policy
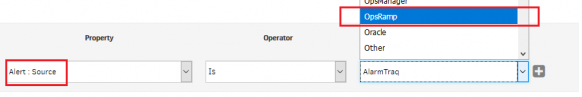
Escalate Alert Policy
URL for API Endpoint
The endpoint for custom URL is now opsramp.com. However, an old custom URL endpoint, for example, mycompany.vistarait.com will continue to work.
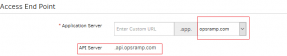
URL for API Endpoint
Email Integration Token
Email integrations will now be addressed to an email with the domain opsramp.com. Your existing email integrations using the old domain vistarait.com will continue to work.
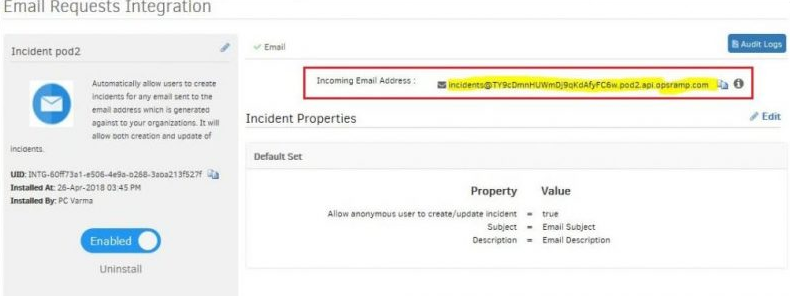
Email Integration Token
Footer-Branding changes for Escalate alert E-mail notifications
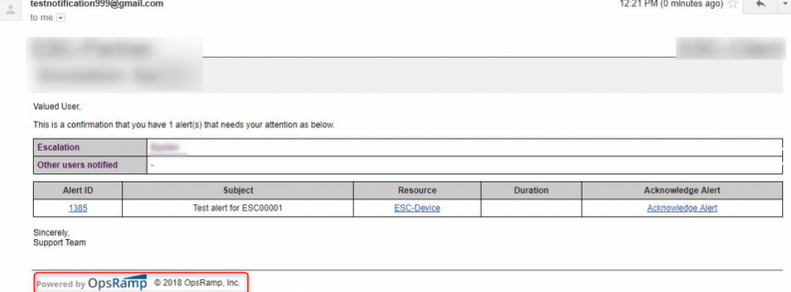
Footer-Branding changes for Escalate alert E-mail notifications
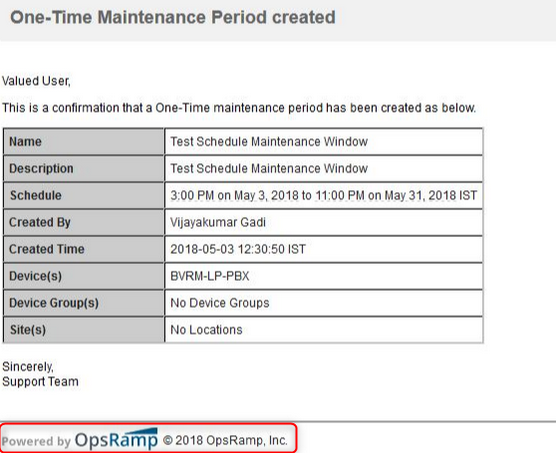
Footer-Branding changes for Escalate alert E-mail notifications
Escalate alert E-mail notifications now have the Powered By OpsRamp Logo with the Copyright and the year 2018.
Rebranding from Vistara to OpsRamp in Alert Browser filters
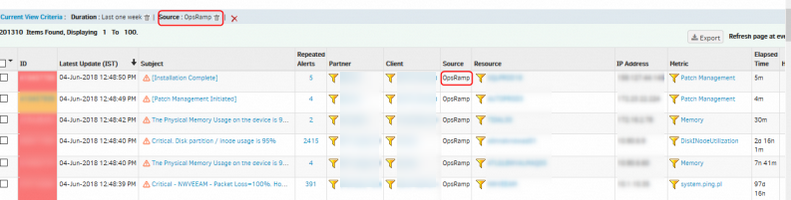
Rebranding from Vistara to OpsRamp in Alert Browser filters
Vistara has been renamed to OpsRamp in Source column and filter.
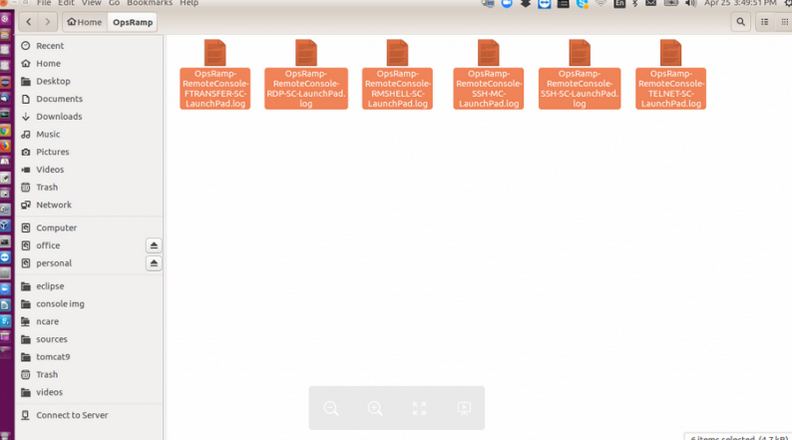
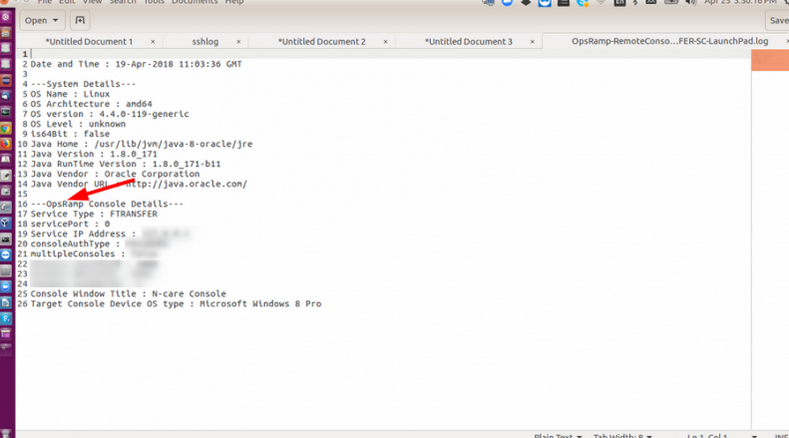
Rebranding done – Certificate, Publisher name, User home directory name, Log files, Log data, Remote console
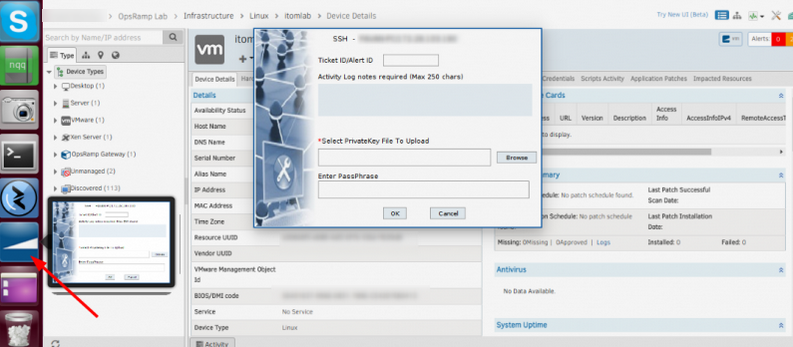
Rebranding done
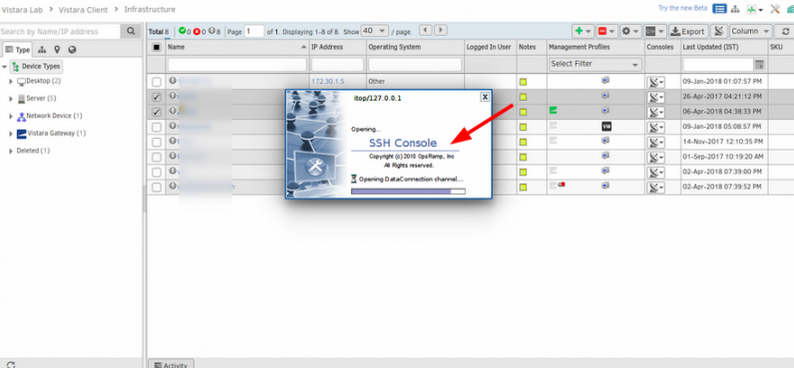
Rebranding done
Taskbar notification icon changed to OpsRamp icon. Splash Screen Copyright message updated with 2018 and OpsRamp Inc. updated.
Rebranding done
Rebranding done
Rebranding done
Rebranding done
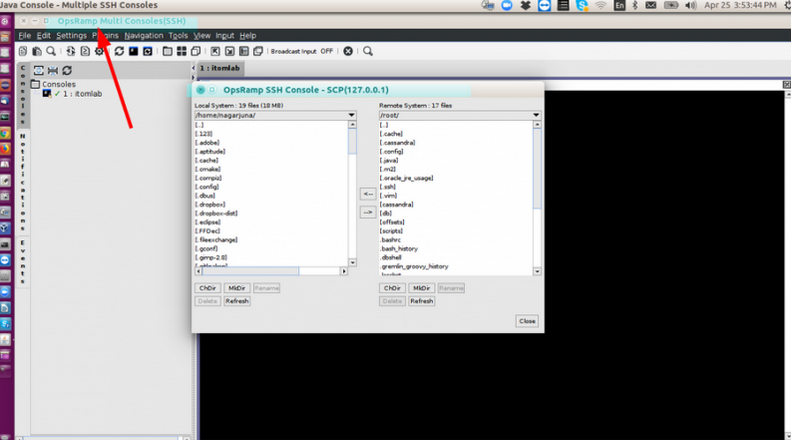
User home directory name changed to OpsRamp. Log files names start with OpsRamp. Log data also have Vistara replaced with OpsRamp. Remote console title bar replaced with OpsRamp.
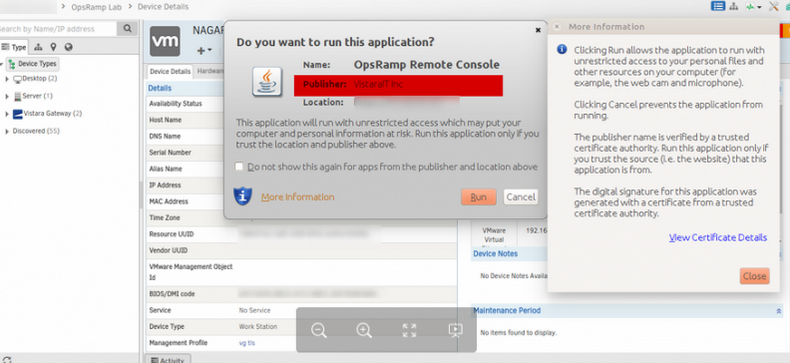
Rebranding done
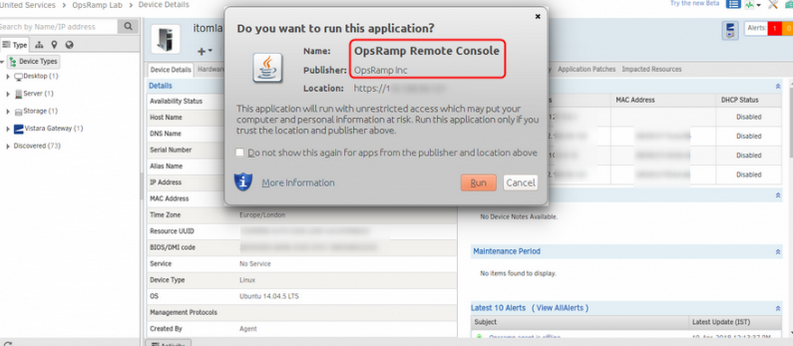
Rebranding done
Certificate issued with the name OpsRamp trusted certificate. Publisher name changed to OpsRamp Inc.
Branding changes done in all the Linux/Mac agent Instruction pages – Agent Download
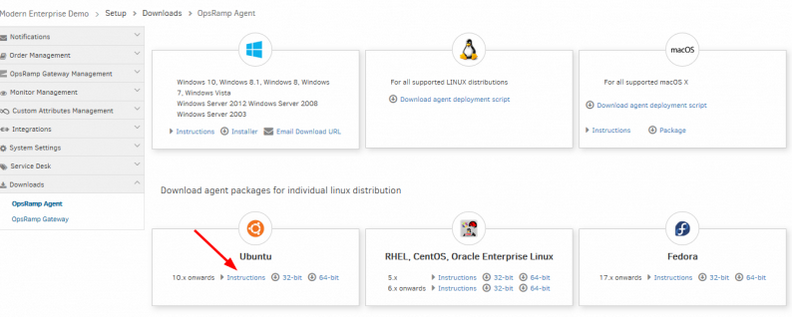
Branding changes done in all the Linux/Mac agent Instruction pages
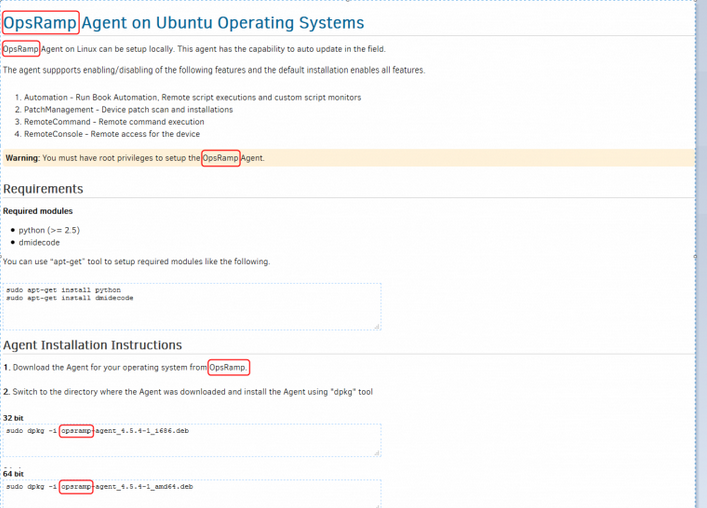
Branding changes done in all the Linux/Mac agent Instruction pages
Branding changes done (from Vistara to OpsRamp) in all the Linux/Mac agent Instruction pages – Agent Download.
Knowledge Management
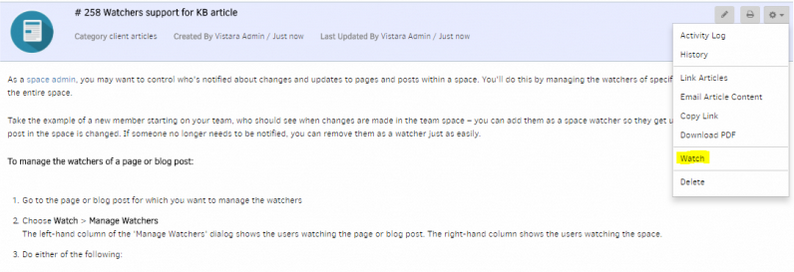
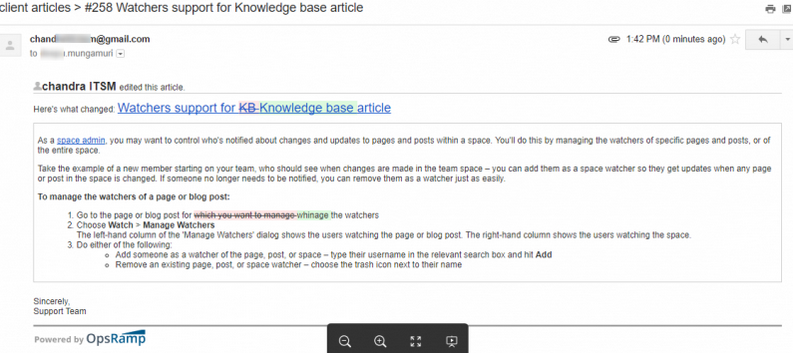
Watch feature for KB Article
Watch feature for KB Article
Watch feature for KB Article
Added watchers support to KB Article. Once the user updates the article (subject/content), an Email is triggered to all the watchers as a notification.
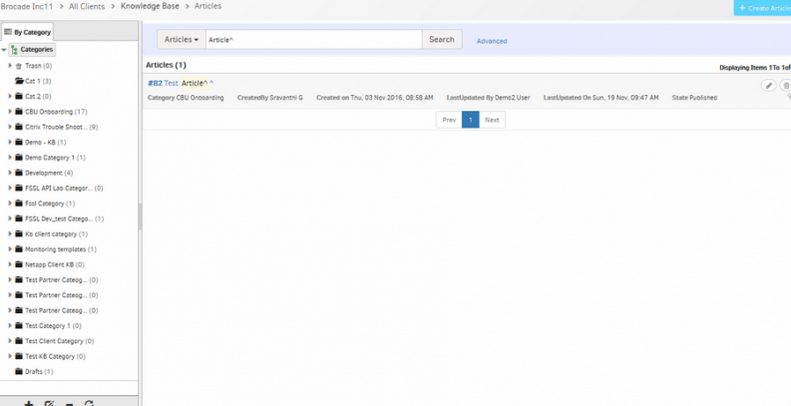
Search Articles or templates using special characters
Search Articles or templates using special characters
The user can now search Articles or Templates using Special Characters.
Number of matches for the search criteria per Article is displayed in KB search
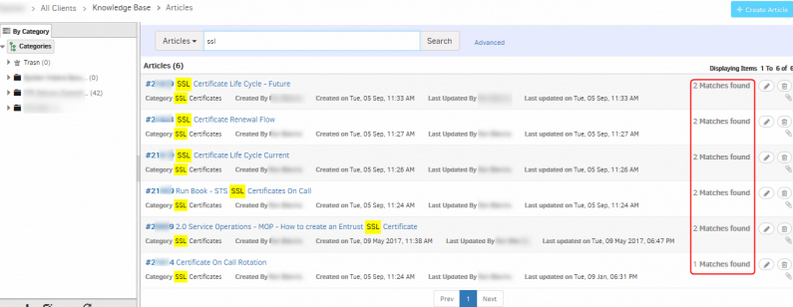
Number of matches for the search criteria per Article is displayed in KB search
Network Management
Improved Network Discovery
Network-based discovery now includes the following improvements:
- Improved performance: Discovery runs faster and also supports option to discover only SNMP devices, for even faster discovery.
- Discover devices across multiple hops.
- Include/exclude specific subnets from discovery.
Improved Network Discovery
Storage Management
Support for Hitachi Storage Arrays
OpsRamp now can discover and monitor Hitachi Virtual Storage Platform G800 storage arrays:
- Discovered information includes Array Group, Storage Pool, Volumes, Storage Processors, etc.
- Monitored metrics includes Operational Status, IOPs, capacity utilization.
Integration Plug-In support and Discovery provided for Hitachi VSP G800
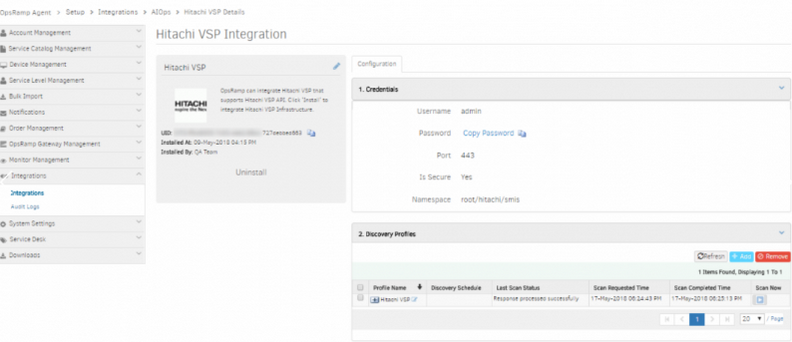
Integration Plug-In support and Discovery provided
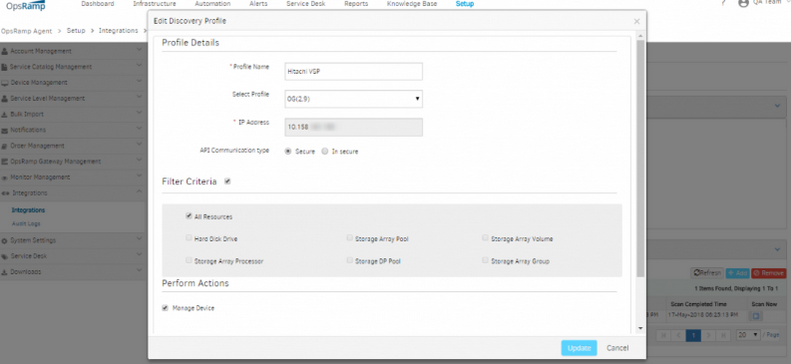
Integration Plug-In support and Discovery provided
Instance based monitoring support for NetApp Filer storage collector type
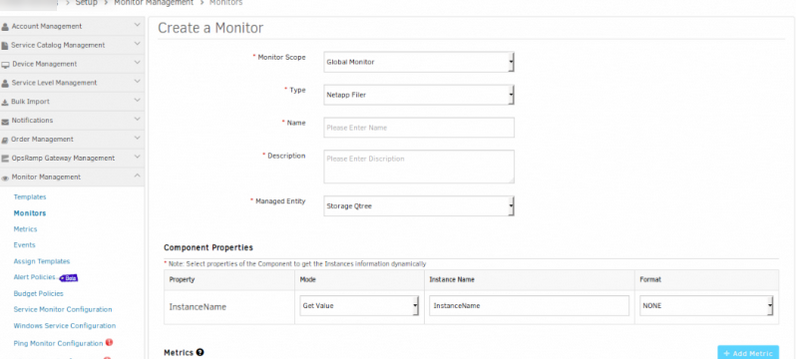
Instance based monitoring support for NetApp Filer storage collector type
Instance Based UI Support added for IBM Storwize
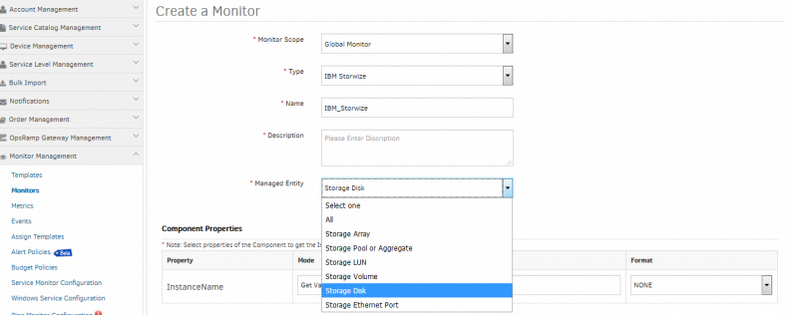
Instance Based UI Support added for IBM Storwize
Storage Disk and Storage Ethernet Port options have been added in Managed Entity for IBM Storwize.
Gateway Management
Checks to prevent accidental deletion of Gateways
A new UI prompt appears when you select Unmanage or Delete actions on an OpsRamp Gateway that is associated with a management profile. This is to prevent accidental deletion of a Gateway that is actively managing your environment.
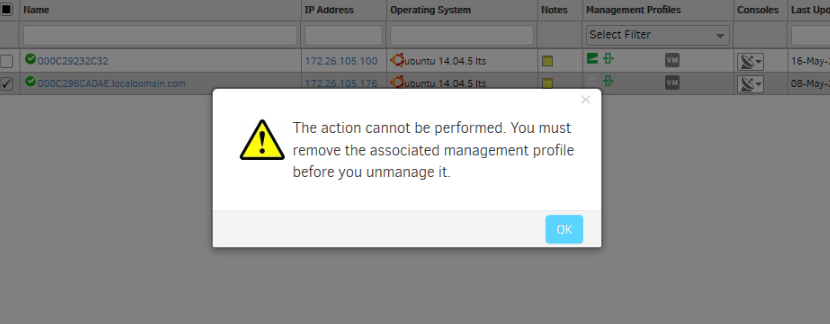
Checks to prevent accidental deletion of Gateways
Syslog export of Gateway’s logs
You can now configure the Gateway to export its logs via the syslog protocol, to an external syslog receiver. This enables you to collect and archive the Gateway’s logs for audit and compliance.
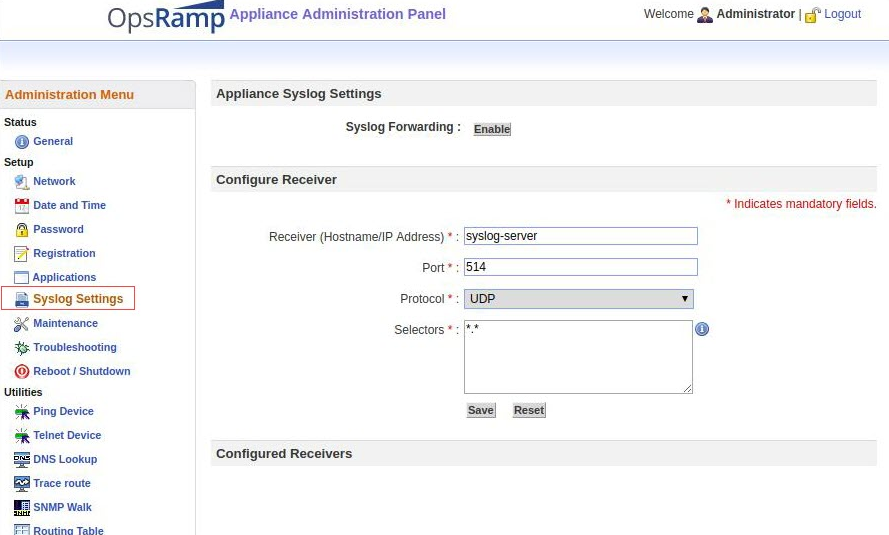
Syslog Export of Gateway’s Logs
Service Management
The following features have been enhanced:
Partner level Auto-close policy defined
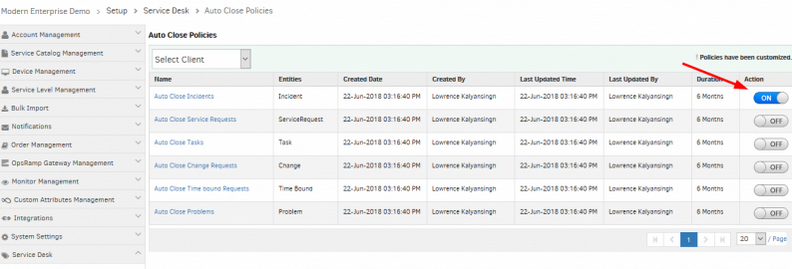
Partner level Auto-close policy defined
The partner level policies are defined for all entities. These are in Disabled mode by default.
If a Partner with Administration permission activates the policy, the Auto close policy is applied to all the clients under the Admin.
Note: The user can disable it by selecting the appropriate client and toggling the Action (ON/OFF) button, if the policy is not to be applied.
Default view for reopened tickets
Reopened service desk entities such as incidents, service requests and change requests can be easily accessed in the default view.
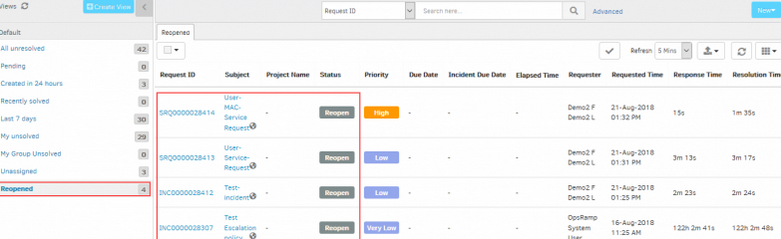
Default view for reopened tickets
Convert an Incident to Service Request
Service Desk Agents can now convert an Incident to a Service Request.
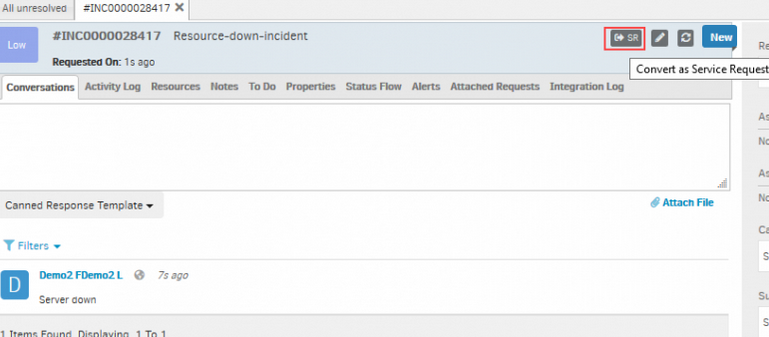
Convert an Incident to Service Request
Link Incident to Service Request and Link Service Request to Incident
Link Incident to Service Request
Service Desk Agents can now link Incidents to Service Requests. As Service Requests are resolved, Incidents will be automatically closed.
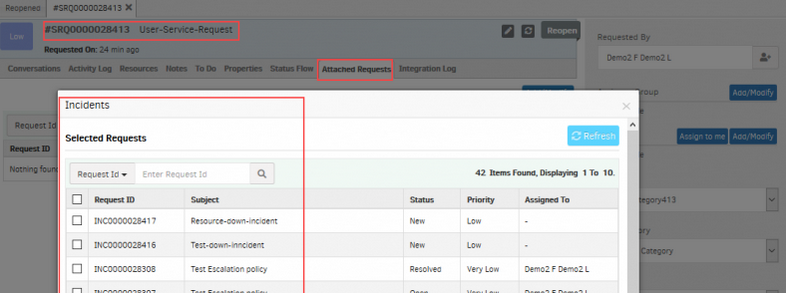
Link Incident to Service Request
Link Service Request to Incident
Service Desk Agents can now link Service Requests to Incidents. As Incidents are resolved and closed, Service Requests will also be closed.
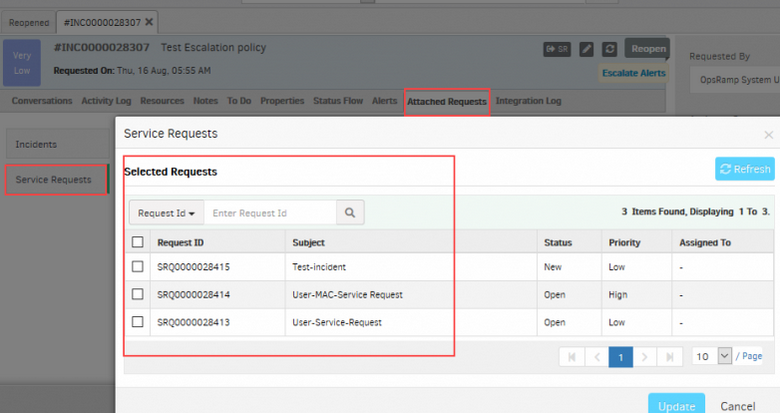
Link Service Request to Incident
See Help, for more details on how to link Incident to Service Request, and Service Request to Incident.
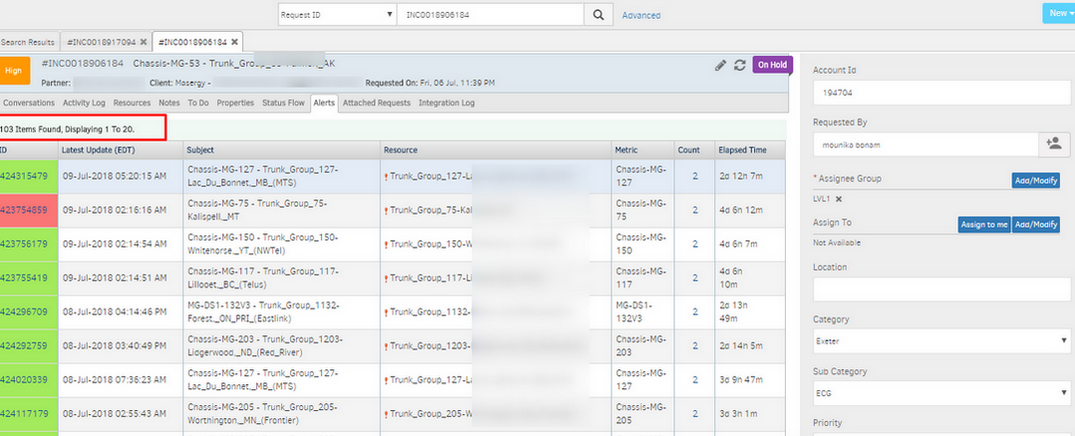
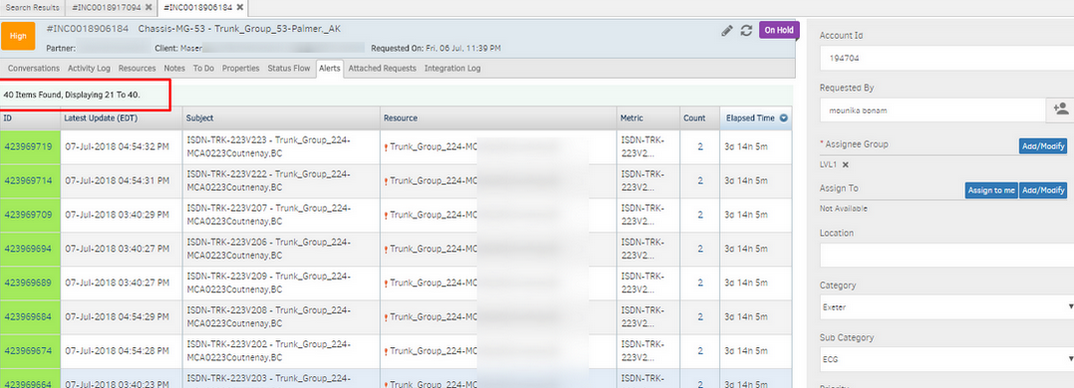
Unable to view all the alerts attached to OpsRamp ticket
Issue was found if the resourceName contains special characters like ‘&’. When the user clicks on the alerts tab in the ticket with 20 alerts/page to display it shows a total of 103 alerts attached to the ticket and multiple pages to display at the bottom. Once the user navigates to the 2nd page, it changes the total alerts attached to the ticket to 40 and display pages also changes to 2.
Unable to view all the alerts attached to OpsRamp ticket
Unable to view all the alerts attached to OpsRamp ticket
After the fix, it is showing the correct number of records.
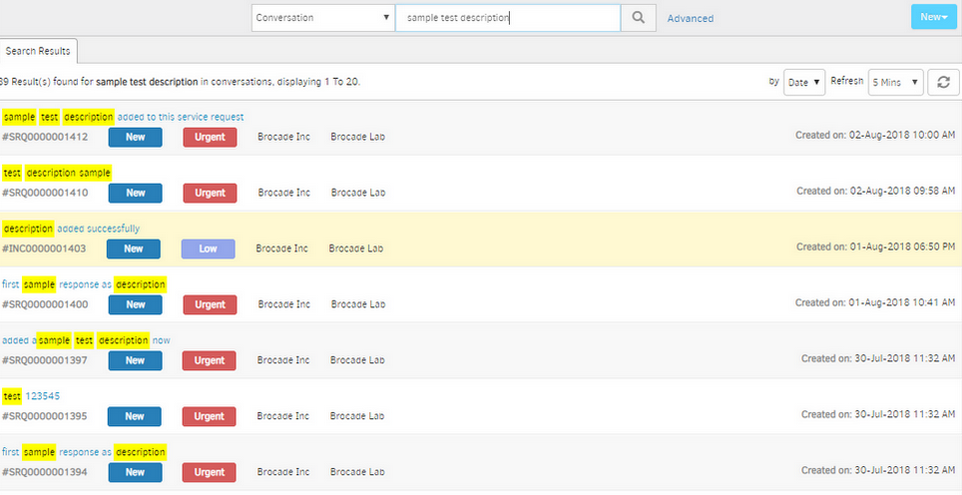
Issue in conversation search in Service Desk
Before fix: If the input is — sample test response It will give the results of tickets in which the conversation contains at least one word among the given input words (sample OR test OR response).
Issue in conversation search in Service Desk
After fix: case 1) If the input is enclosed in “”, ex: “sample test response” It will give the search results of tickets which contains all the words (sample AND test AND response) in the input text. case 2) If the input is NOT enclosed in “” – ex: sample test response It will give the results of tickets in which the conversation contains at least one word among the given input words (sample OR test OR response).
Integrations
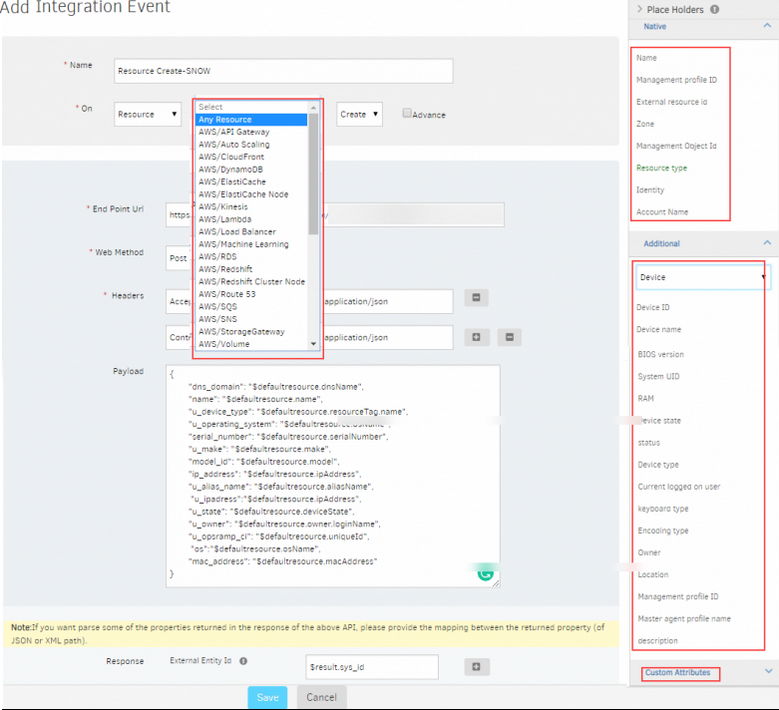
CMDB Integration
The outbound integration feature has been improved to support all OpsRamp managed resources. Following enhancements are implemented in this release:
- All custom attributes from partner and client level are included
- Expanded the support for generic placeholders and resource-specific CI attributes
CMDB Integration
See Help, for more details with ServiceNow Collaboration integration.
Google Stackdriver
You can now send alerts from Google Stackdriver to OpsRamp.
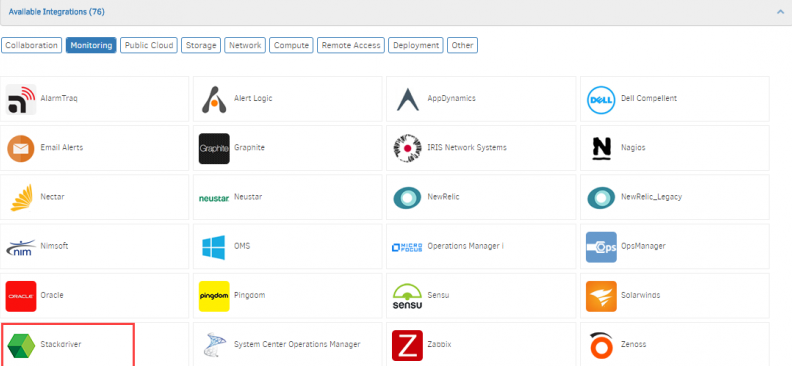
Google Stackdriver
Micro Focus Operations Manager i
You can now send events from OMi to OpsRamp.
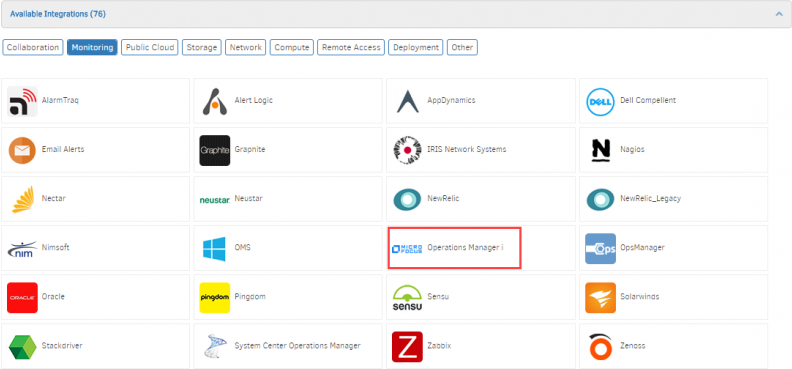
Micro Focus Operations Manager i
ManageEngine ServiceDesk Plus
You can now integrate tickets between ManageEngine ServiceDesk Plus and OpsRamp.
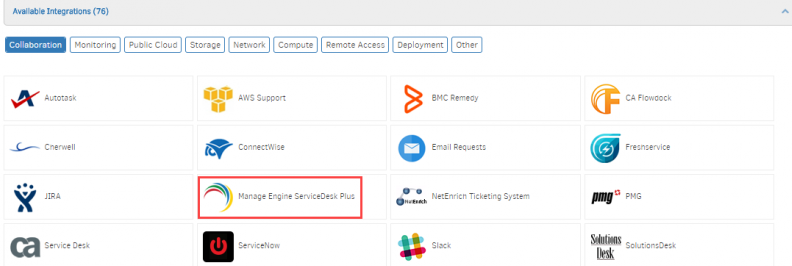
ManageEngine ServiceDesk Plus
Improved Parsing for Email based Ticket Integrations
You can now define rules based on patterns within the subject line of an incoming email.
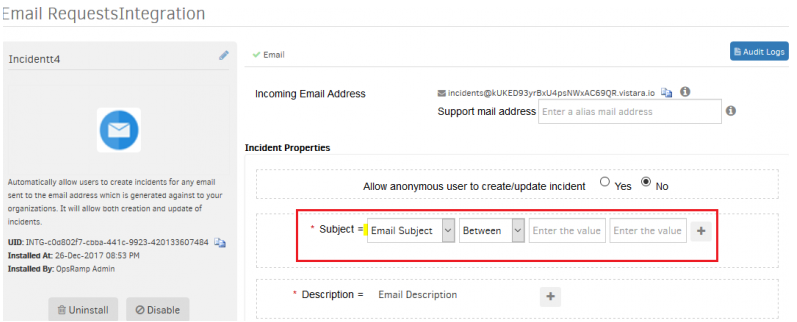
Improved parsing for Email based ticket Integrations
Removed Runscope from the available list of Integrations
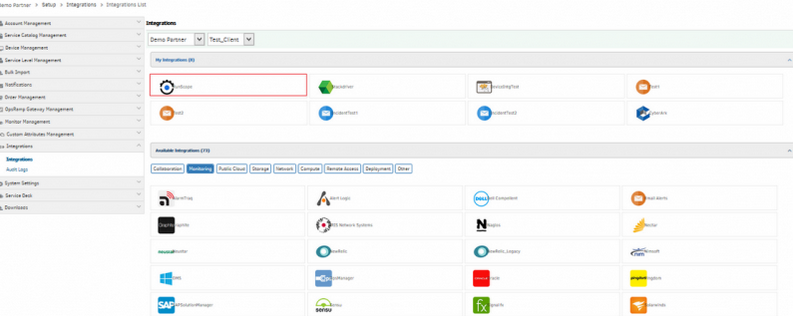
Removed Runscope from the available list of Integrations
Runscope is removed from the integrations list, as it is not supported anymore.
It will be available for the clients who have installed it prior to the update.
Additional tickets status options within custom integration
You can now define custom integrations that include more ticket status related conditions.
Additional tickets status options within custom integration
Improved audit log views within integrations
You can now scroll through audit logs within integrations.
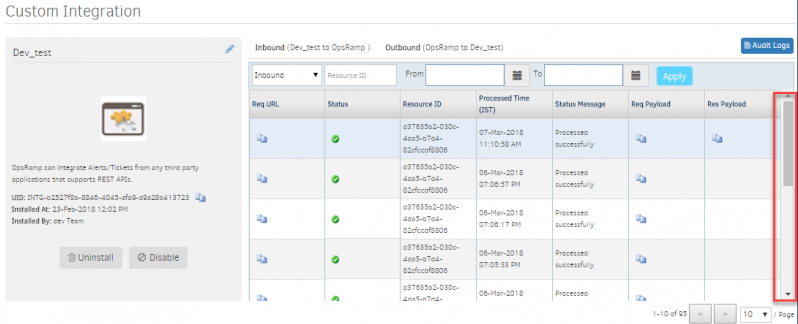
Improved audit log views within integrations
Limit the data for Alert Details Column in InBound Audit logs
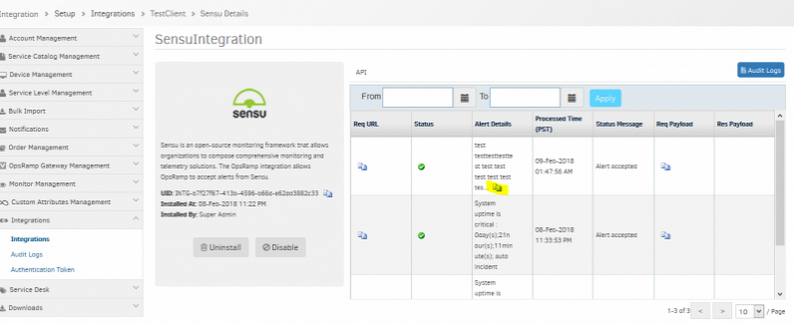
Limit the data for Alert Details Column
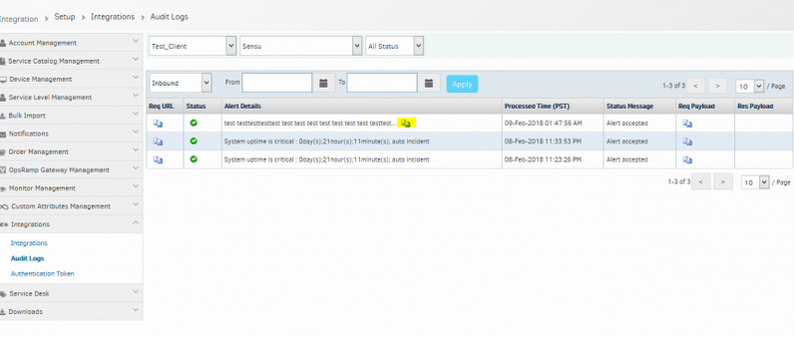
Limit the data for Alert Details Column
Data in the Alert Details column is restricted by character length 100.
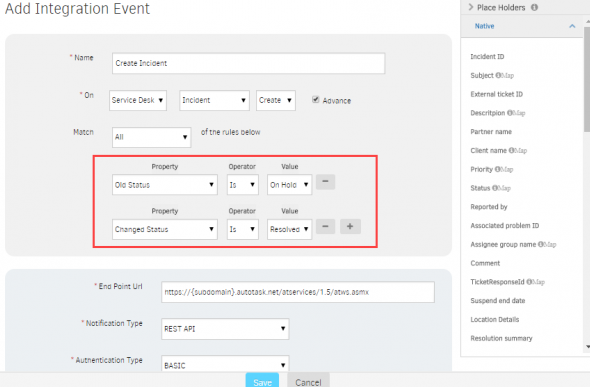
Status change filters added; Changed Status and Old Status properties
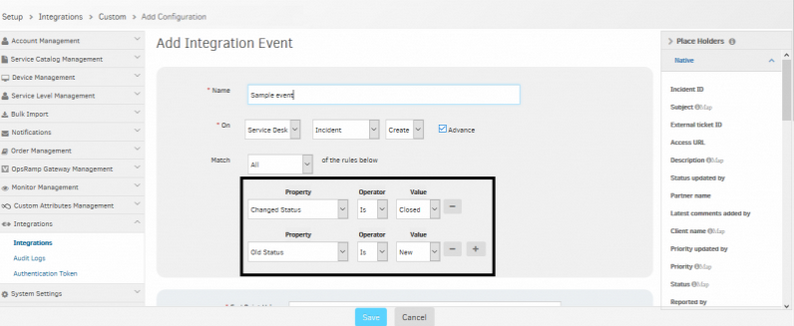
Status change filters added; Changed Status and Old Status properties
If the given Old Status and Changed Status policy match, then only integration happens.
For example, if the ticket status changes from New to Closed, this event fires.
Included Response Payload column in audit logs for all integrations
Global Level:
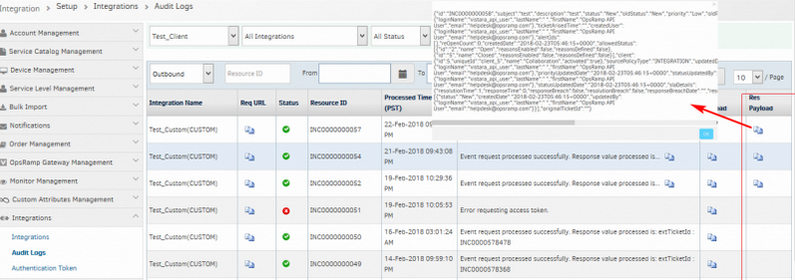
Global Level
Integration Level:
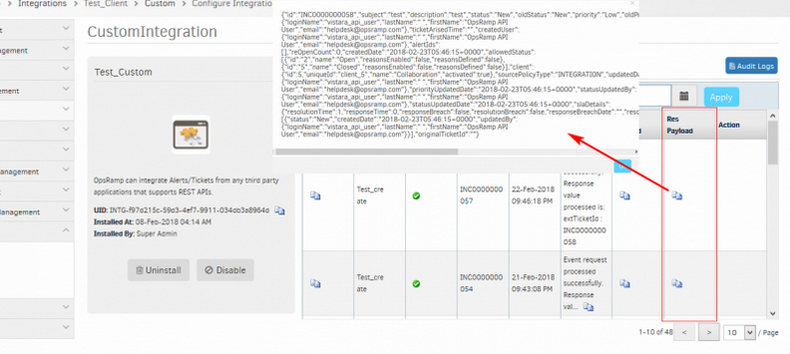
Integration Level
Ticket Level:
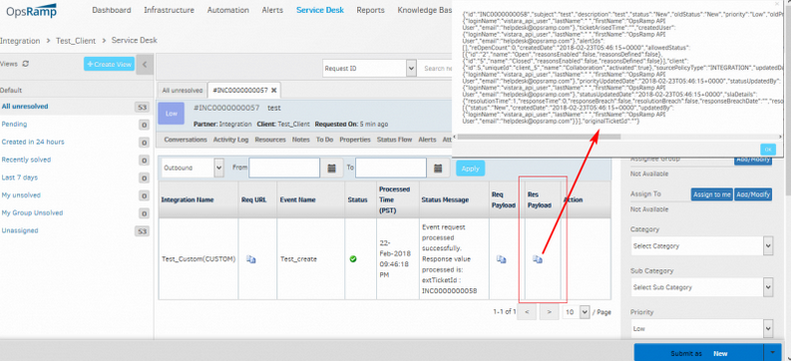
Ticket Level
The response payload column is added to ‘Integration Level Audit Logs’, ‘Ticket Level Audit Logs’ and ‘Global Level Audit Logs’ of outbound section.
When devices are created manually, payload for State is Blank
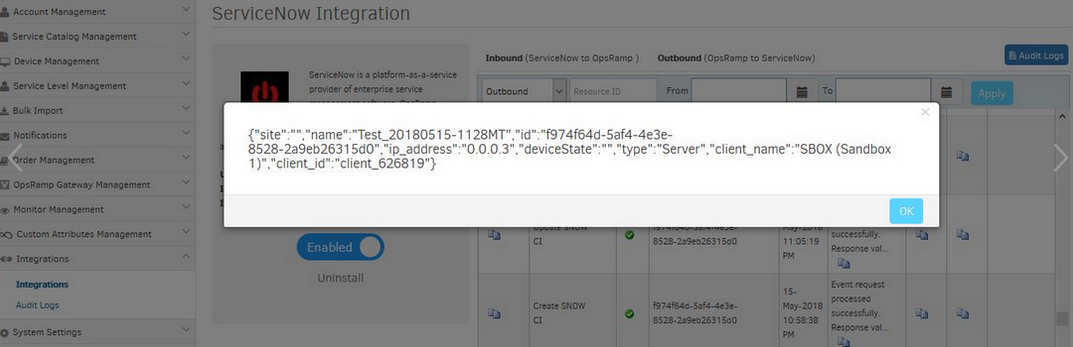
When devices are created manually, payload for State is Blank
Issue is fixed. The payload for State is Active.
Support provided to install multiple Kubernetes integrations
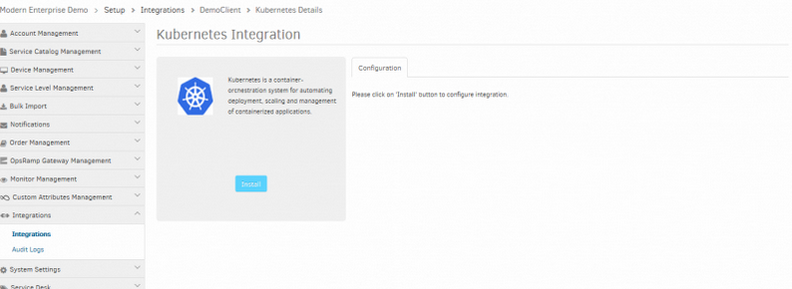
Support provided to install multiple Kubernetes integrations
Role Based Access Control
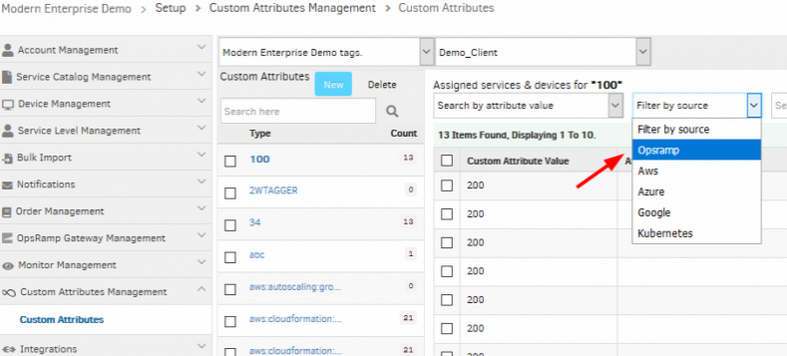
New permission for custom attributes
The new Custom Attributes permission allows administrators to control which users can manage custom attributes. Prior to this release, the Device Manage and Administration permissions were required to manage custom attributes.
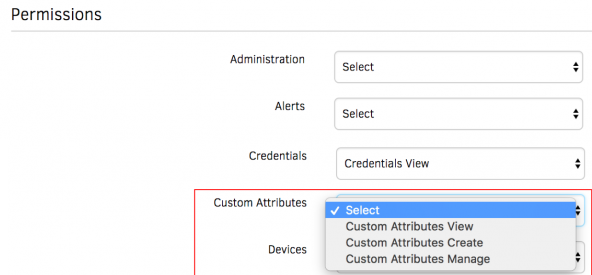
New permission for custom attributes
Note: Custom Attribute permission allows a user to assign Custom Attributes to devices only if the users are assigned Device Edit or Manage permission.
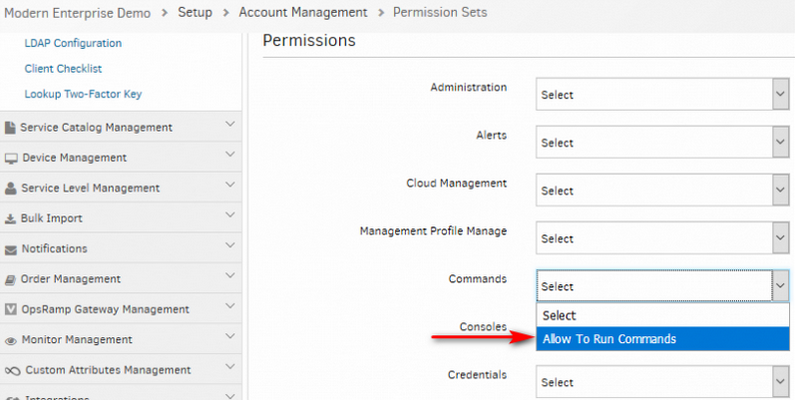
New permission to run commands on a resource
The new permission Commands allows a user to execute commands on a resource.
Note:
- Prior to this release, a user was required to have the Devices: Device Manage permission to run commands on a device.
- Starting with this release:
- A user must be assigned Commands permission to execute commands on a device.
- The Device Manage permission no longer applies to commands.
- A user must be assigned Commands permission to execute Commands to run Runbook scripts on a device.
New permission to run commands
Audit Logging
You can now see Audit report for below additional components of the platform
- Service Desk
- Alerts
- Schedule Maintenance
- Automation
- Synthetics
- Widgets
- Dashboards
Miscellaneous
Node level controls like expand node, highlight node, zoom in and zoom out are implemented
Node level controls are implemented
Introduced a new collector named Application as a new Gateway G2 monitor collector type
This enables creating the Application monitors dynamically.
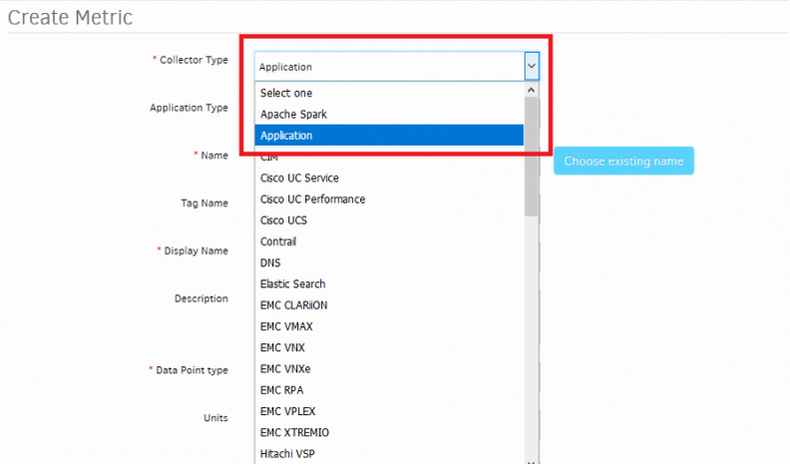
Introduced a new collector named Application
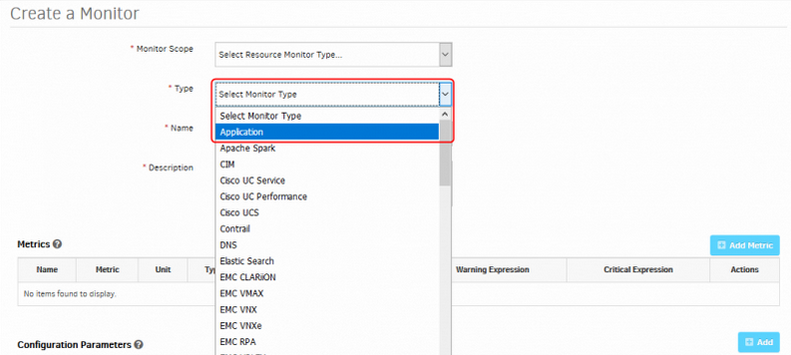
Introduced a new collector named Application
Log File Monitor – RegEx Supported with Japanese Characters
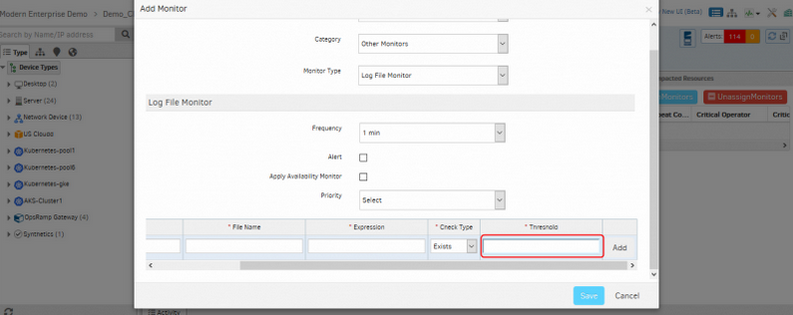
RegEx Supported with Japanese Characters
G1 log file monitor – Expression supports RegEx, Japanese characters. Threshold column is added. If the search string is greater than or equal to the given threshold limit, then an alert is triggered.
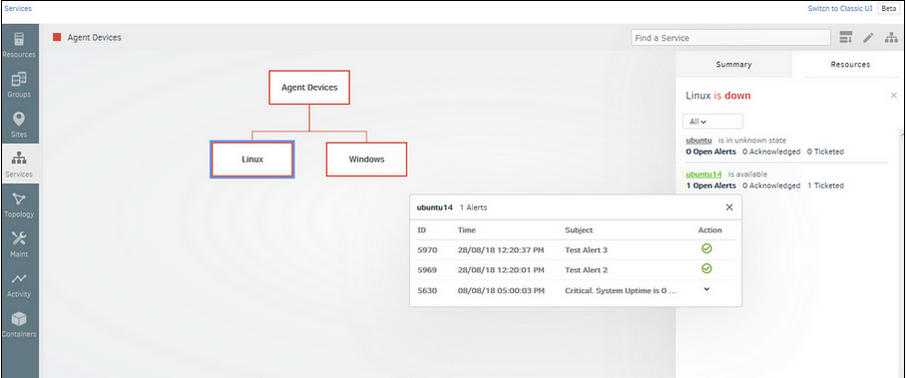
User can take actions from within the Service Group side pane
User can view the alerts that are causing the device to be down and take actions from within the Service Group side pane.
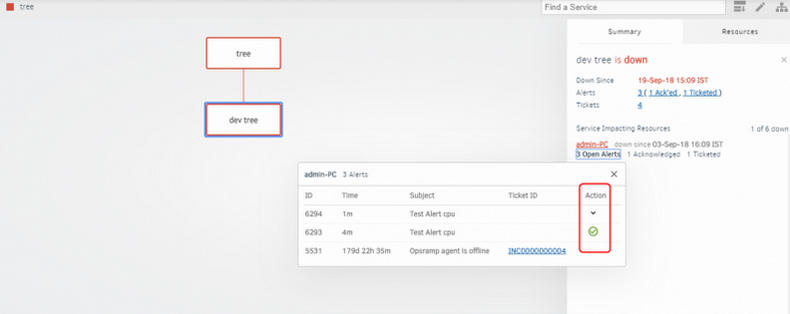
Take actions from within the Service Group
‘View All alerts’ option provided in the NEW UI for the individual devices
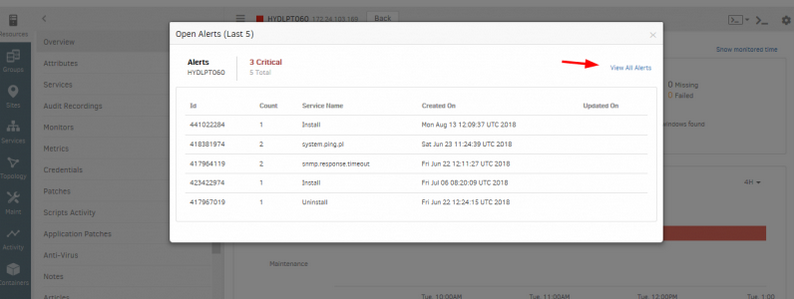
‘View All alerts’ option provided in the New UI
In Overview Page of New UI (Beta), when clicked on the Alerts count, there was a “For more info Go to Alert Browser” link. Renamed this link to “View All Alerts” and launched a new tab with Alerts specific to this resource (just like in Classic UI).
Added Y-Axis units for Exchange Graphs
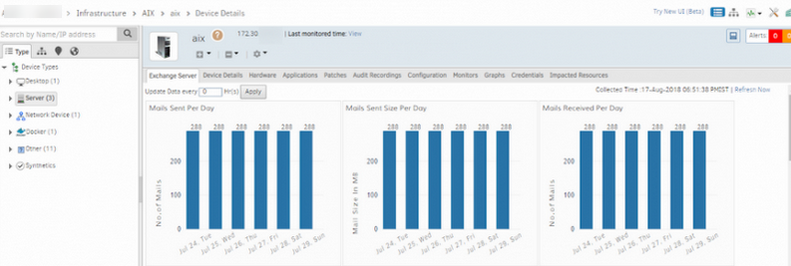
Added Y-Axis units for Exchange Graphs
X-axis represents the Days, Y-Axis represents the number of E-mails.
Enhanced the Agent download feature
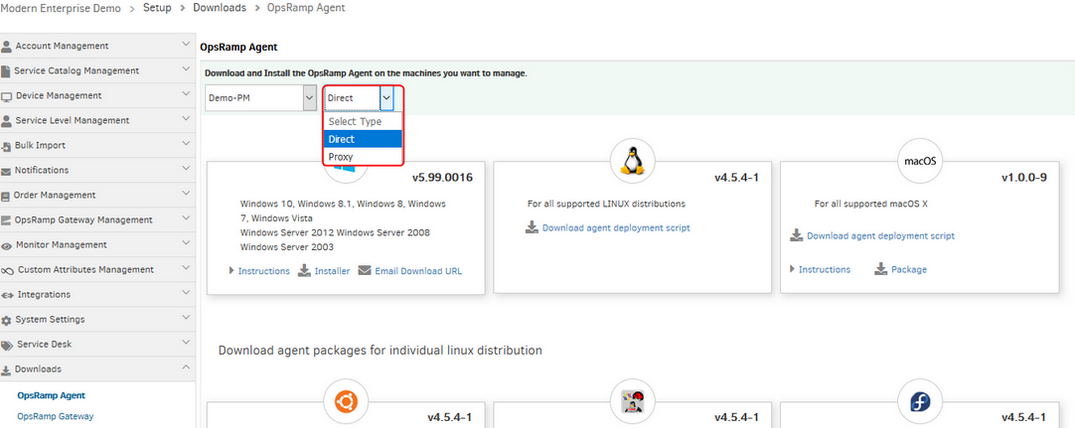
Enhanced the Agent download feature
User can download Proxy agent and Direct agent by selecting from the respective dropdown buttons and also can send E-mails.
Provided Device Tree and device inventory support for Nutanix device type
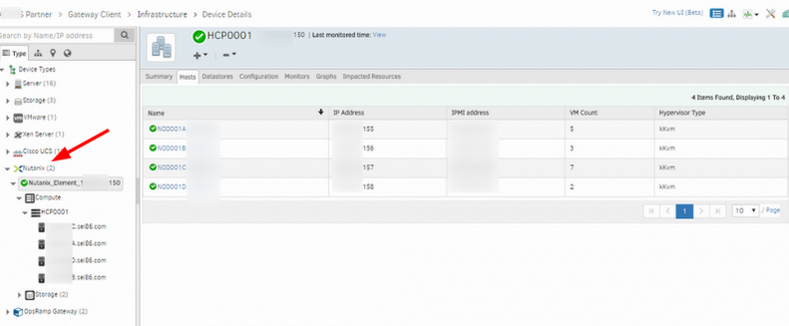
Provided Device Tree and device inventory support for Nutanix device type
Added support for new collector type Nutanix in G2 metric and monitor creation at cloud end
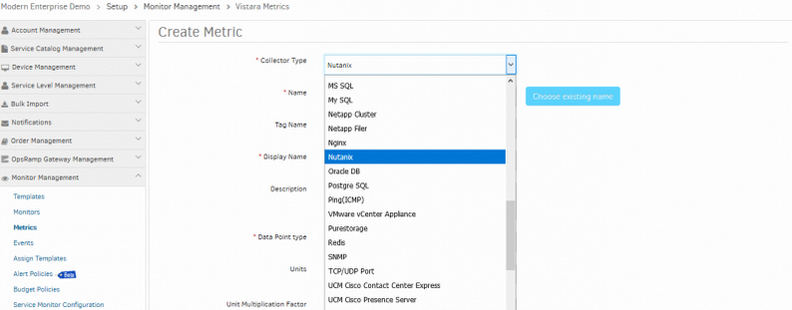
Added support for new collector type Nutanix
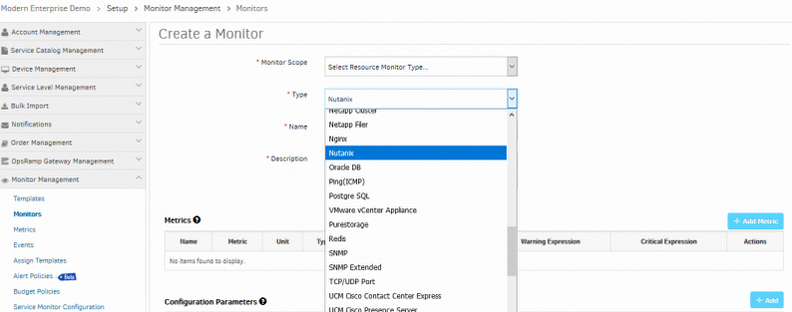
Added support for new collector type Nutanix
Added new filter for firmware upgrade
Added new filter for firmware upgrade with Allow, Available and Up-to-date options for NSG admin account.
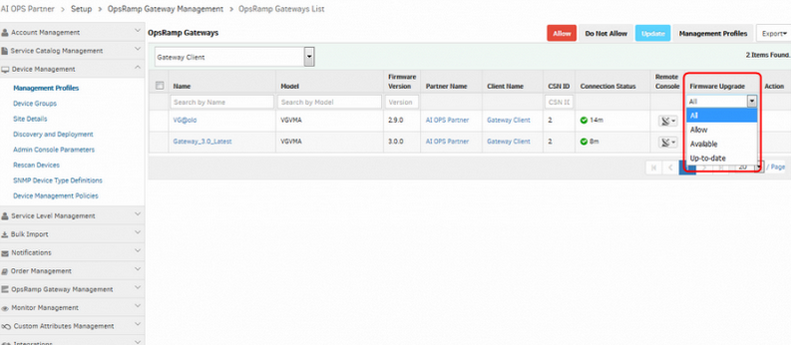
Added new filter for firmware upgrade
‘Applied Time’ column is added for Monitors and Monitoring templates in the Infrastructure page
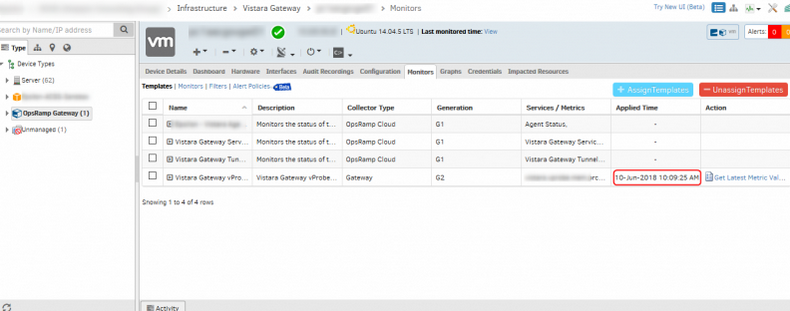
‘Applied Time’ column is added for Monitors and Monitoring templates
This column provides information about the date/time monitoring templates and/or individual monitors were applied on the device.
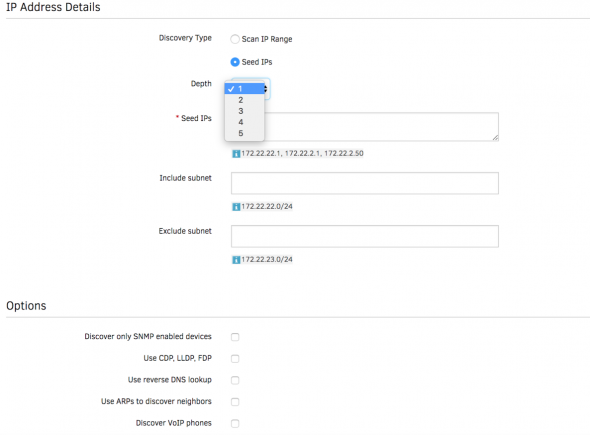
Added new config parameters in SNMP Discovery Profile
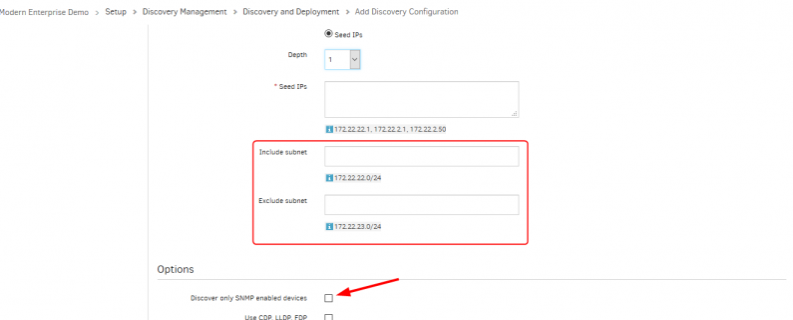
Added new config parameters in SNMP Discovery Profile
Added Include Subnet and Exclude Subnet options for Seed discovery.
Added Discover only SNMP enabled devices option for IP range.
Multiple sets of credentials are allowed in a single Network Discovery Profile
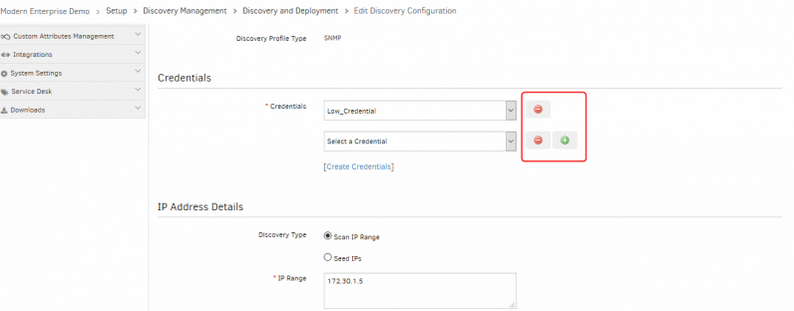
Multiple sets of credentials are allowed in a single network discovery profile
Provided AWS Network Load Balancer Support and Monitoring
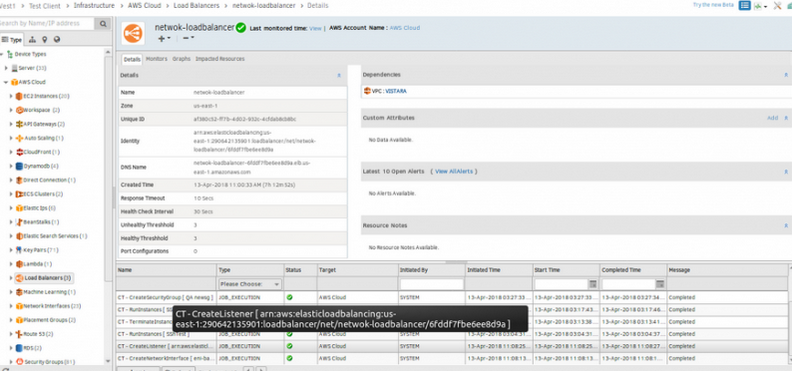
Provided AWS Network Load Balancer Support and Monitoring
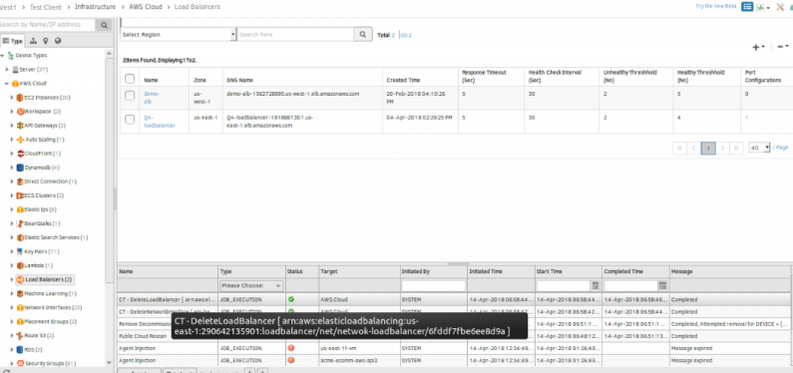
Provided AWS Network Load Balancer Support and Monitoring
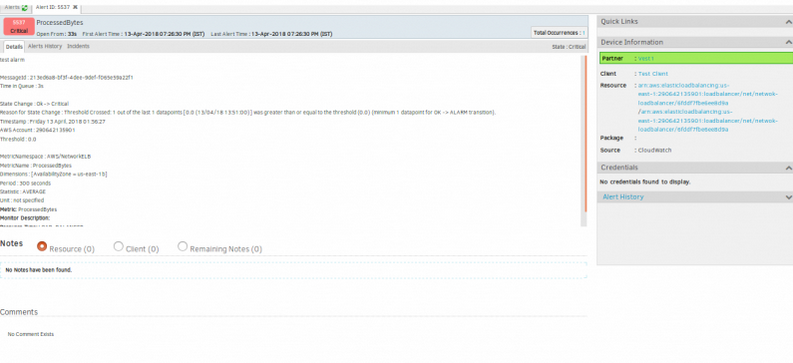
Provided AWS Network Load Balancer Support and Monitoring
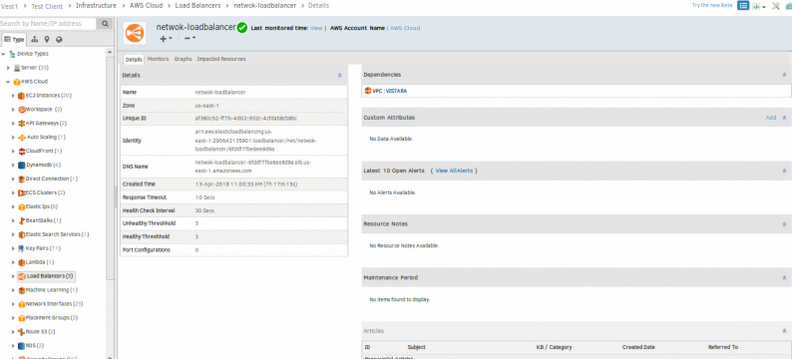
Provided AWS Network Load Balancer Support and Monitoring
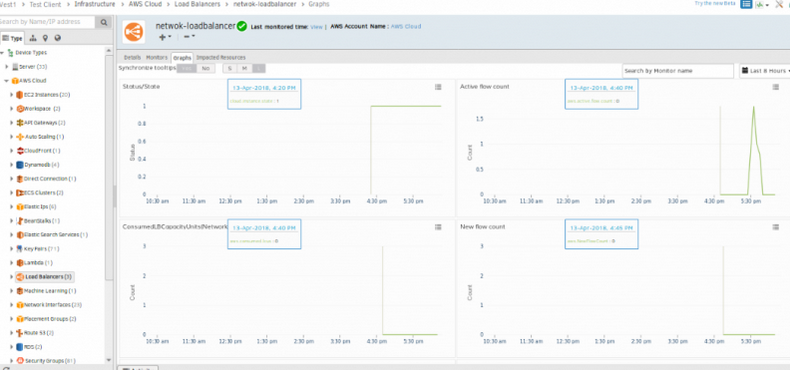
Provided AWS Network Load Balancer Support and Monitoring
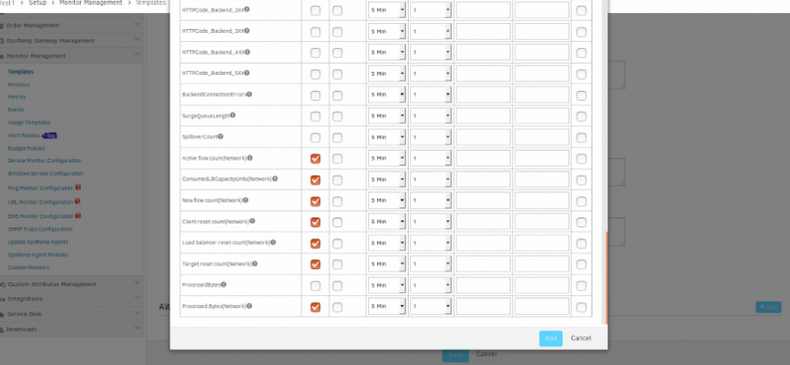
Provided AWS Network Load Balancer Support and Monitoring
The functionality support added for AWS Network Load Balancer are: Discovery, Monitoring, CloudWatch Alarms and CloudTrail Events.
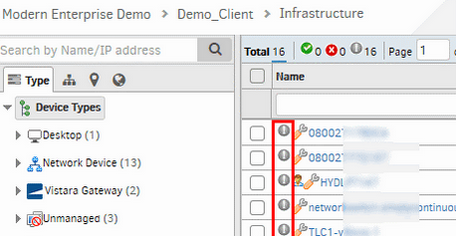
OpsRamp Agent icon color indicators
OpsRamp Agent icon color indicators
OpsRamp Agent icon is Blue in color when it is Online. The Agent icon is grey in color when it is Offline.
Partner and client level users can view the 2nd Gen. SNMP global monitors
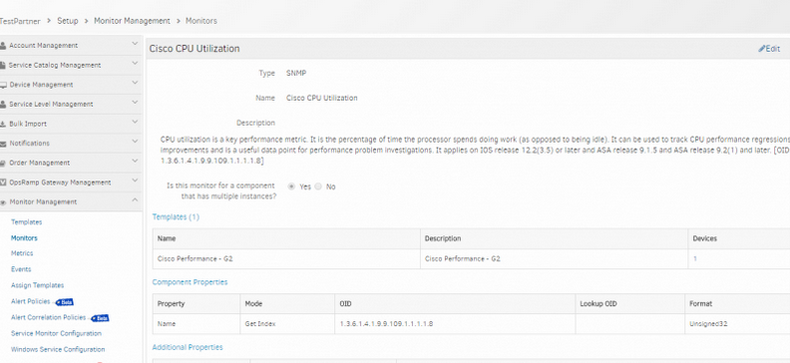
Partner and client level users can view the 2nd Gen. SNMP global monitors
Previously, only the service provider user could see the global, partner and client level G2 monitors and metrics.
API key and Registration Server Host Name (cloud URL) have been added on the View Management Profile page
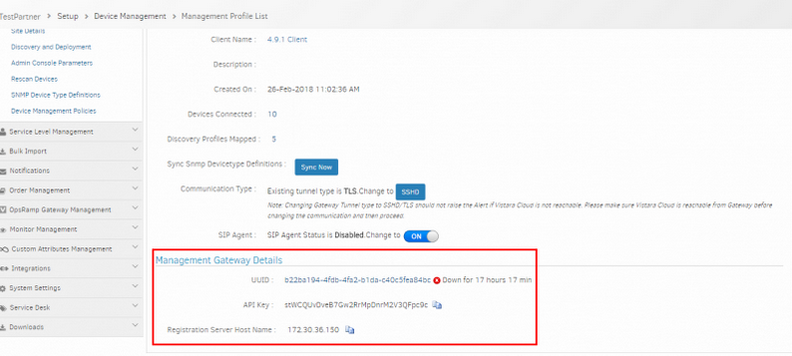
API key and Registration Server Host Name (cloud URL) added on the View Management Profile page
The secret key is not added due to security concerns.
Removed legacy V1 API Support
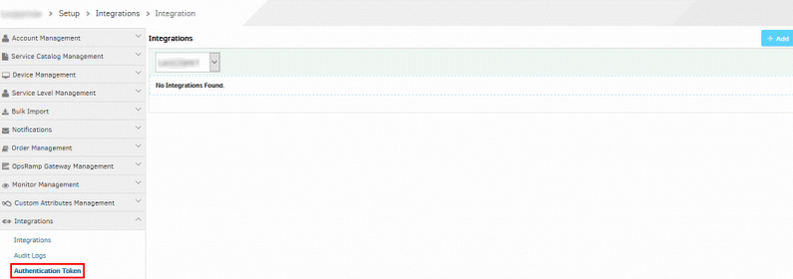
Removed legacy V1 API Support
The Authentication Token link is removed.
The v1 APIs and its dependencies (CXF and RMM Integrations) are also removed.
APIs
- Schedule Maintenance API: New Add/Remove/Get resources from a schedule maintenance window APIs are added and current APIs have been updated to provide more options such as Alert conditions, Repetitive schedule and unique ID
- Patch Feed API: New API to apply custom patch ratings to a Patch Feed.
- Service Group API: Service group APIs have been updated to provide consistent and faster performance
- Decommission Resources API: Users can now search, retrieve and programmatically decommission resources
- Custom Attributes API : In Get Custom Attributes by Entities API, tagSource attribute will reflect as OpsRamp (instead of Vistara) for OpsRamp created custom attributes.
- Search Alerts API: You can now get information on alerts correlated to an Inference.
- Get Alert Views: You can now get data information on private and shared alert views.
API to Activate/Deactivate User
- You can now activate and deactivate users using POST Activate/Deactivate User API.
Inference Model API
- You can now build inference model using Inference Model API.
Updated API
- You can now get the Business impact and Urgency in the Get Escalate Alert Payload.
- Get Alert API : The response payload attribute now consists of managedByOpsRamp: false/true
- Service Groups APIs have been improved.