Release Date: December 2018
User Interface
The undefined icon indicator and count of storage accounts are missing in new UI
In the Classic UI, the indicator and the storage accounts count are available.

Undefined icon indicator and the count of storage accounts are missing in the new UI
Issue is fixed. The count of storage accounts and the undefined icon indicator are displayed in the New UI.
The Uptime, Downtime, Average Latency and Last updated time are missing
The Uptime, Downtime, Average Latency and Last updated time are missing in the Synthetic overview page in the new UI.
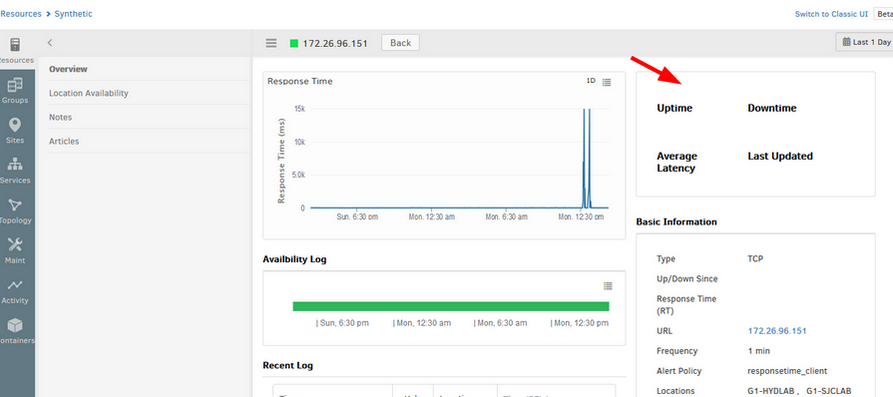
The Uptime, Downtime, Average Latency and Last updated time are missing
Issue is fixed. Able to view the details like Uptime, Downtime, Average Latency and Last updated time in the Synthetics overview page in the new UI.
Unable to view Availability details even though device has Availability monitor assigned, in the new UI
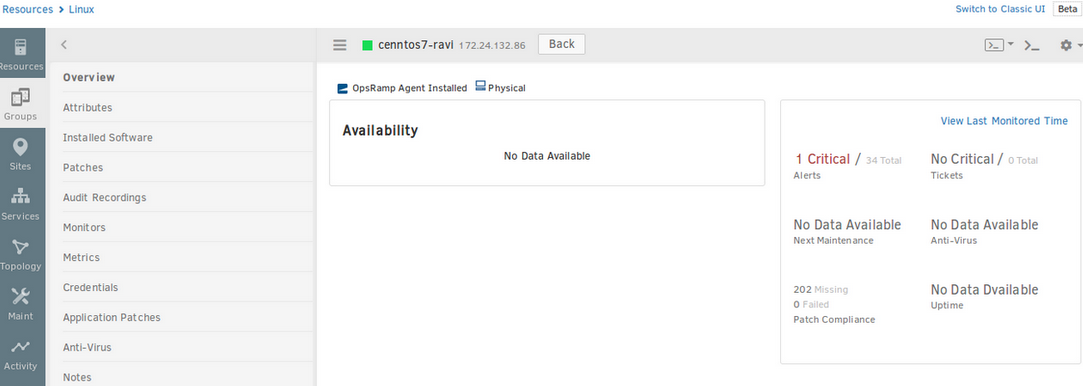
Unable to view Availability details even though device has Availability monitor assigned
Issue is fixed.
Availability details are displayed when the device has Availability monitor assigned, in the Overview page, in the new UI.
Graphs are not displaying timeframe correctly when timeframe is changed for all metrics at a time
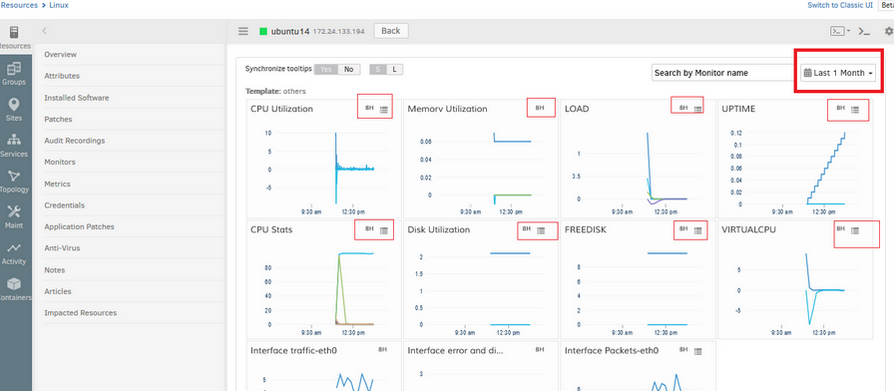
Graphs are not displaying timeframe correctly
Issue is fixed.
Graphs are displaying graphs and timeframe correctly when timeframe is changed for all metrics using the dropdown available at the top right corner of the page.
Model column is displaying incorrect value, in Resource Group Listing
Also, CPU, Memory, Storage, etc. columns are empty

Model column is displaying incorrect value
Issue is fixed. The columns are displaying correct values in the Resource Group listing.
CPU, Memory, Storage, and other columns are displaying values correctly.
Integrations
You can now use ticket description text with tags “« »” in the inbound payload.
IP address field is missing while installing private cloud integrations
Unable to save the integration for selected resources.
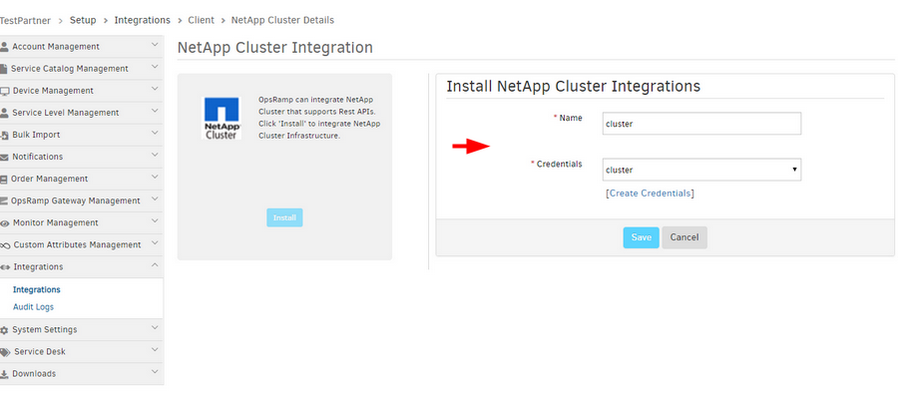
IP address field is missing while installing private cloud integrations
Issue is fixed. Able to view IP address field while installing private cloud integrations, and able to install integrations.
Automation
User can now search for resources when applying an RBA script
This makes it easy to find resources to apply an RBA script.
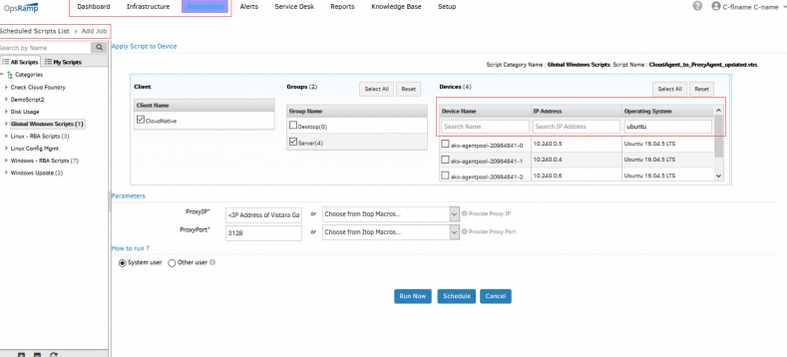
User can now search for resources when applying an RBA script
Cloud Management
AWS storage Gateways with volumes are now discovered
Prior to this release, volume based Gateways were not discoverable.
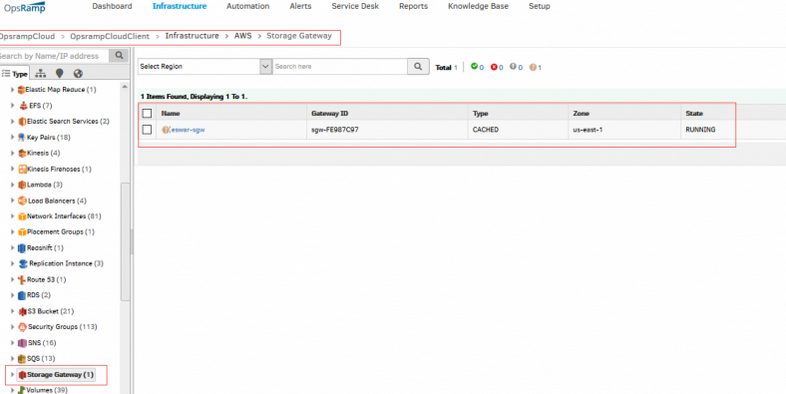
AWS storage Gateways with volumes are now discovered
Alert Management
Hovering over the lines of Disk Utilization Graph, only one value is shown
The graph shows two lines with one for actual value and the other for the forecasted value. Hovering over the lines, it shows only one value, instead of both the values.
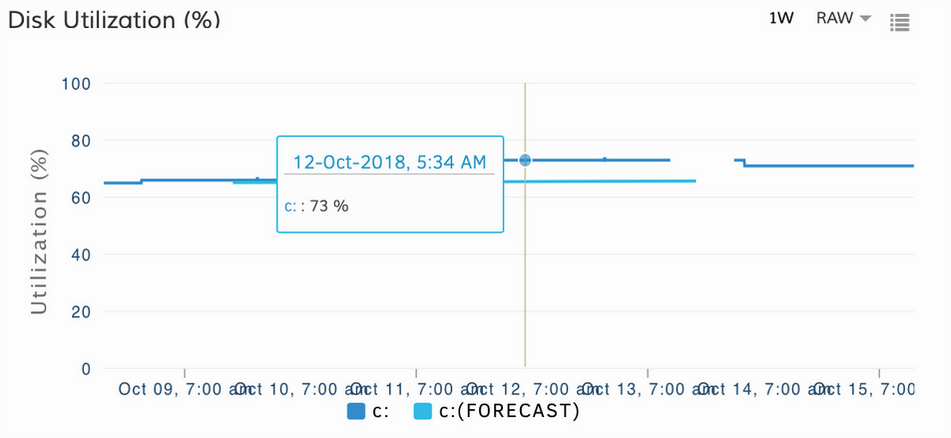
Hovering over the lines, it shows only one value, instead of both the values
Issue is fixed.
Values are displayed correctly on hovering over the lines of Disk Utilization graph for forecast.
Reports
- The Availability report now shows the alert ID for each planned/unplanned downtime period. This makes it easy to attribute each downtime incident to its cause.
- The Patch report now shows the cloud integration name, making it easy to identify cloud accounts impacted by unpatched devices.
Miscellaneous
Ability to filter with Serial Number in Advanced Search
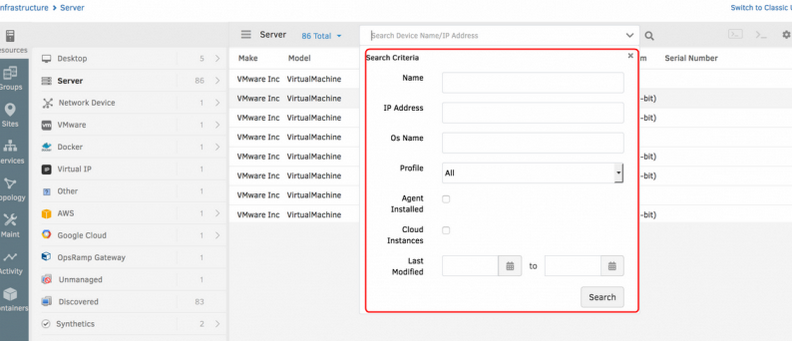
Ability to filter with Serial Number in Advanced Search
Serial number is added to Advance Search options.
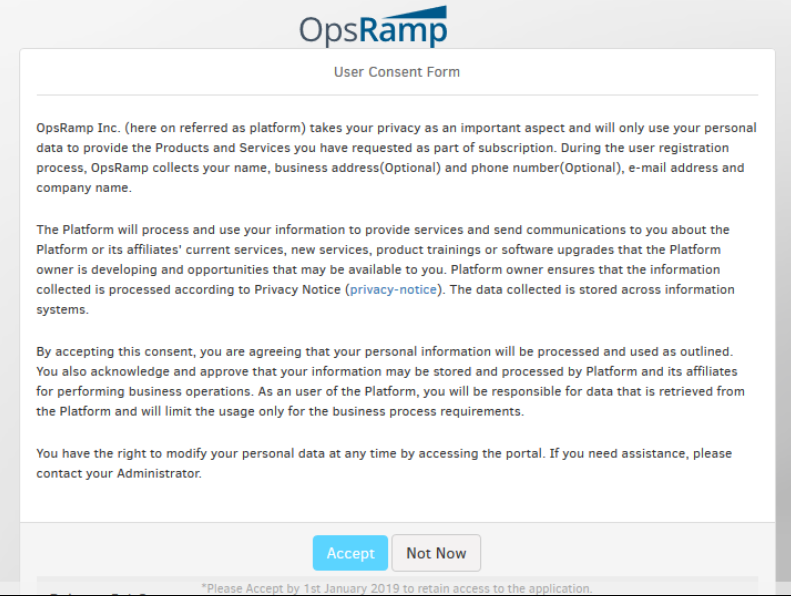
User Consent for GDPR compliance policies
Starting with this release, upon login, you will see a prompt to review and accept OpsRamp’s standard data collection and usage policies. OpsRamp needs this consent to comply with Global Data Protection and Data Protection (GDPR) requirements.
Note: This is not a change to OpsRamp’s existing data usage and privacy policies - this form is to simply establish user consent to existing policies, per GDPR requirements.
