Release Date: January 2019
User Interface
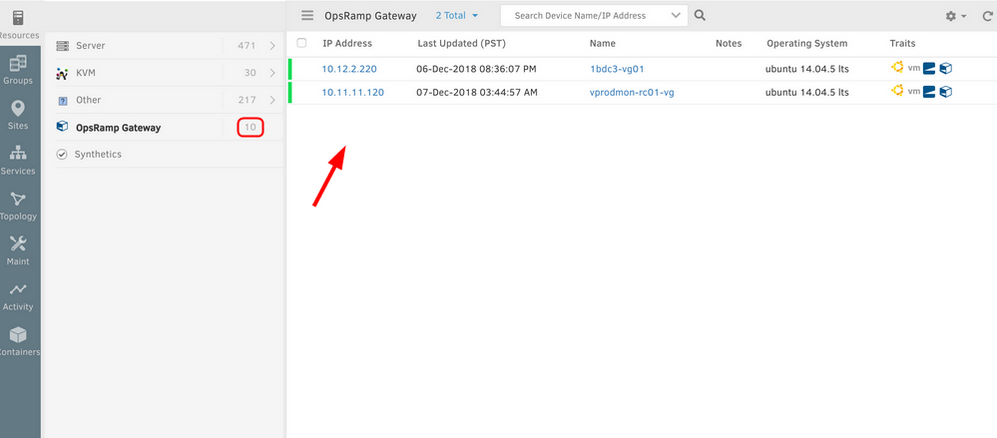
OpsRamp Gateway count is displaying incorrectly in new infrastructure UI
OpsRamp Gateway is showing a count of 10 in the left navigation, but there are only 2 rows in the listing.

OpsRamp Gateway count is displaying incorrectly
Issue is fixed. The Gateway count is correctly displayed in the New Infrastructure page.
Monitoring
With this release, OpsRamp imposes well-defined rules for multiple monitoring templates with same metrics applied on a resource. When partner and client users each apply monitoring templates that include the same metrics, on a resource, OpsRamp selects a single template to use for monitoring in this precedence order:
- Monitors applied at the device level are used (if defined).
- Monitors applied at the client level are used, if no device level templates are defined.
- Monitors applied at the partner level are used, if no client level templates are defined.
Service Management
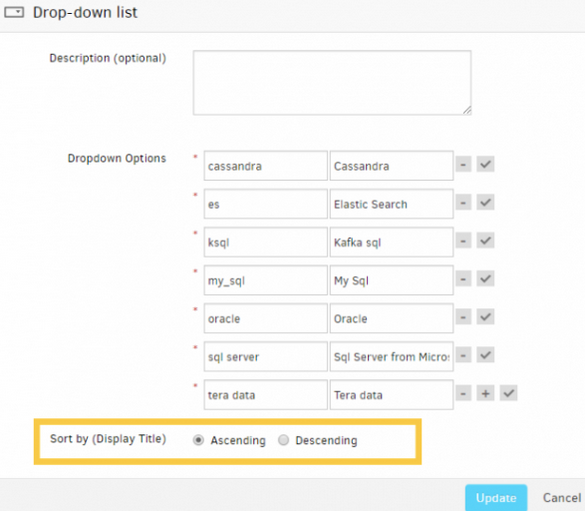
A new option is added to Drop-down options in Custom Forms
A new option Sort by (Display Title) is added to Drop-down Options in Custom Forms. With this option, user can sort the display names in alphabetical order.
- Ascending: Arranges display names from A to Z
- Descending: Arranges display names from Z to A

A new option is added to drop-down options in Custom Forms
APIs
In this release, the search alerts API will return “alert created time” field that user can use as a filter to validate query results.