Release Date: February 2019
Dashboard and User Interface
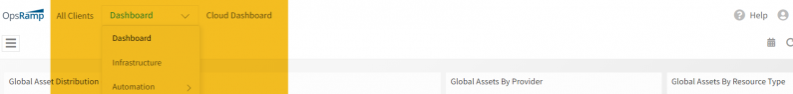
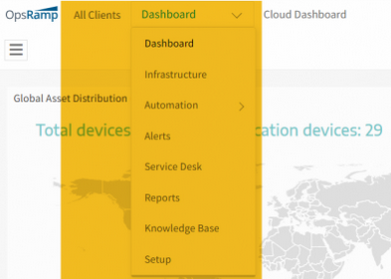
Improvements to Main Menu
A new menu unifies two separate menus that were in the UI, before this release. You can now select clients and feature modules from a single menu. This single line menu provides more screen space, overall.
Improvements to Main Menu
New Infrastructure UI
The new infrastructure UI that has been in Beta (since June 2018) is now Generally Available. All users will be presented the new infrastructure UI as the default screen. Users can revert to the classic infrastructure UI with a click - users’ UI preference will persist across subsequent logins. The new infrastructure UI offers:
- A new and modern look and feel
- A flattened navigation model that is more intuitive and scales to large inventories
- Customizable column ordering for device listing pages
- Inventory summaries for public and private clouds
- Vertically laid out details tabs for each resource that are easier to locate
New Infrastructure UI
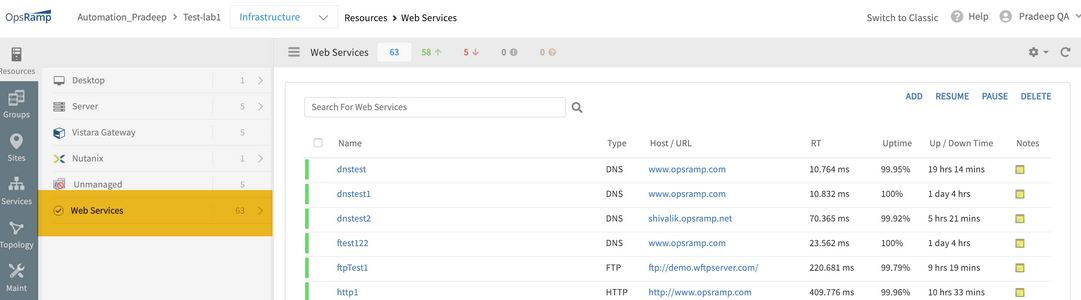
“Synthetics” is now “Web Services”
Prior to this release, within the New Infrastructure UI, web service endpoints monitored via synthetic monitor were listed under the category “Synthetics”. With this release, this category has been renamed to “Web Services” to better reflect the type of managed resource.
“Synthetics” is now “Web Services”
For a newly created device, the schedule maintenance icon is displayed, though the device is not under maintenance
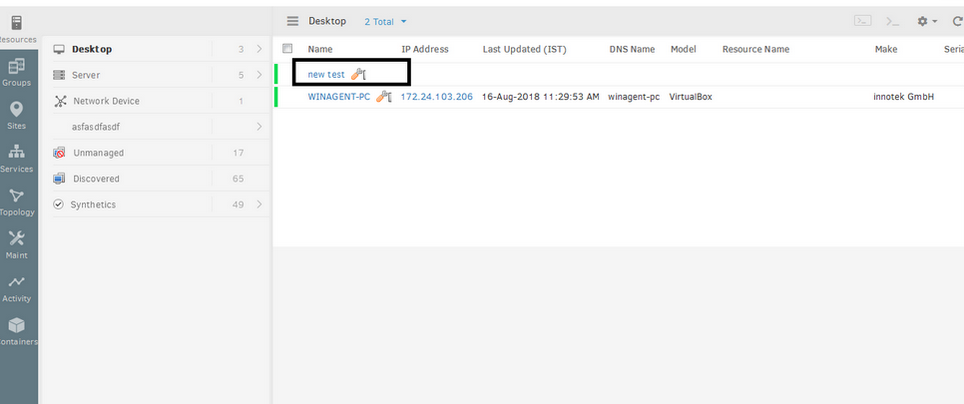
For a newly created device, the schedule maintenance icon is displayed, though the device is not under maintenance
Issue is fixed. The icon is being displayed only for the resources which are under maintenance.
Overview tab is missing for storage device types in the new Infrastructure UI
Overview Tab is not available for EMC VPLEX, FlexPOD, VBlock, and N-Block device types.
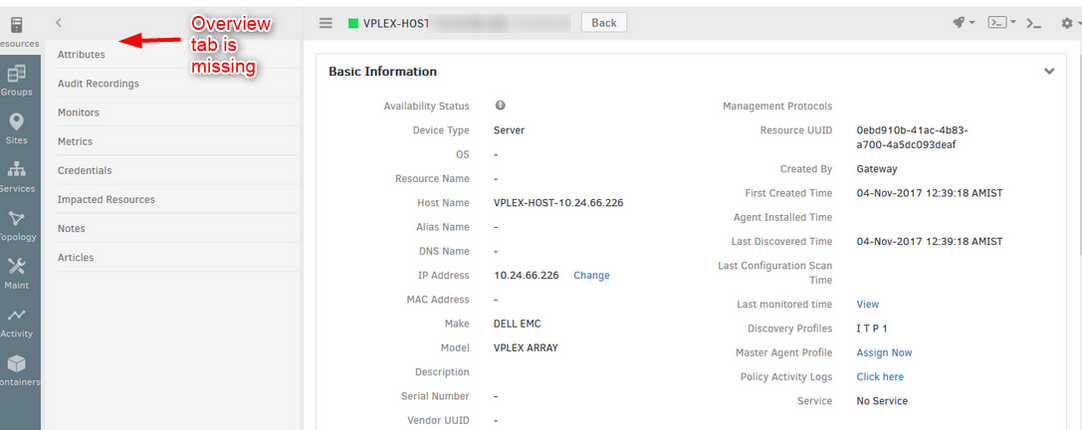
Overview tab is missing for storage device types
Issue is fixed. Overview tab is made available, and the page is loading for storage device types.
Service and Topology Maps
This release brings several new features and improvements to service maps and topology maps. Together, the new features help you understand how your IT resources impact each other and impact IT services delivered to your users. This impact context helps you prioritize response to alerts and speed up troubleshooting time.
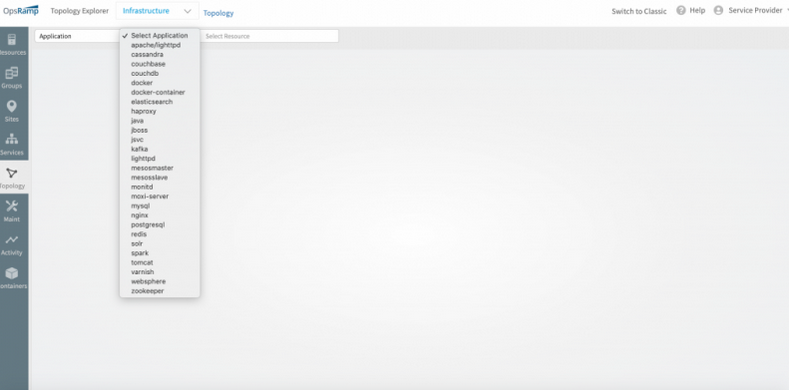
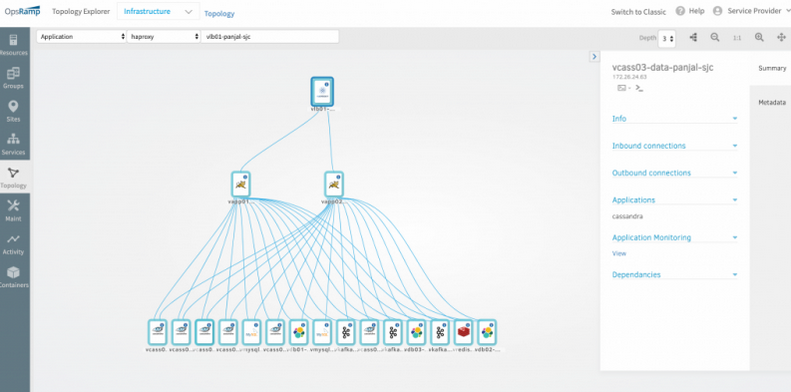
Application Topology
OpsRamp can now discover applications running within servers in your environment. You can now see discovered applications and dependencies between application components in the topology explorer. Application discovery includes:
- Support for 40 common applications
- Information about incoming and outgoing connections for each application component
- Relationship between application components and servers
Application Topology
Application Topology

Application Topology
Hypervisor Topology
OpsRamp now discovers VMs, hypervisor servers and clusters in VMware vSphere and KVM environments and their relationships.
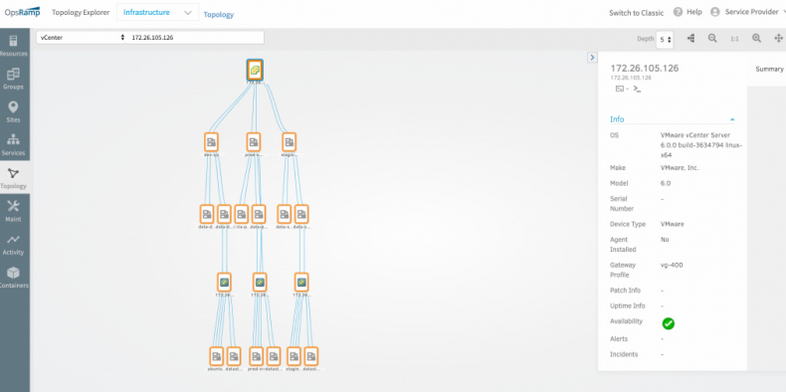
VMware vCenter topology
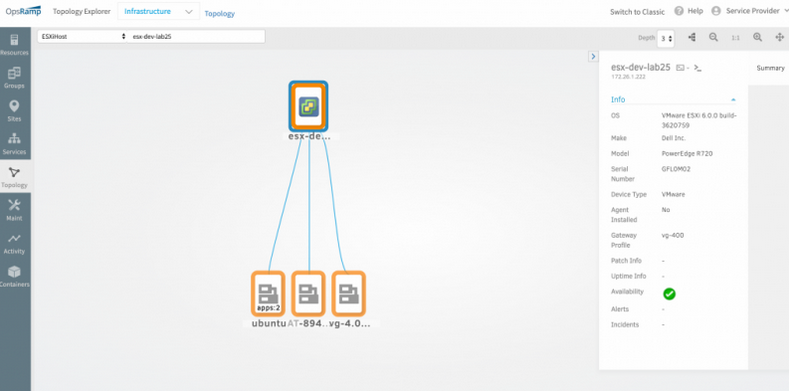
VMware ESXi and VM topology
Network Topology Improvements
Network topology discovery for environments that use LLDP, CDP or SNMP protocols now runs faster.
New Service Map UI
The new service map UI that has been in Beta (since June 2018) is now in Generally Available. The new UI offers all the features of the classic service maps UI in an improved UI experience.
Note
You can now create new service maps only in the new UI. You can no longer create new service maps in the classic UI.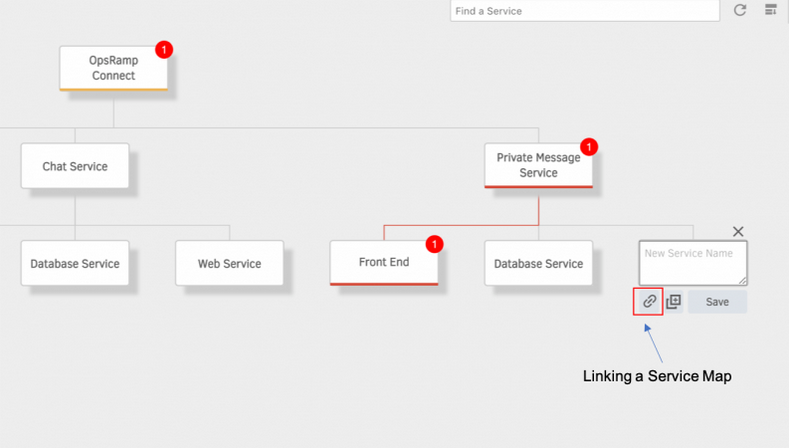
New Service Map UI
Alert Management
Machine Learning Based Auto-Incidents
Escalation policies can now automatically assign the following incident attributes based on learned behavior from previously created incidents:
- Assignee Group
- Priority
- Category
- Sub-Category
- CC field
In this release, you can train escalation policies by providing a training set (in CSV format) that includes example ticket assignments for different types of alerts. A continuous and automated learning option will be available in a future release, where OpsRamp automatically learns continuously from previously created incidents.
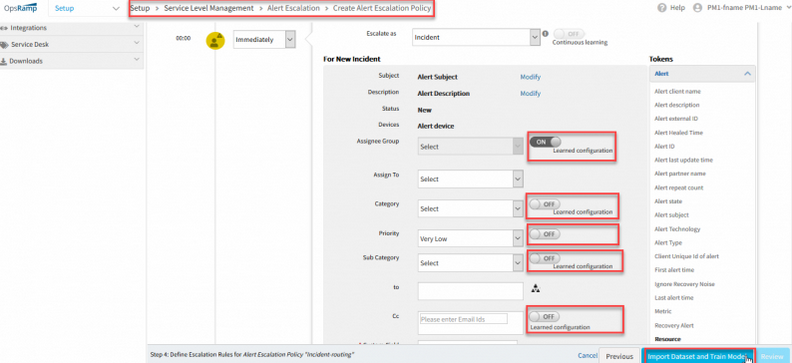
Machine Learning Based Auto-Incidents
Augmented Training for Co-occurrence Based Inference Models
Prior to this release, the co-occurrence based inference model was based exclusively on patterns learned from past alerts. With this release, you can augment this continuous learning with additional user-provided training. This augmented training option is useful to hone OpsRamp’s inference models to recognize patterns that are uncommon in everyday data.
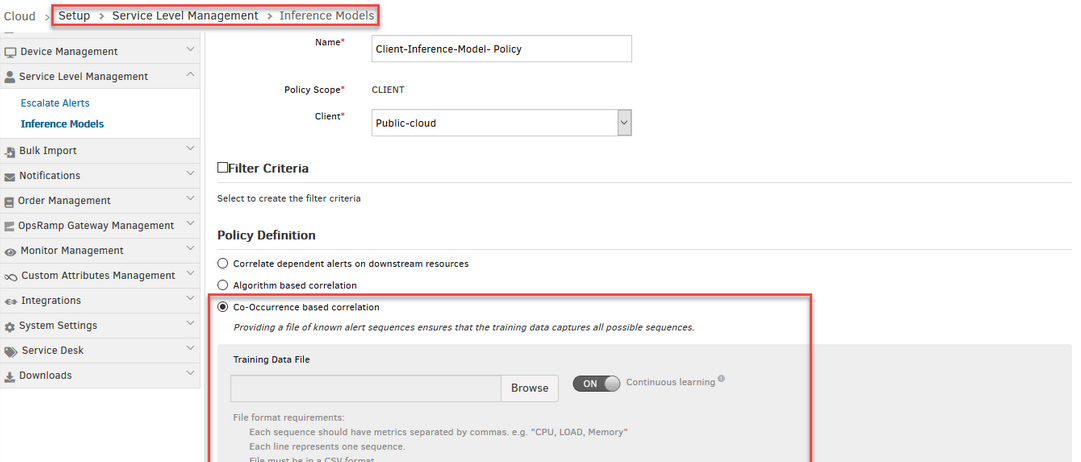
Augmented training for co-occurrence based inference models
Escalate Alerts Based on Frequency
You can now define escalation policies to escalate alerts based on how often an alert has occurred recently. With this option, you can filter out alerts that flap only occasionally and escalate alerts that flap repeatedly.
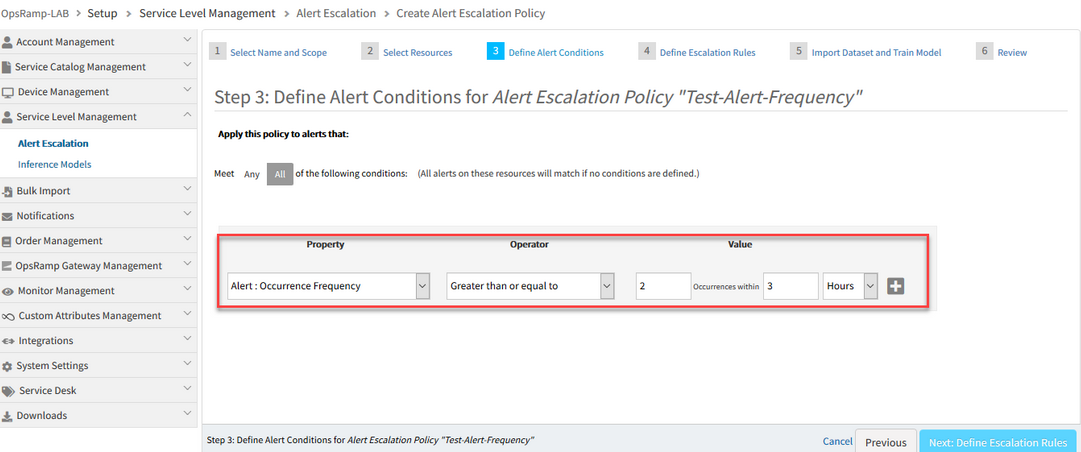
Escalate alerts based on Frequency
Token Enhancements for Improved Incident and Notification Context
You can add additional context to auto-created incidents and escalation notifications with the new enhancements to tokens:
- Function-based tokens: Define tokens based on textual patterns within an alert’s subject, description or other attributes.
- Custom attribute based tokens: You can now use custom attributes as tokens.
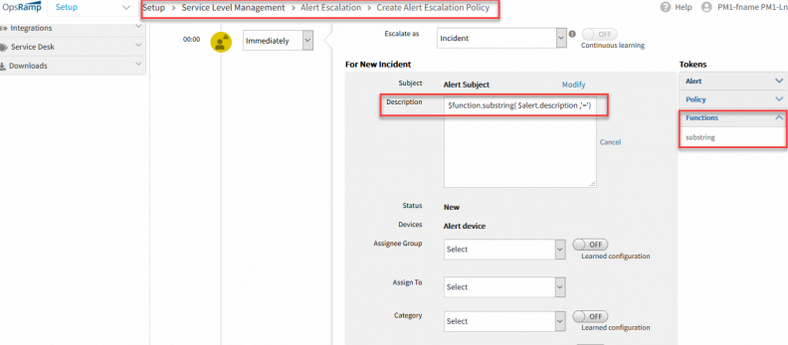
Function-based tokens while creating a new Incident in Alert Escalation
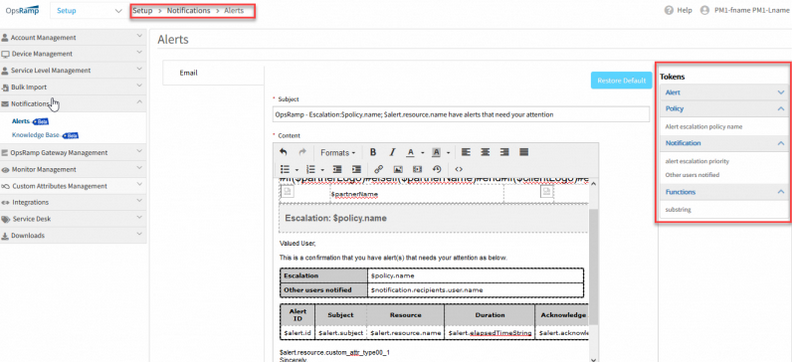
Function-based tokens while creating an alert notification
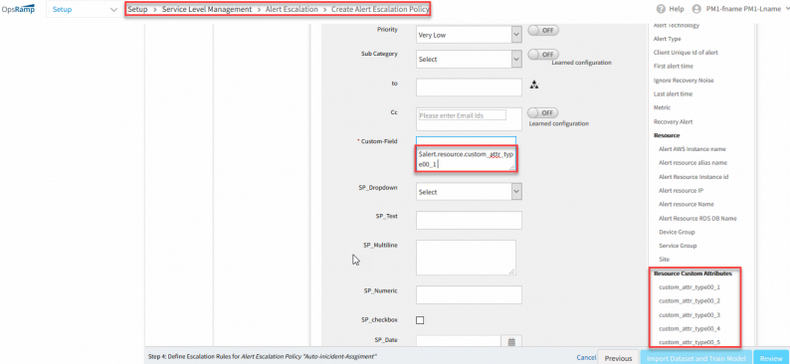
Custom attributes as tokens
Improvements to Inference Models
Inference Models at Partner Scope
A partner user can now make inference models available across clients by defining inference models at partner scope.
Additional Filter Attributes
You can now define inference models that apply only to resources within specific device groups, service groups or sites.
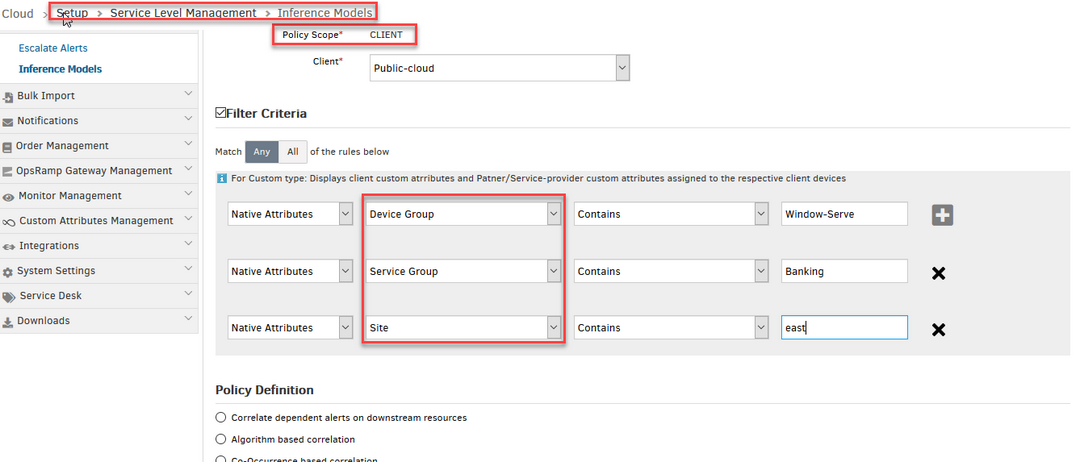
Additional filter attributes
Monitor Cloud Events
With this release, you can monitor various types of events across your Amazon AWS accounts from OpsRamp, by enabling “Steam AWS Events” option in cloud discovery profile.
OpsRamp can now collect and monitor the following types of AWS events:
- AWS Health
- AWS ECS tasks and containers related to state changes
- AWS CloudWatch events for EC2, EBS and Autoscaling
- AWS Redshift
- AWS Data Migration Service
- AWS Relational Database Service
You can also monitor events by Azure resource group manager using Azure Event Grid, by enabling “Stream Azure Events” option in cloud discovery profile.
You can view these events, alerts within OpsRamp and can automate response actions to these events via alert escalation policies.
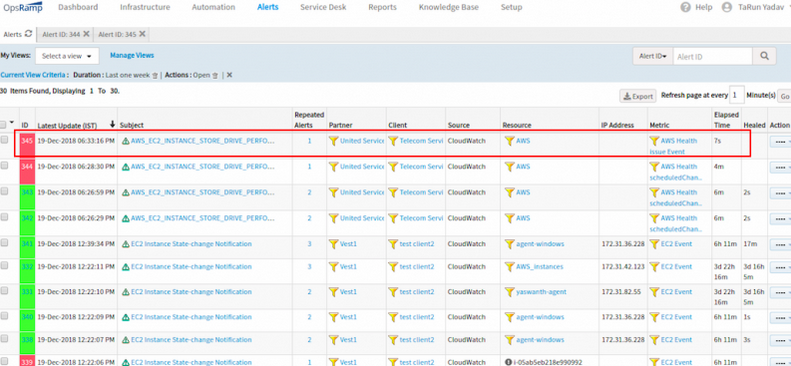
Monitor cloud events
Alert Views Based on Availability Impact
You can now define views in the alert browser to show only alerts that impact resource availability. This helps to narrow down the list of alerts which require your immediate attention.
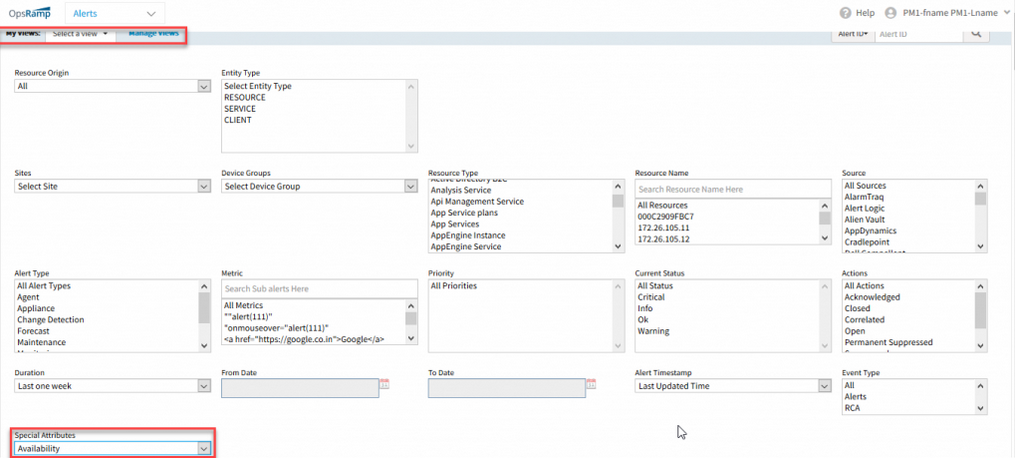
Availability attribute in Alert Views
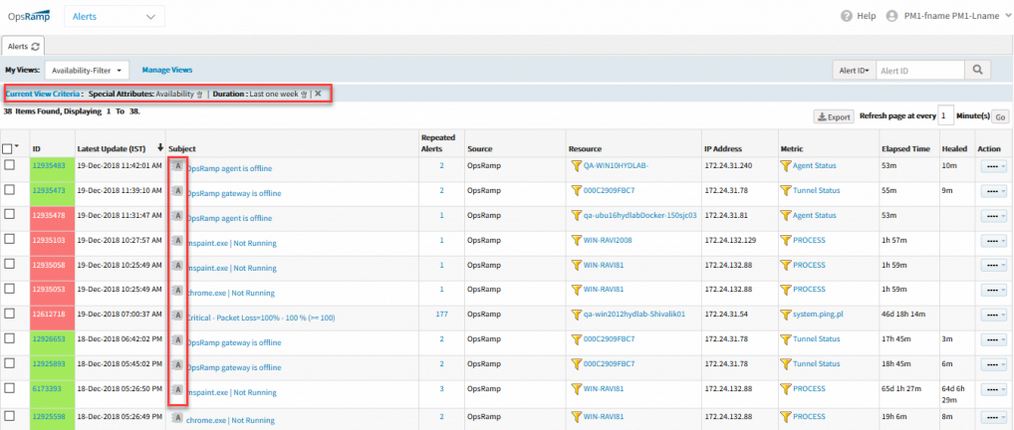
Alert views based on availability impact
Cloud and Cloud Native Environments
Kubernetes and Container Monitoring
OpsRamp can now discover and monitor a Kubernetes environment deployed in your datacenter, Azure Kubernetes Services, Google Kubernetes Engine, or Amazon Elastic Container Service for Kubernetes. You can monitor key metrics related to the availability and performance of:
- Clusters
- Hosts
- NameSpaces
- Pods
- Containers
- Kubernetes
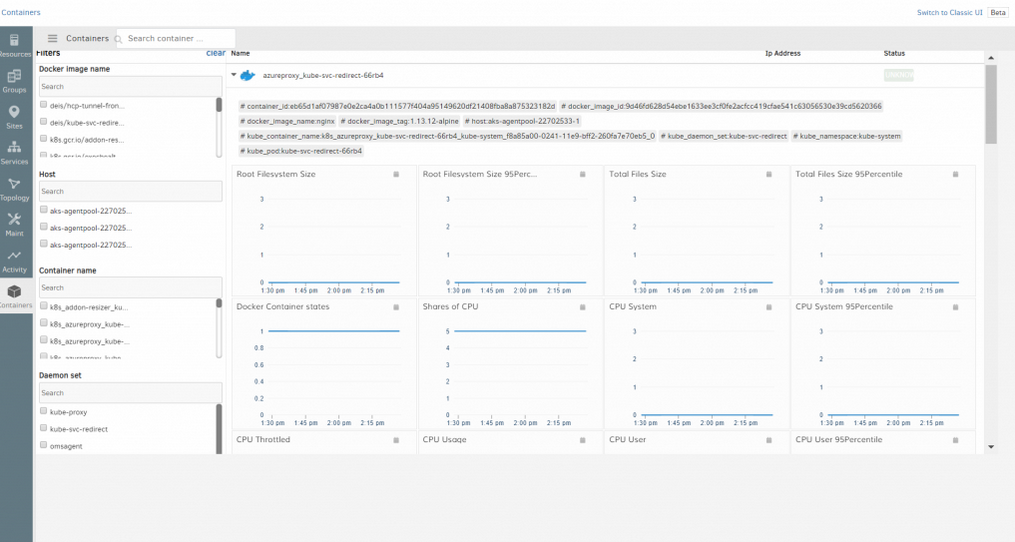
Kubernetes and Container monitoring
Event-driven Discovery for Microsoft Azure
OpsRamp can automatically discover newly provisioned Azure resources in real-time via events. Prior to this release, this feature was available only for Amazon AWS.
Synthetics
Recorded Script Based Synthetic Monitors
You can now define script based synthetic monitors from recorded actions in a browser. You can now record scripts using the Selenium recorder plug-in on Google Chrome browsers.
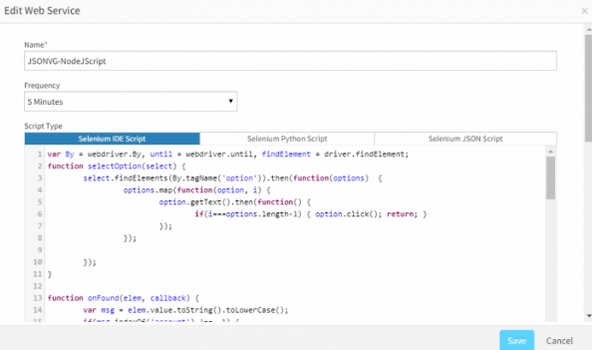
Recorded script based Synthetic monitors
Monitor SSL Certificates
You can now monitor for expired SSL certificates in your websites.
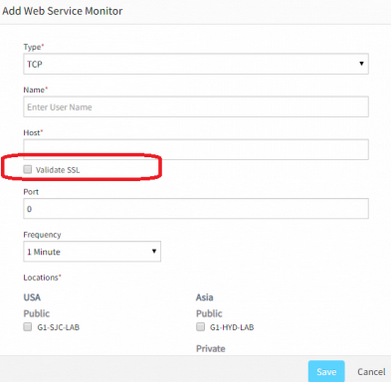
Monitor SSL certificates
Patch Management
Patch Baselines
You can now group patches into a patch baseline. You can check the compliance of a device against a baseline – i.e. check if all the patches in a baseline are installed on a device.
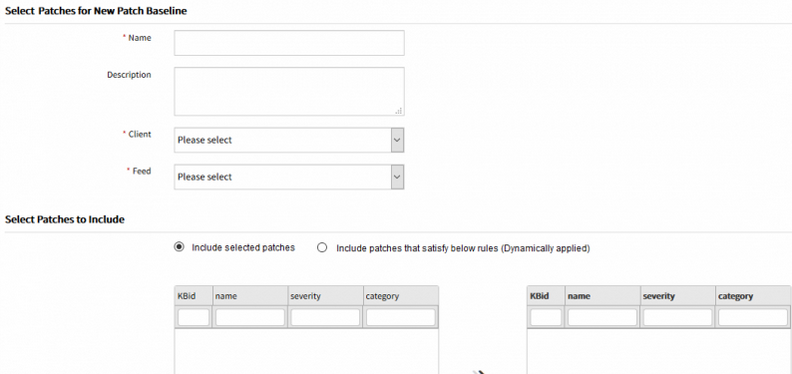
Patch Baselines
Patch Compliance
A new dashboard widget shows the compliance of devices against a baseline.
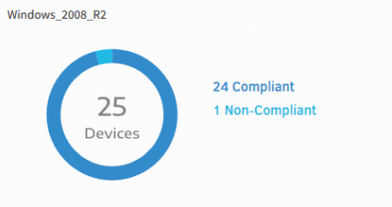
Patch Compliance
You can also see the compliance history of a device over time, within the metrics tab of a device.
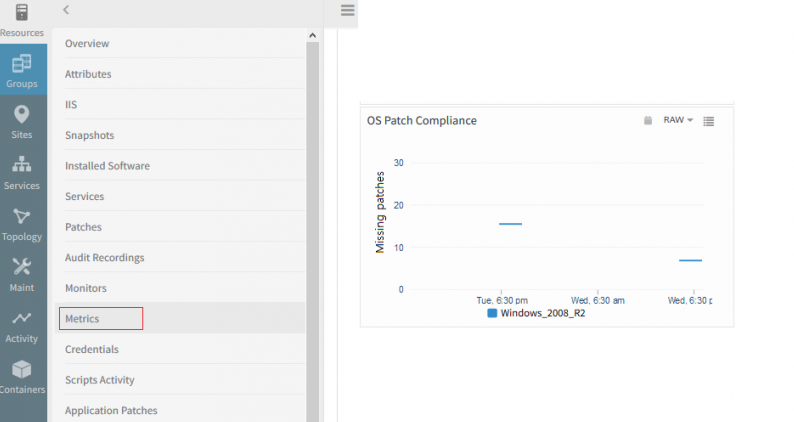
Compliance history
A new functionality to enable and disable a baseline individually is introduced
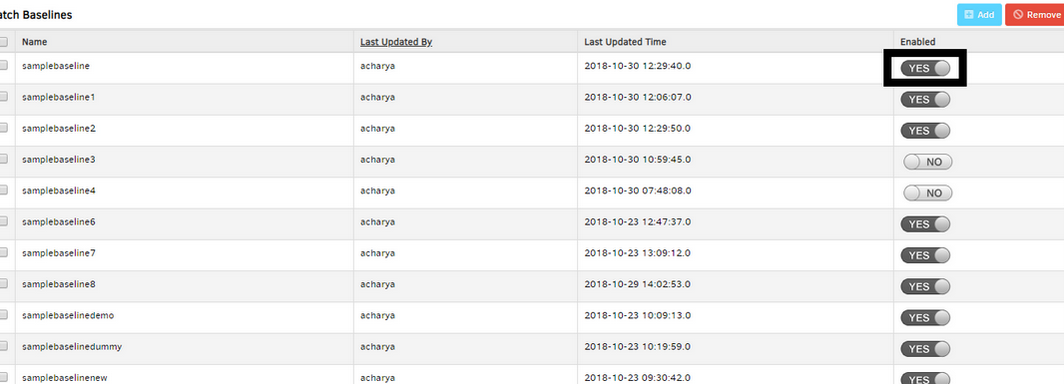
A new functionality to enable and disable a baseline individually is introduced
Able to approve patches when the user is having Patch Approve View permission
The user should be able to view the list of devices only, and not able to approve any patch.
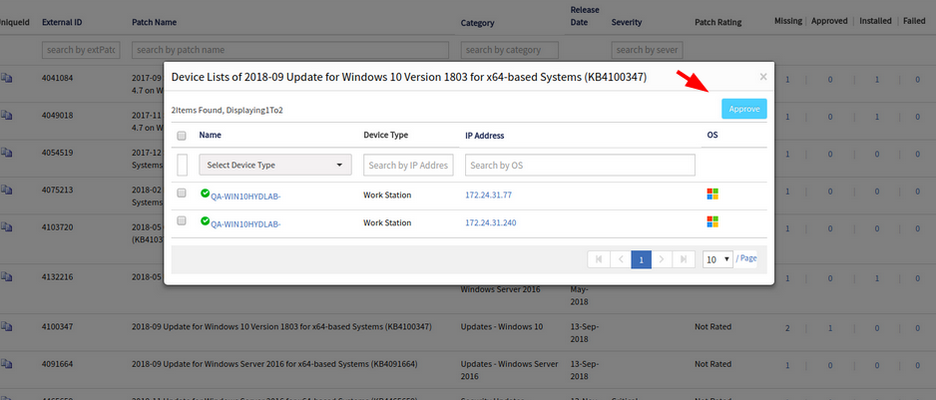
Able to approve patches when the user is having Patch Approve View permission
Issue is fixed. The Approve button is not displayed in the popup. So the user with View permission cannot approve any patches.
Reports
Alert Report Enhancements
You can define custom reports that show a joint grouping of alerts and tickets by time.
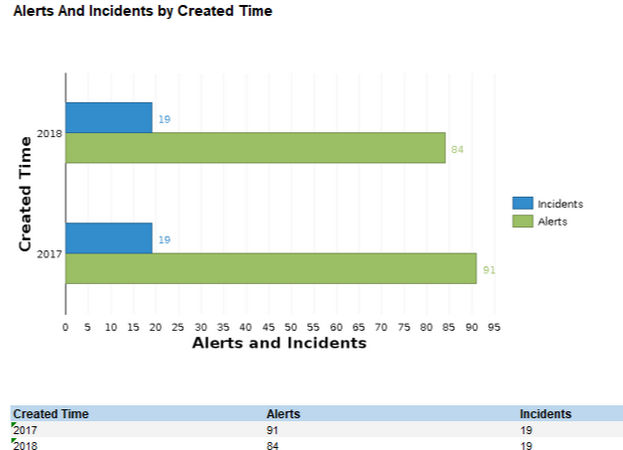
Alerts and incident details breakdown by created time for duration – 1 year
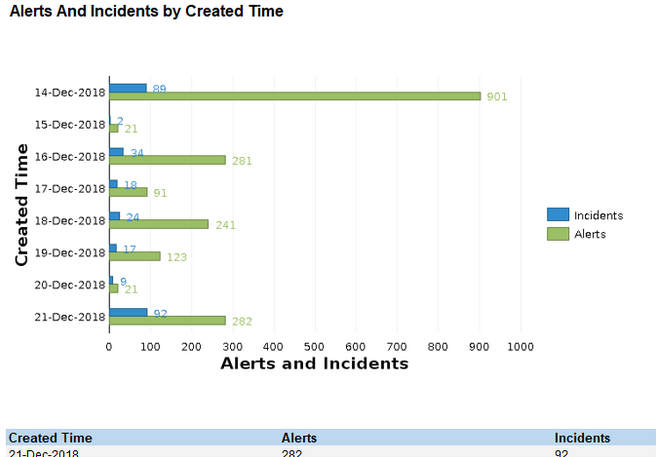
Alerts and incident details breakdown by created time for duration – last 7 days
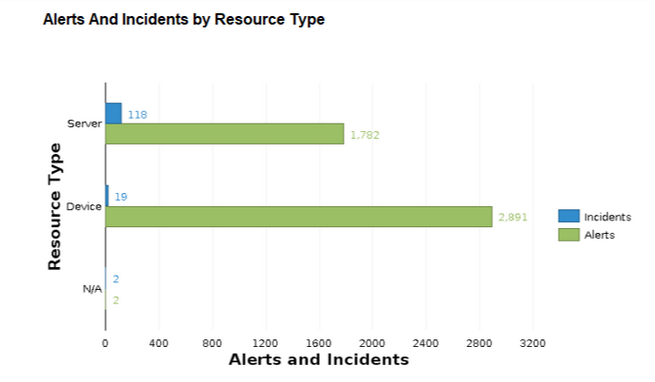
Alerts and incident details breakdown by resource type for duration – 1 year
Patch Report Enhancement
The standard patch report now includes patch compliance status of devices.
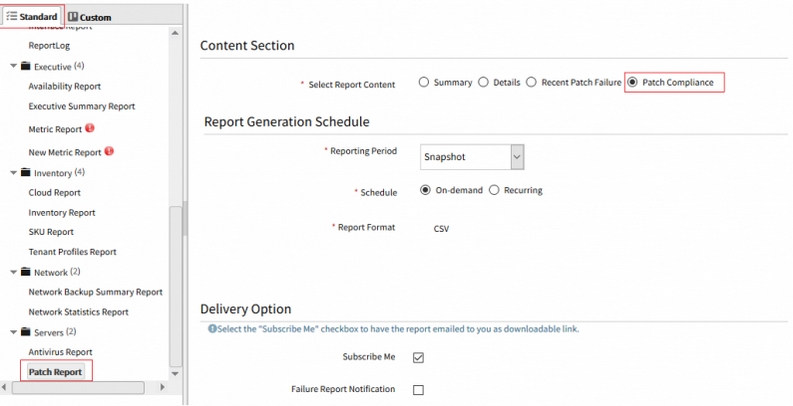
Standard patch report now included patch compliance status of devices
Resource Attributes
Resource Type
All managed resources now have the Resource Type attribute. Resource Type represents a classification of the resource within OpsRamp. Prior to this release, only some types of resources had the Resource Type attribute. Going forward, Resource Type will replace “Device Type” as the universal resource classifier.
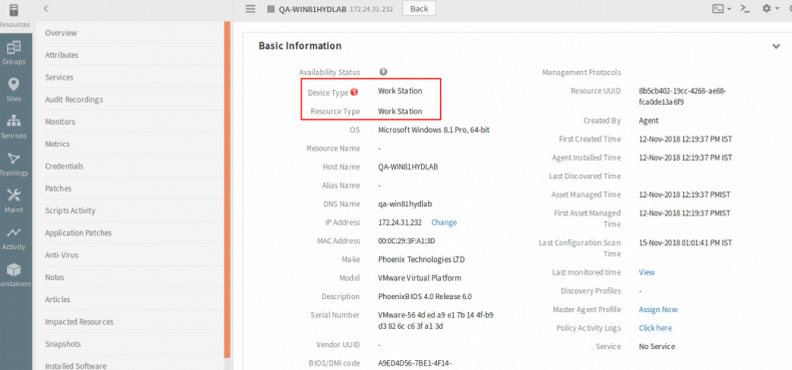
Resource Type attribute
Application Role
If application discovery is enabled, servers will be automatically tagged with a new attribute - the App Role. App role is a multi-valued attribute that denotes running applications discovered within the server.
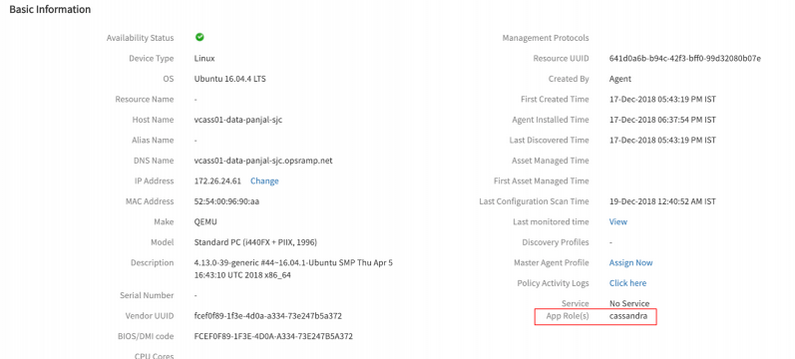
Application Role
Service Management and Knowledge Base
Indicators for partner and client visible knowledge base categories
You can now identify partner level and tenant level knowledge base categories by a different icon.
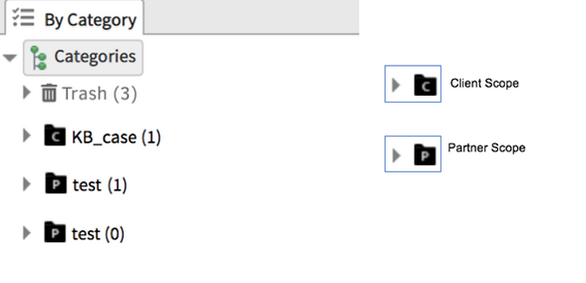
Indicators for partner and client visible knowledge base categories
Add knowledge base articles to multiple categories
An article can now be placed in multiple categories.
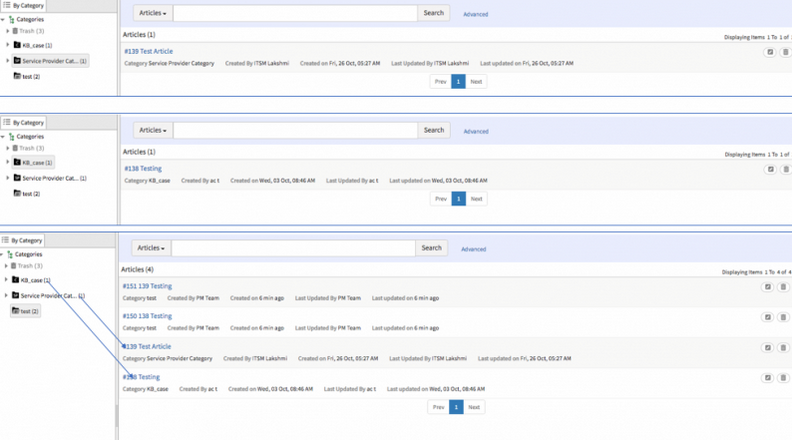
Add knowledge base articles to multiple categories
Notifications on knowledge base article expiry
You can now get email notifications when articles are about to expire.
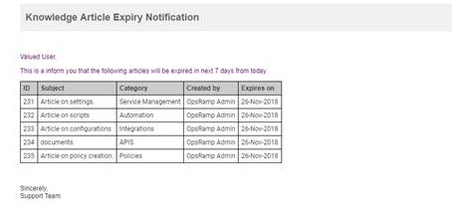
Notifications on knowledge base article expiry
Link knowledge base articles to tickets
You can now add links to articles within an incident.
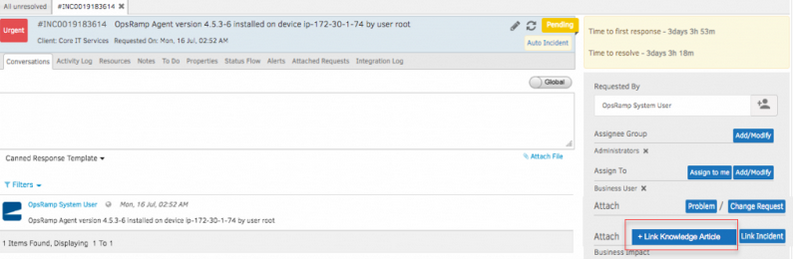
Link knowledge base articles to tickets
Custom fields in ticket notifications
You can now use custom fields as tokens in notification templates.
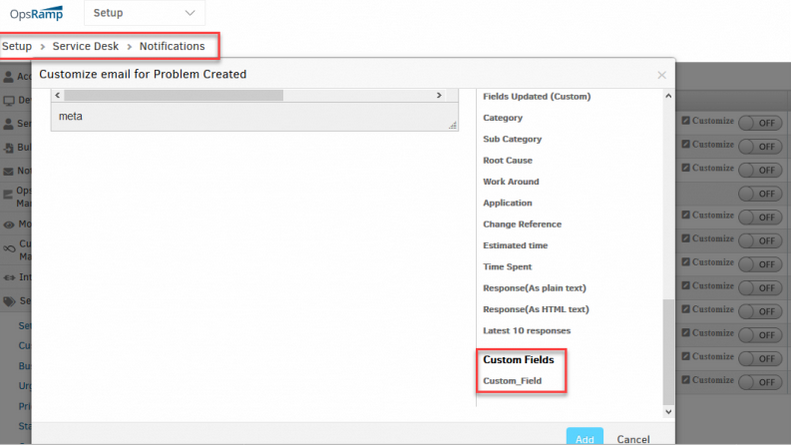
Custom fields in ticket notifications
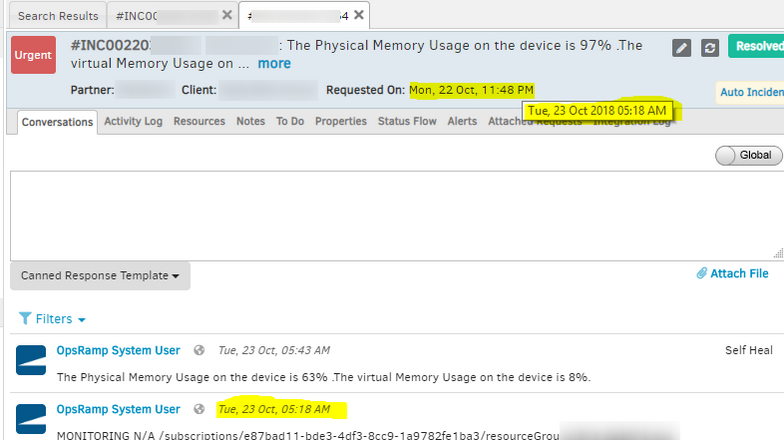
There is difference in date and time at which Incident is generated and time shown in the tool
Shows incorrect date for label Requested on the Ticket View page. There is difference in date and time at which Incident is generated and time shown in tool.
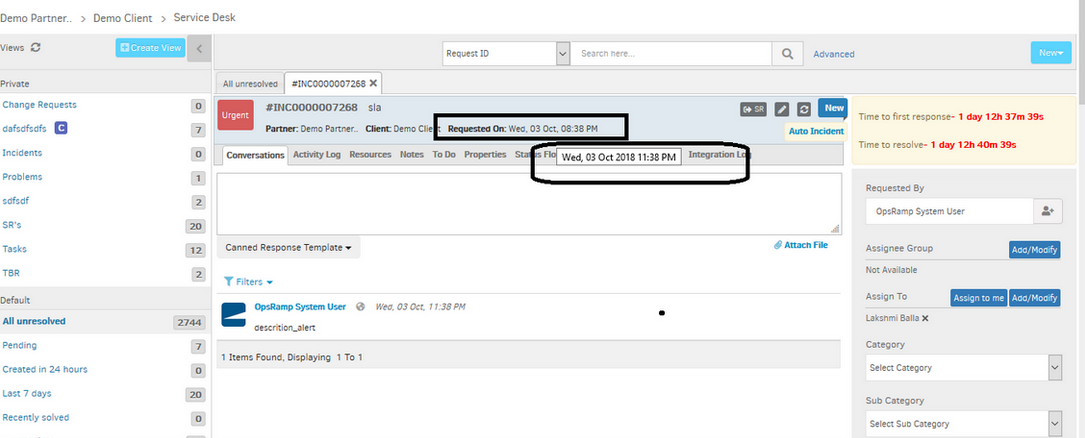
Difference in date and time at which Incident is generated
Difference in date and time at which Incident is generated
Issue is for Incidents and Service request ticket types. Issue is while loading ticket object in a required method.
Passed ticket object instead of ticketId to the method (isCustomFormContainsLinkedRequests).
Issue is fixed. The date and time are showing correctly on the Ticket View page.
Resource Management
Option provided to refresh Service Maps
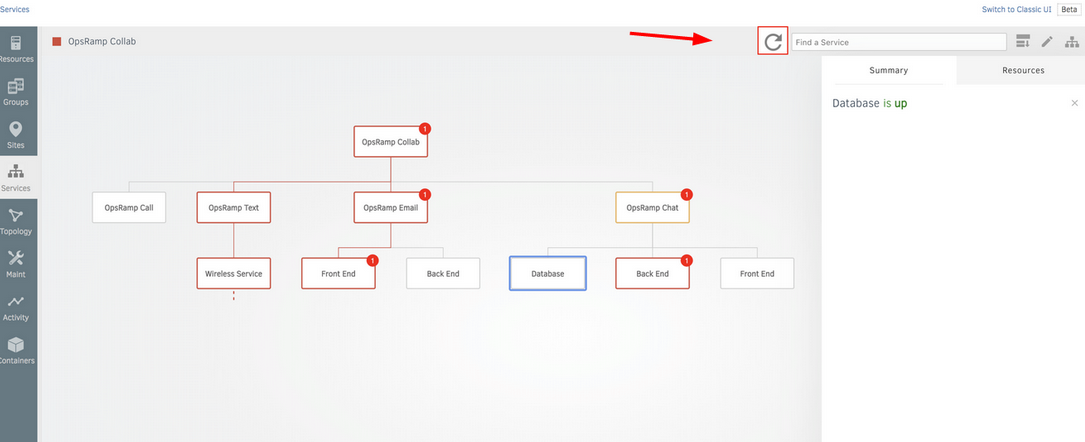
Option provided to refresh Service Maps
Provided a Refresh button on the service maps page, for the user to manually refresh the service maps.
Integration
On demand look-up from ITSM systems
OpsRamp can do on demand look-ups of specific information from external ITSM systems, while creating incidents in OpsRamp. For example, you can configure an integration to look up user information (first name, last name, email id, etc.) from ServiceNow and present these values for selection while creating incidents within OpsRamp.
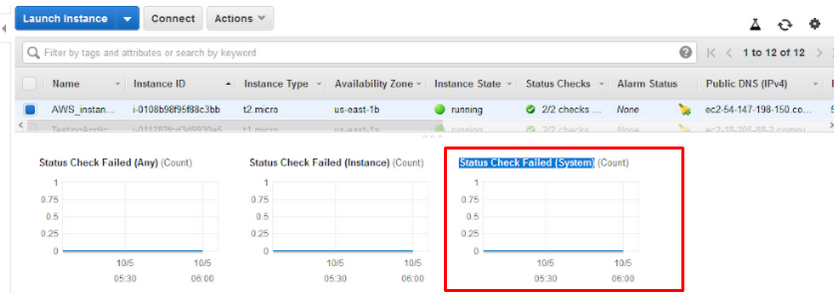
Added new metric to the available AWS metrics
Miscellaneous
Added new metric to the available AWS metrics: StatusCheckFailed_System
On demand look-up from ITSM systems
Graphs are also generated.
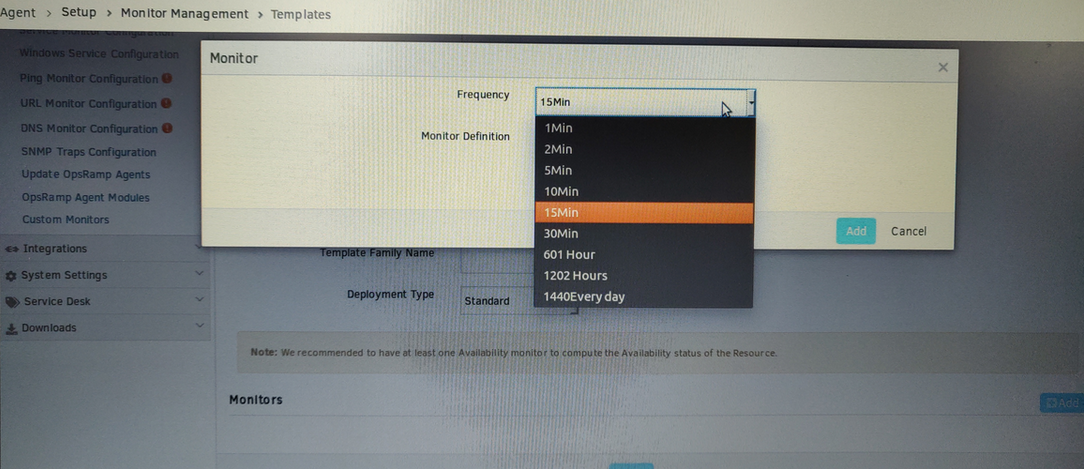
Time Frequency is not mentioned with proper labels
Mentioned 601 Hour in the dropdown, but it should be either 60 mins or 1 hr, any 1 of them.
Time Frequency is not mentioned with proper labels
Changed Labels of frequency which is having hours, everyday to Min in showMonitordata.jsp. Issue is fixed.
Changed the labels of frequency, to Minutes (Min). 601 Hour is 60 Min, 1202 Hours = 120 Min, and so on. These options appear in the process of creating a template.
APIs
Following are the API improvements:
- Create Resource: You can now programmatically create resources.
- Update Resource: You can now update resource attributes of any resource.
- Get Resource: You can now to get information on a resource of any type.
- Search Resource: You can now search for a resource of any type.
- Delete Resource: You can now delete a resource of any type.
- Kubernetes Integration API: You can now integrate with OpsRamp via API
- Activity Log APIs: User can now fetch user activities on each Service Desk entity.
- Service Availability APIs: User can now view the availability of a service within a certain time frame.
- Patching APIs: You can now apply, baseline and get compliance of the patches on a resource.
- Service Desk APIs: You can now add articles and fetch hours spent.
- Change Request APIs: You can set priority for change request to be represented as Normal or Emergency.
- Get Minimal Resource Types: You can now get a list of all resource types under a specific client.
- Delete Resource by Type: You can now delete a resource by a specific type.
- Get Minimal Resources: You can now get a list of all resources under a client with minimal information.
- Get Resource Applications: You can now get a list of all applications running under a specific resource.
- Get Resource Availability: You can now get the availability metric of a specific resource.
- Alert APIs: Event-Type filters support in Alert APIs
- Alert Escalation Policy APIs: Alert Frequency attribute support in Alert Escalation Policy APIs.