Release Date: July 2019
Dashboards and User Interface
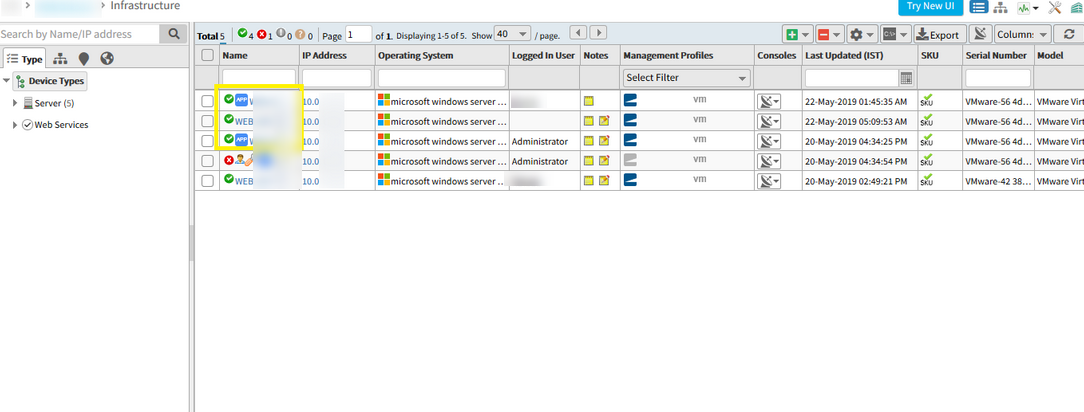
Search support provided on the New UI Infrastructure page
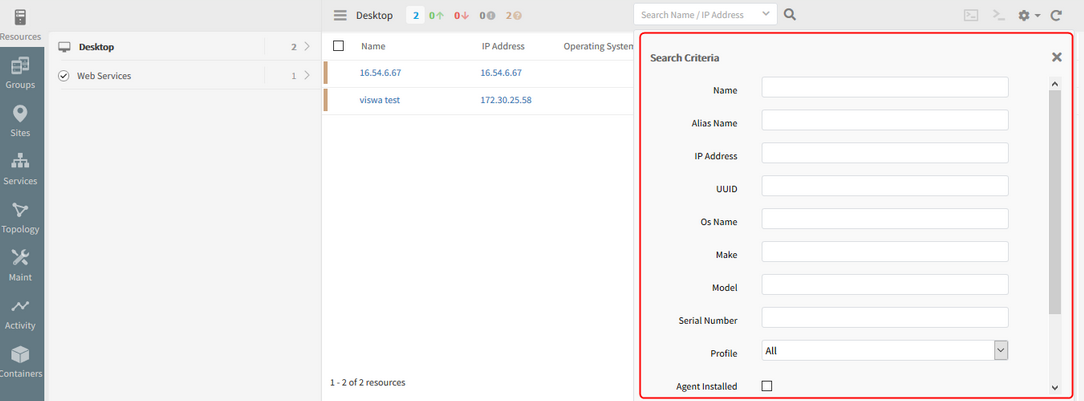
Search support provided on the New UI Infrastructure page, where the user can search with all possible attributes using the Filter option.
Search support provided on the New UI Infrastructure page
Using the filter support provided, the user can search with all possible attributes (Make, Model, Alias Name).
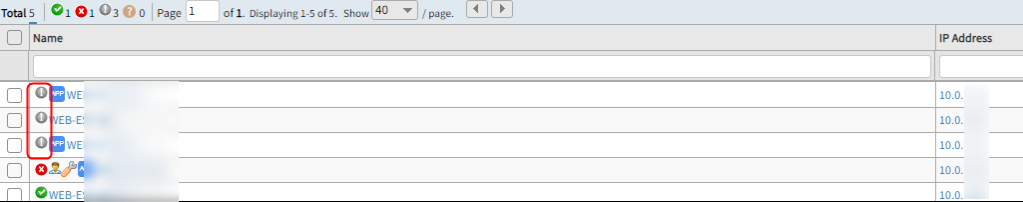
On the Infrastructure listing page, the Console icon is a satellite icon whereas on the toolbar it shows as a different icon
Console icon is a satellite icon whereas on the toolbar it shows as a different icon
Replaced the Console (satellite) icon in the Consoles column with the actual console icon that appears on the toolbar, to ensure consistency.
User can search with the resource name wherein the resource groups in which the device is present are displayed in the Group Names column
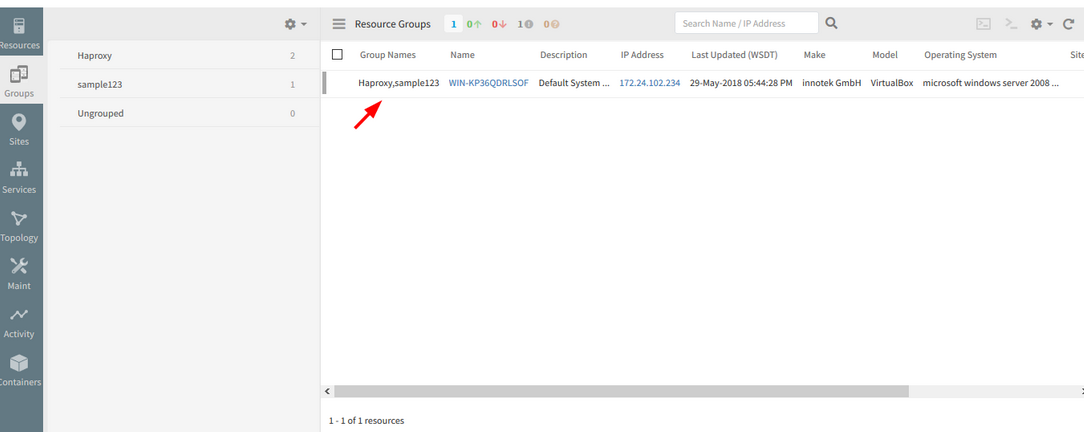
When same devices are present in more than 1 resource group, the user can search with the resource name wherein the resource groups in which the device is present are displayed in the Group Names column (in the Groups tab of New UI) separated by comma.
Resource groups in which the device is present are displayed in the Group Names column
Look and Feel Improvements
The following pages now have improved look and feel.
Alert Browser
Alert lists are easier to read without column boundaries. Alert view and filter management is also streamlined.
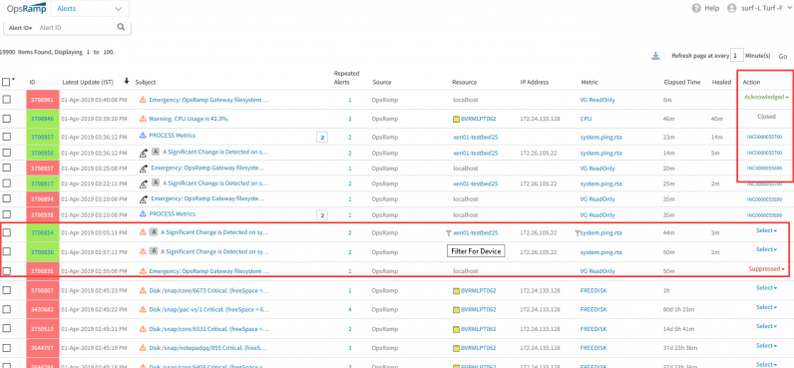
Alert Browser improvements
Alert Details
A new header shows essential information about the alert in a single row.
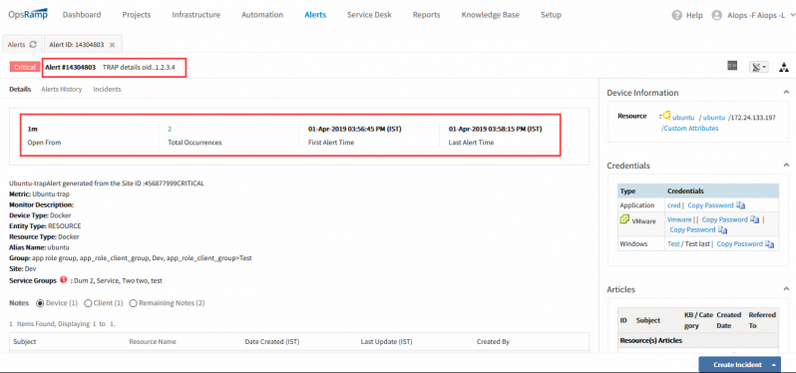
Alert Details
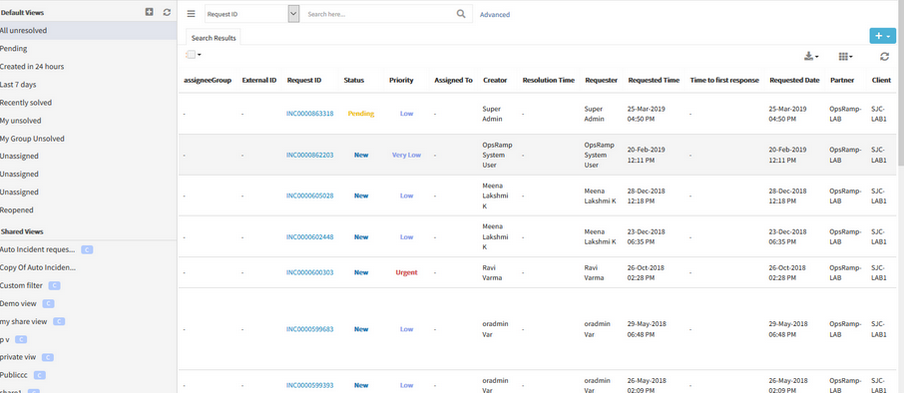
Service Desk
Ticket listing, creation and actions are simplified.
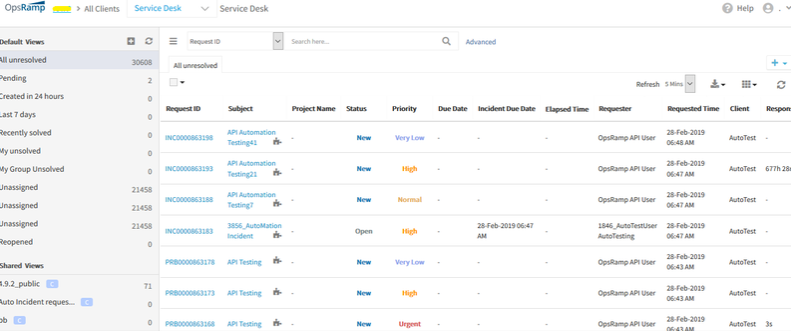
Ticket listing, creation and actions are simplified
Knowledge Base
Knowledge base listing is improved.
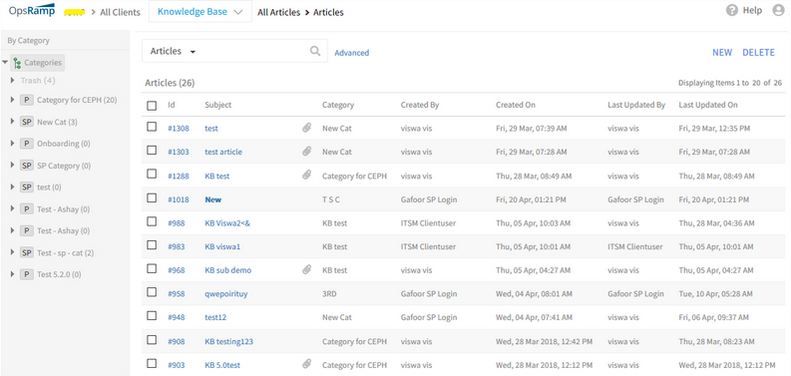
Knowledge base listing is improved
Reports
Report listing and definition is simplified.
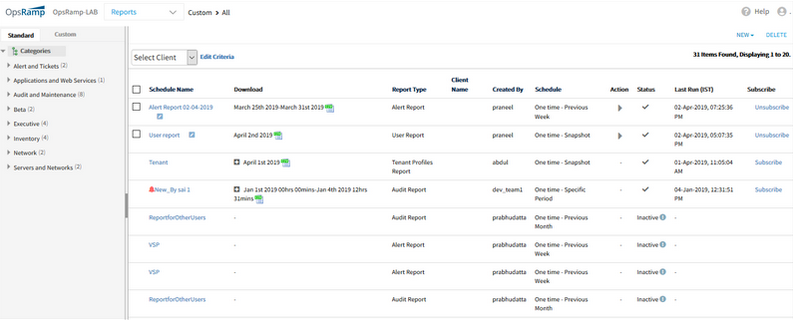
Report listing and definition is simplified
All the tickets are displayed, irrespective of the tickets count
On Services page, when clicked on the tickets count in the Summary tab on the side panel, all the tickets are displayed, irrespective of the tickets count.
All the tickets are displayed, irrespective of the tickets count
After clicking the tickets count:
The page is redirecting and showing the correct tickets count
Issue is fixed.
After clicking the Tickets count on the Service map side panel, the page is redirecting and showing the correct tickets count on the search results page.
Unable to view the Sites in New UI, on the left side of the Infrastructure page. It is blank
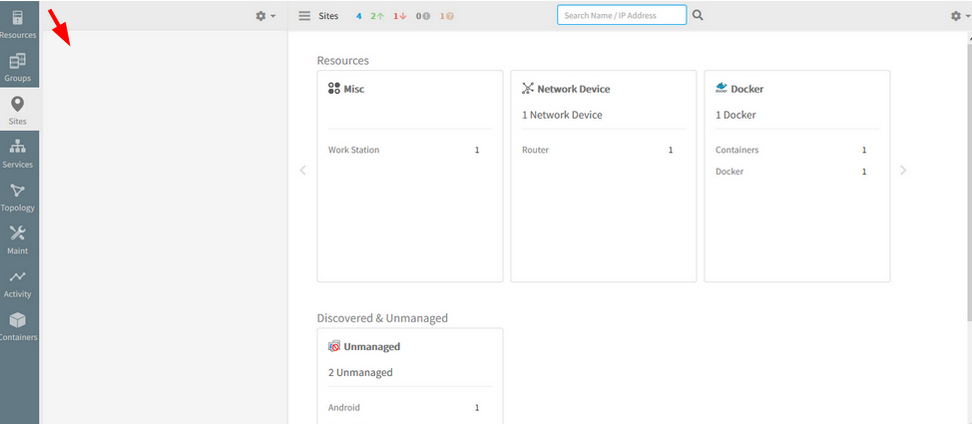
Unable to view the Sites in New UI
Issue is fixed.
The Sites are visible on the left side of the New UI, when clicked on Sites.
Name column is displaying both the Article ID and Article name together in the new UI under Knowledge Base
Article ID and Article subject are grouped together as “Name” under a single column.
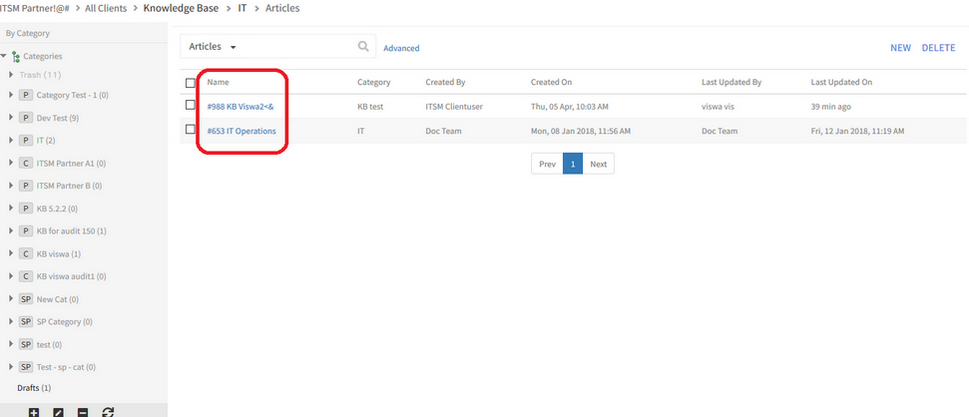
Name column is displaying both the Article ID and Article name together
Issue is fixed.
Article ID and Article subject are provided as two separate columns, for better user experience, so that the user can search using Article ID or subject.
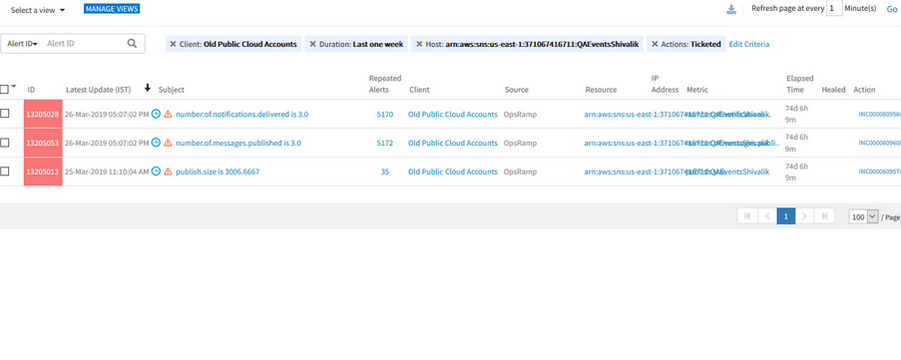
The alerts count is not visible at the top or at the bottom of the list
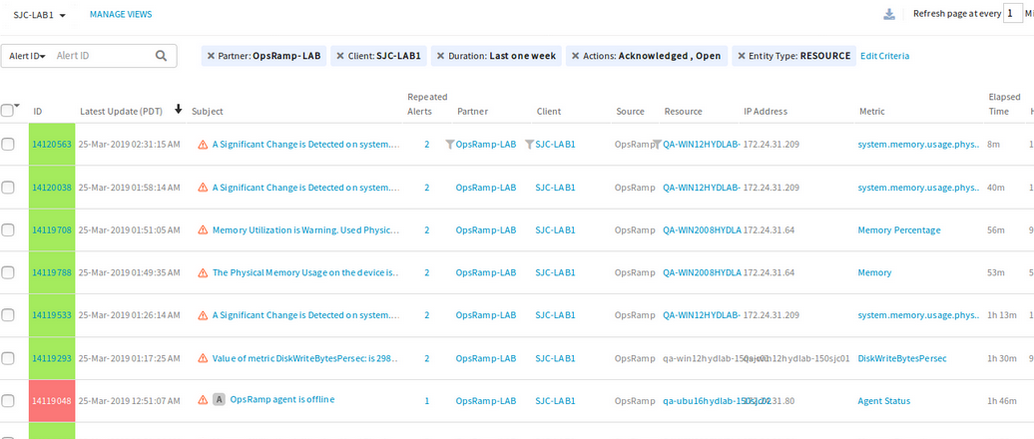
The alerts count is not visible at the top or at the bottom of the list
Issue is fixed. The alerts count is displayed properly on the Alerts listing page.
The attributes corresponding to the selected resource are not shown, but default attributes related to devices are shown for all the resources
In the process of creating a resource group, after selecting the resource (in filter criteria), the attributes corresponding to the selected resource are not shown, but default attributes related to devices are shown for all the resources, in the Infrastructure page.
The default IntelliSense of resource type is showing attributes for all other types of resources.
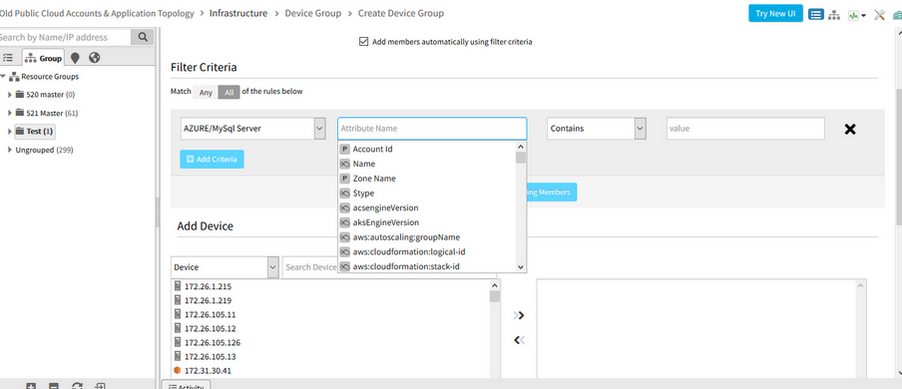
Attributes corresponding to the selected resource are not shown
Issue is fixed.
The attributes corresponding to the selected resource are displaying correctly.
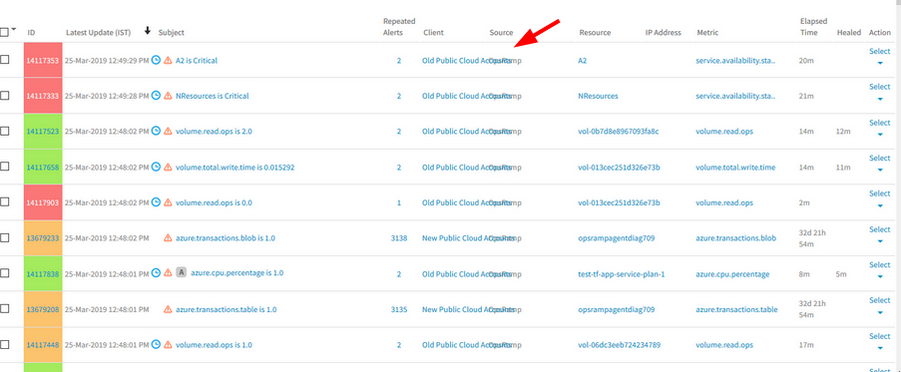
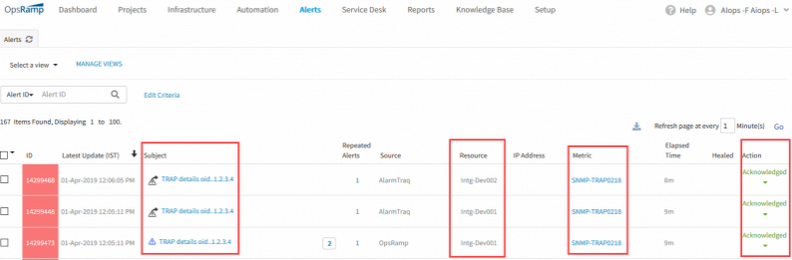
Funnel icon (Filter) is missing for Metric column in the Alerts listing page
Funnel icon (Filter) is missing for Metric column
Issue is fixed. The funnel icon is displayed next to the metric name in the Alerts listing page.
Using this filter option, user can filter and get the desired result.
Removed Windows Server 2003 listing from OpsRamp Agent Download page
Removed Windows Server 2003 from Windows Agent Download Instruction page
Changed Windows Server 2008 to Windows Server 2008 onwards
OpsRamp does not support the above.
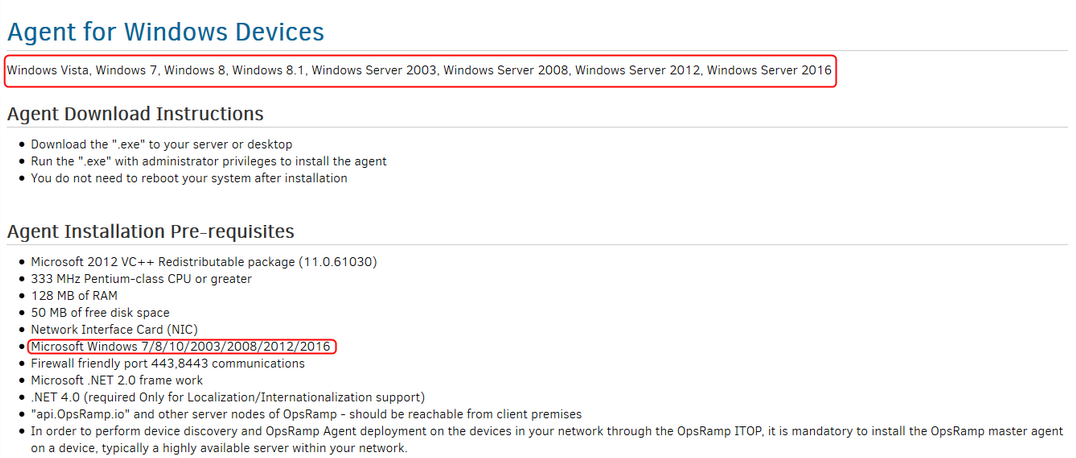
Removed Windows Server 2003, changed Windows Server 2008 to Windows Server 2008 onwards from OpsRamp Agent Download page
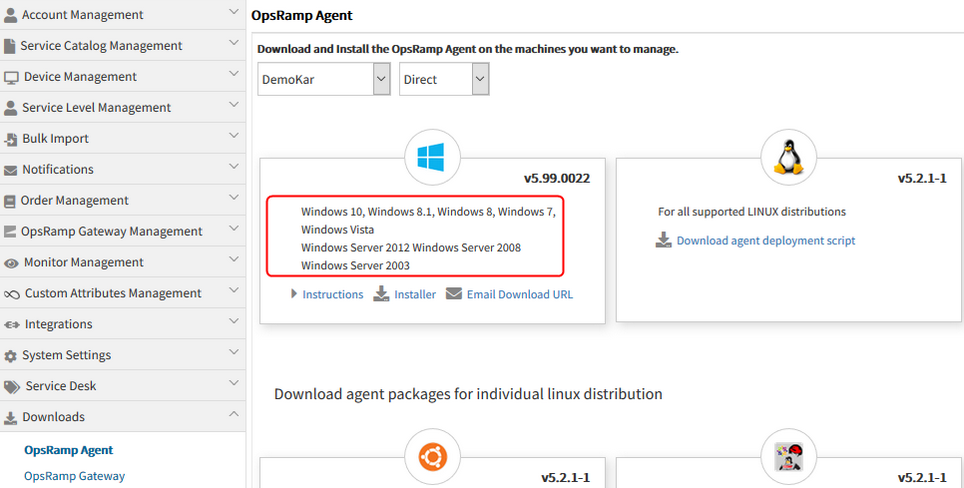
Removed Windows Server 2003, changed Windows Server 2008 to Windows Server 2008 onwards from OpsRamp Agent Download page
Windows Installer Agent version is showing incorrectly
Windows Installer Agent version is showing incorrectly; it is picking and showing Windows Agent Installer version from G1 patch.
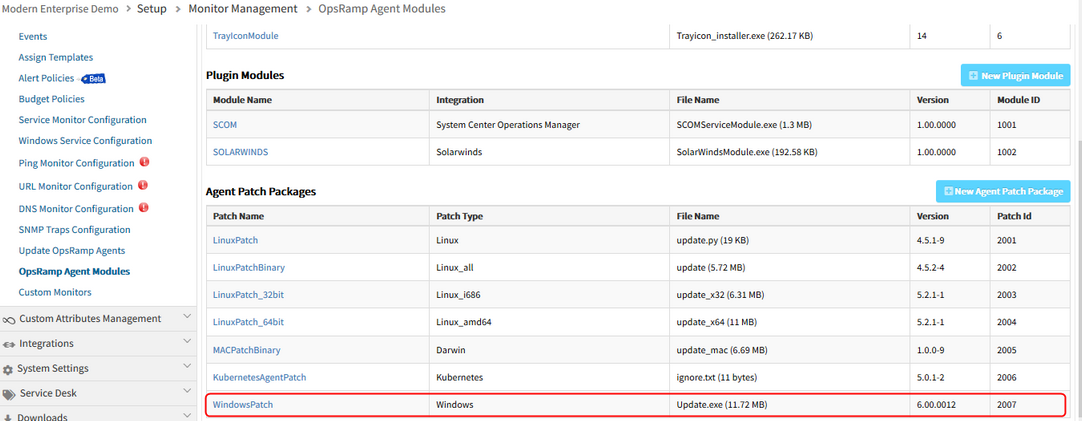
Windows Installer Agent version is showing incorrectly
After Change:
Windows Agent installer version is picked up and shown correctly
Issue is fixed.
Windows Agent installer version is picked up and shown correctly, from G2 Patch.
Web Elements are getting overlapped in the Alerts browser
Web Elements are getting overlapped in the Alerts browser
Elements are showing properly
Issue is fixed.
The elements are showing properly without any overlapping.
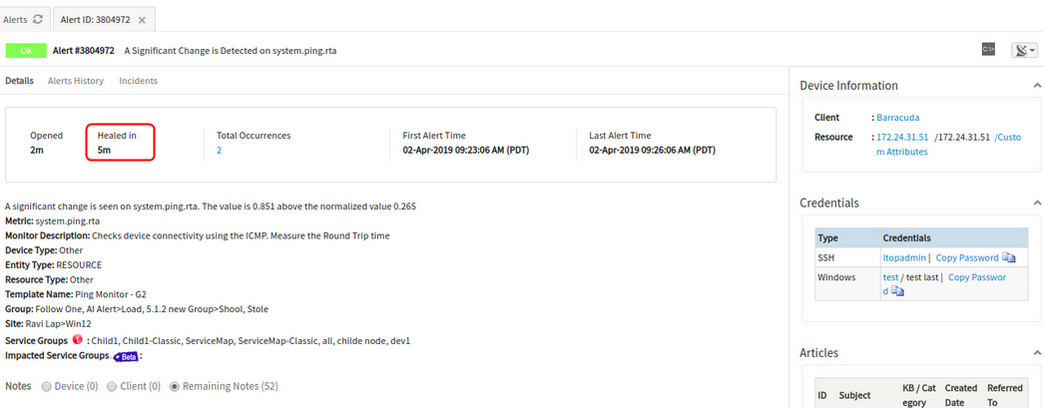
Healed time for the alert is showing differently on the Alerts listing page compared to the Alert details page
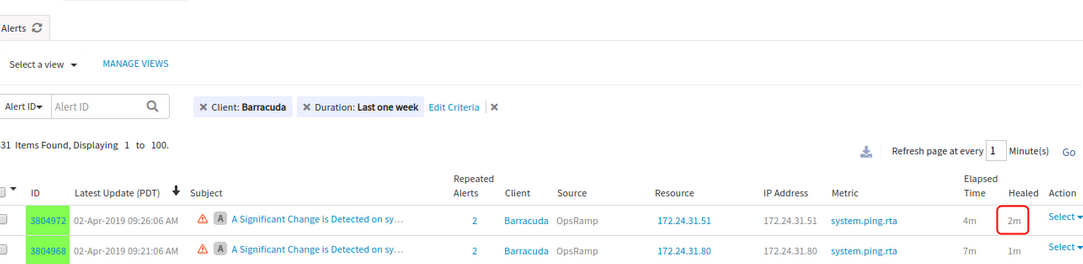
Healed time for the alert is showing differently on the Alerts listing page compared to the Alert details page
Healed time for the alert is showing differently on the Alerts listing page compared to the Alert details page
Issue is fixed.
The Alerts list page and the Alert details page are displaying the Alert Healed time correctly.
No template found on Monitors tab on the Infrastructure page and on templates page under Setup > Monitoring Management
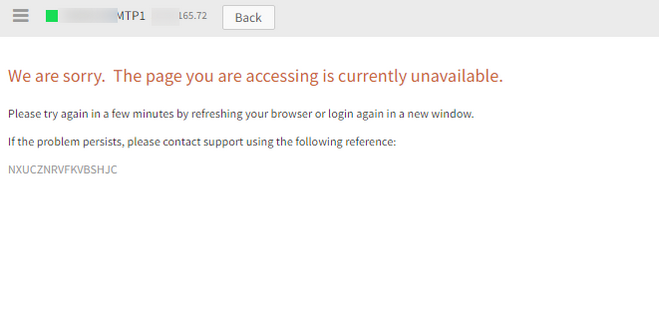
The issue occurred during the Production DB upgrade process. The MySQL DB Schema will be upgraded and also the portal will be slow during maintenance.
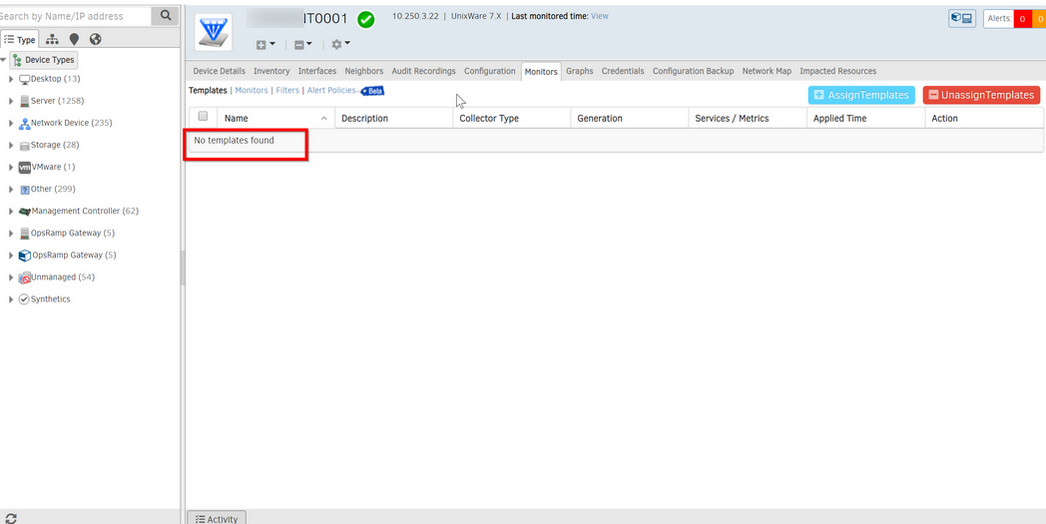
No template found on Monitors tab on the Infrastructure page and on templates page
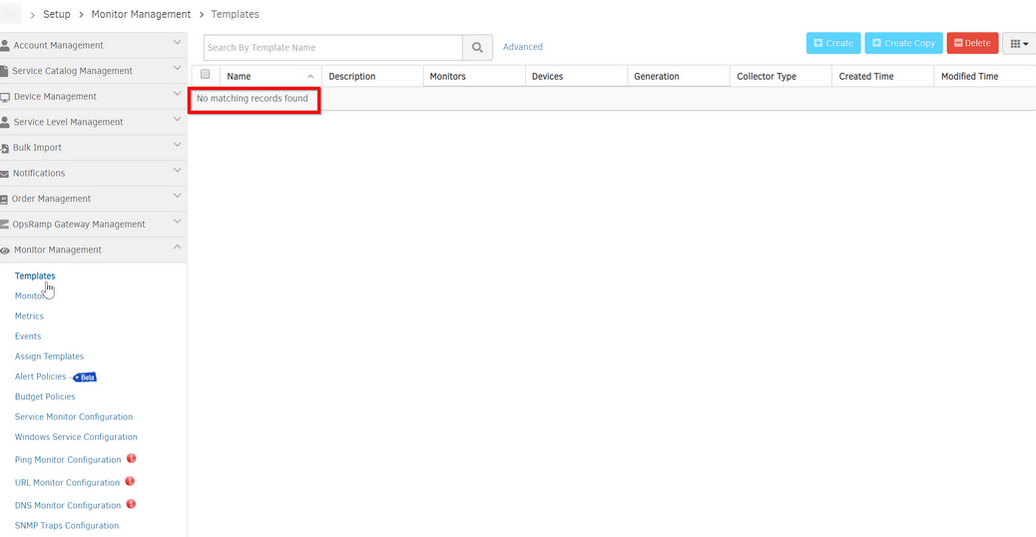
No template found on Monitors tab on the Infrastructure page and on templates page
This is an expected behavior during the upgrade process.
Unable to view the details of the server in the New UI
Details of server are not being displayed in the Overview page of the New UI. The same details can be seen in the Classic view.
Unable to view the details of the server in the New UI
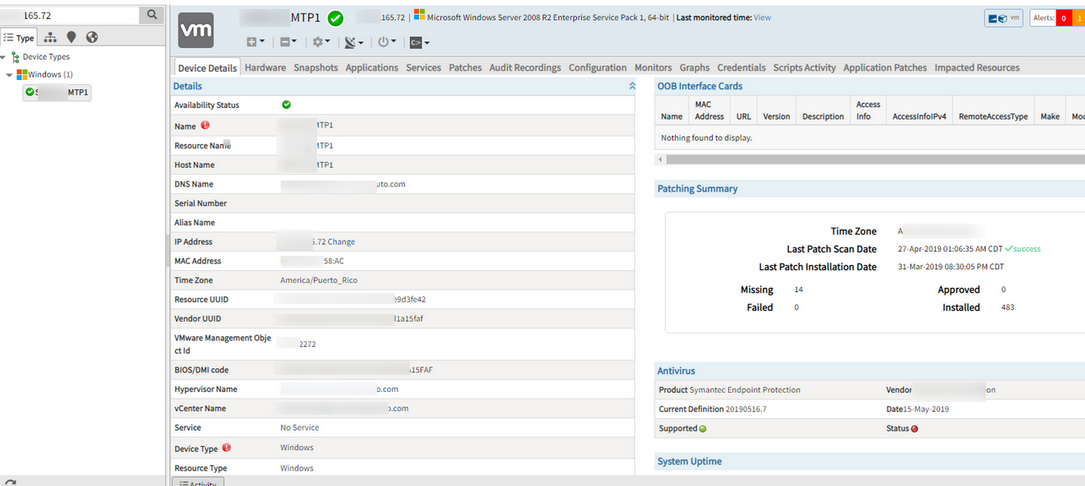
Server details can be seen in the Classic view
Issue is fixed. The details can be seen in the Resources -> Overview page on the New UI.
Alert Management
Service Group shows Inference alerts instead of correlated alerts
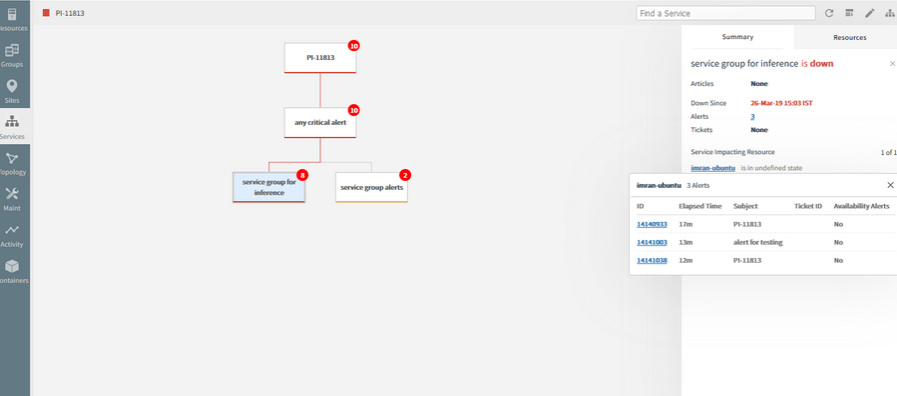
Service Group shows Inference alerts instead of correlated alerts
Now the correlated alerts are not shown in Service Maps.
Only the Inference and any critical standalone alerts count are displayed.
Improved Inference Context
Inferences and incidents created from inferences now include additional attributes and actions to make it easy to interpret and act on them.
Subject
Inferences now include a subject, which corresponds to the subject of the first correlated alert within the inference.
Metric
Inferences are now associated with a metric, which corresponds to the metric associated with first correlated alert within the inference.
First Alert Time
Inferences now include a First Alert Time, which corresponds to the First Alerted time of the first correlated alert within the inference.
Resources
Inferences now include a resource, which corresponds to the resource associated with the first correlated alert within the inference.
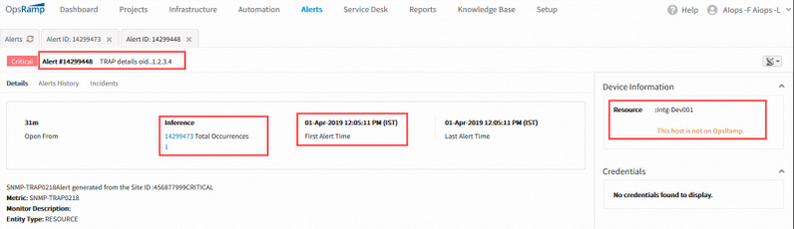
Actions
When an inference is suppressed, acknowledged, ticketed or closed, the same action is automatically applied to each of the alerts correlated to the inference.
Incidents
Incidents that are created from an inference, now include all the resources associated with each of the alerts correlated with the inference. Incidents created via integrations with external ITSM systems carry this resource information.
First Alert Time of an Inference:
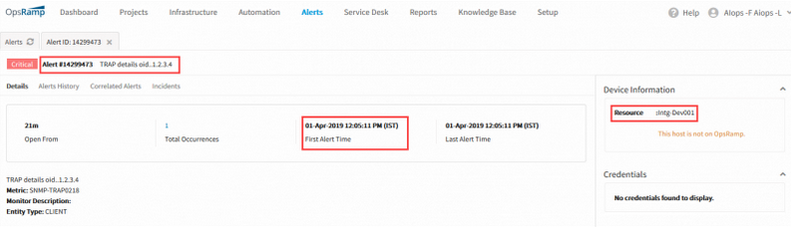
First alert time of an Inference
Resource associated with an Inference:
Resource associated with an Inference
Actions on Inference:
Actions on Inference
Migration from Legacy Auto-Incident Policies
Auto-incident policies have been deprecated in favor of alert escalation policies. Starting with this release, you can no longer create new auto-incident policies or edit existing policies. Your existing auto-incident policies continue to work, however. In addition, if you have auto-incident policies defined, equivalent alert escalation policies have been automatically created in your account. These policies are disabled by default but can be enabled by users. These auto-created policies will all be automatically enabled in a future release.
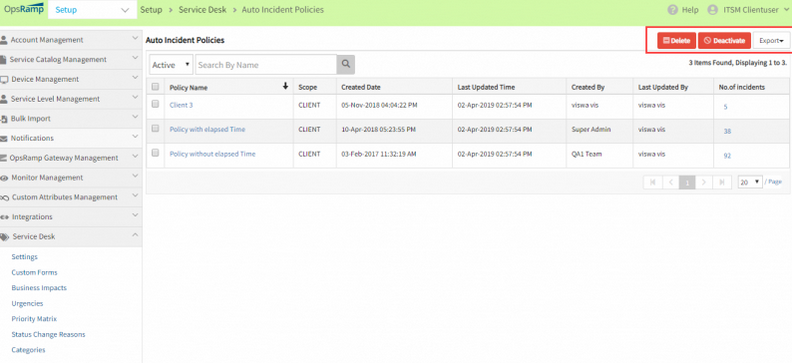
Migration from legacy Auto-Incident policies
Alerts are coming out of Observed Inference when they are healed
Once the alerts are healed, they are not showing in the popup. The count is displaying correctly.
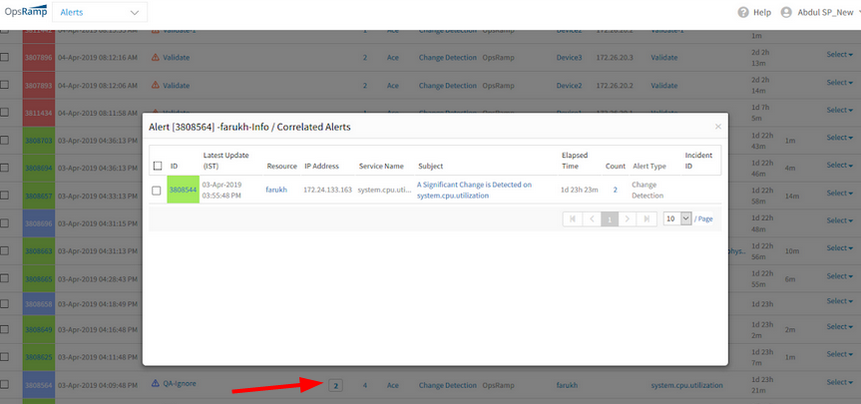
Alerts are coming out of Observed Inference when they are healed
Issue is fixed.
The alerts are not coming out of the Inference on healing.
Integrations
In the process of adding Integration event, when an individual Resource entity is selected, only that Entity’s Additional placeholders should be displayed
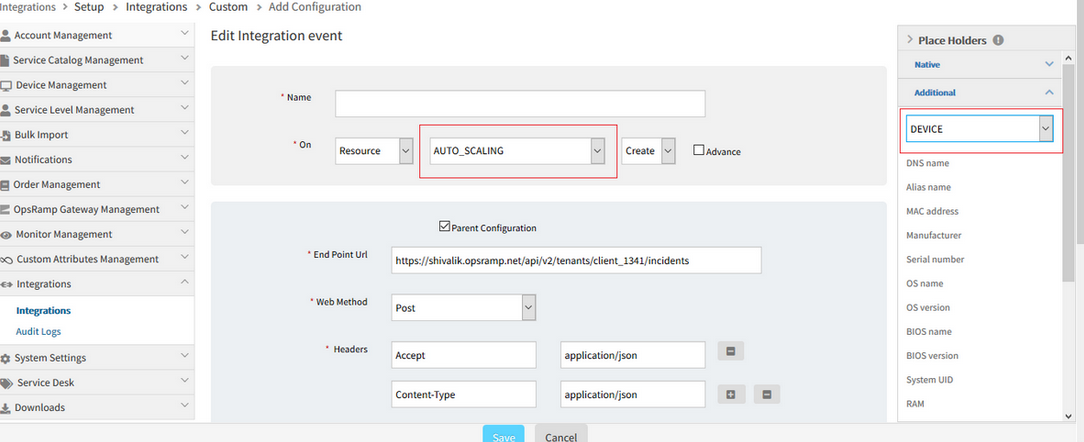
When an individual Resource entity is selected, only that Entity’s Additional placeholders should be displayed
If “Any Resource” is selected, all resource types are displayed in the dropdown in the placeholder section.
If any particular resource like “AUTO_SCALING” is selected, only “AUTO_SCALING” can be seen in the dropdown (in Additional placeholders) and this is disabled, so that the user cannot select any other resource type.
Service Management
Unable to view the create view and refresh view icons under service desk, for client login. The user has all the permissions
Able to view the same icons under Service Provider and Partner logins.
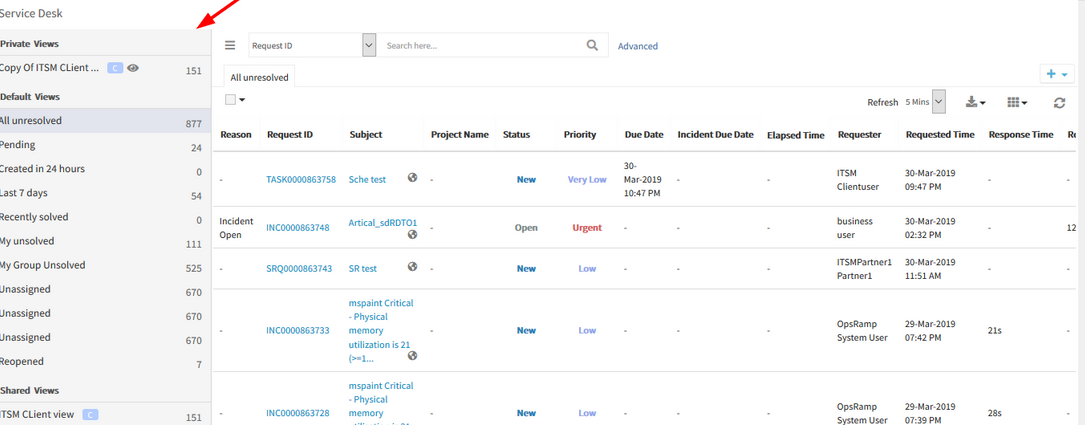
Unable to view the create view and refresh view icons under service desk
Issue is fixed.
Now the user can view these icons under any login.
Viewing Resource Type as Synthetic instead of Web Services
Viewing Resource Type as Synthetic instead of Web Services on the Select Resource popup, when trying to add resources, in Service Desk.
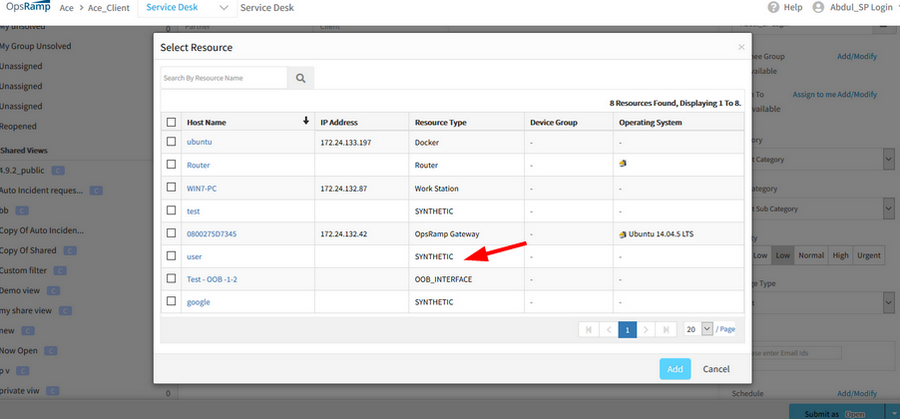
Viewing Resource Type as Synthetic instead of Web Services
Issue is fixed. The Resource Type is displayed as “Web Services”.
Knowledge Base
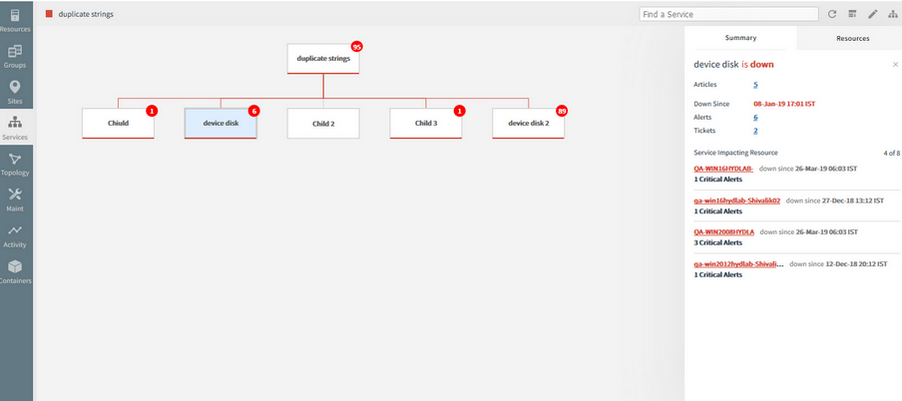
On clicking the Service which is down, the KB articles count is displayed incorrectly on the Service Map page
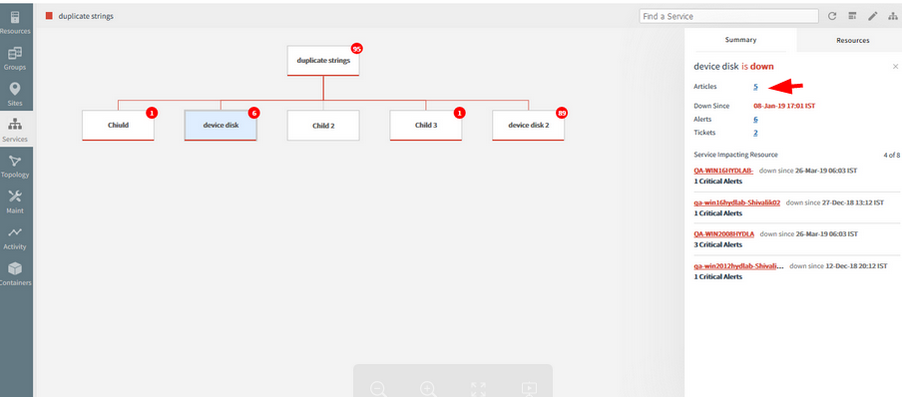
KB articles count is displayed incorrectly on the Service Map page
Issue is fixed.
The KB articles count is displayed correctly on the side panel/Summary tab.
Reports
User report is enhanced to include details of permission sets a user is assigned
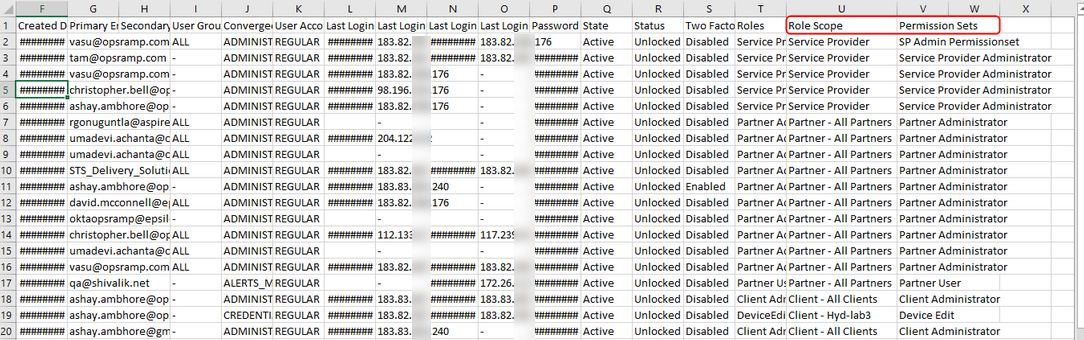
User report is enhanced
Custom reports now provide summarized alert charts
Custom reports provide summarized alert charts, which can be broken down by alert timestamp, action and source.
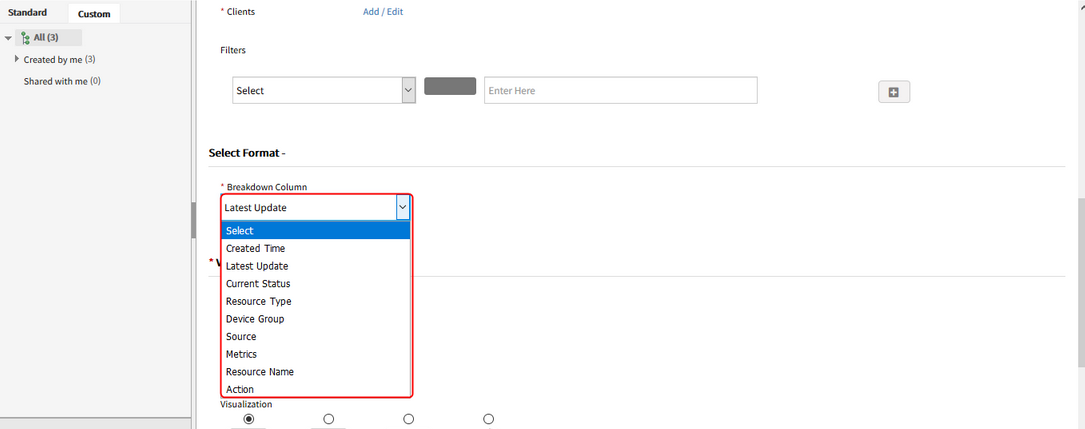
Custom reports now provide summarized alert charts
Reports Listing page breadcrumb issue
On clicking the Custom tab of the Reports listing page and then clicking the Standard tab, the Breadcrumb at the top still shows as Custom. It should show “Standard…”
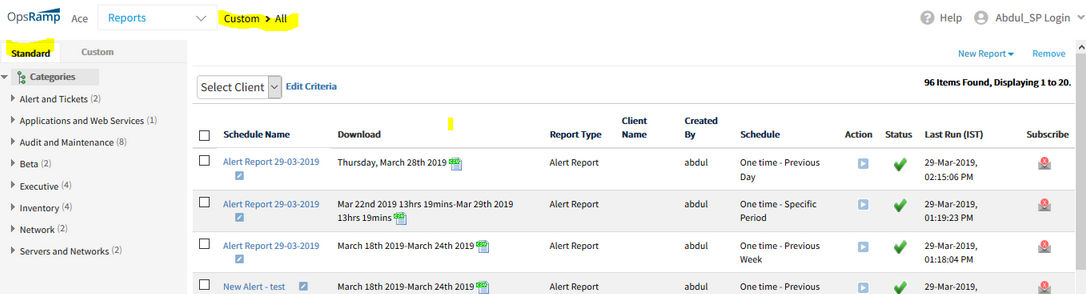
Reports Listing page breadcrumb issue
Issue is fixed. The breadcrumbs are displayed properly when switching between Standard and Custom tabs.
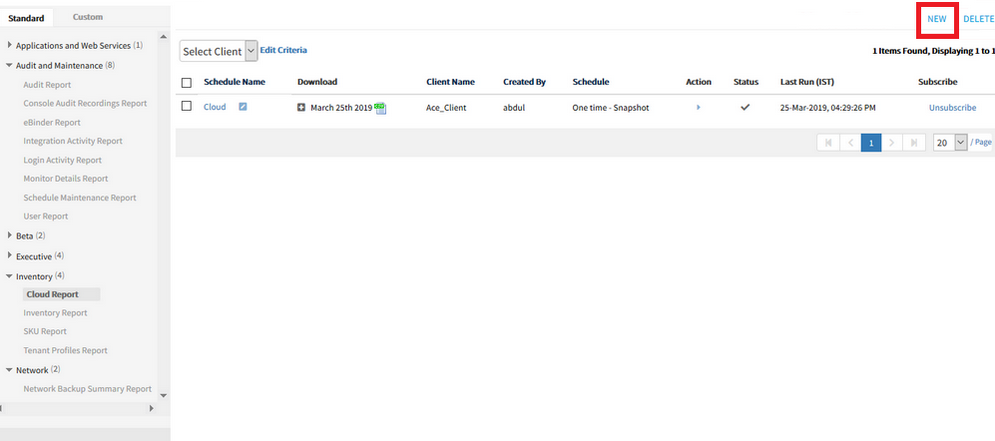
Some Report listing pages have Add option and some have New option
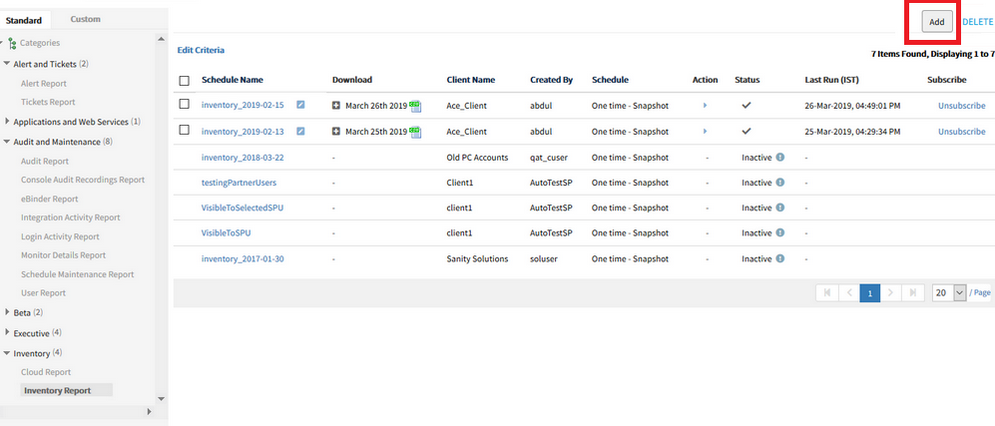
Some Report listing pages have Add option and some have New option
Some Report listing pages have Add option and some have New option
Issue is fixed.
The inconsistency is resolved. The user can view “New” option on all the report categories, to create a new report.
Resource Management
Improved escalation policy resource selection UI; incorporated Tree structure for Service groups
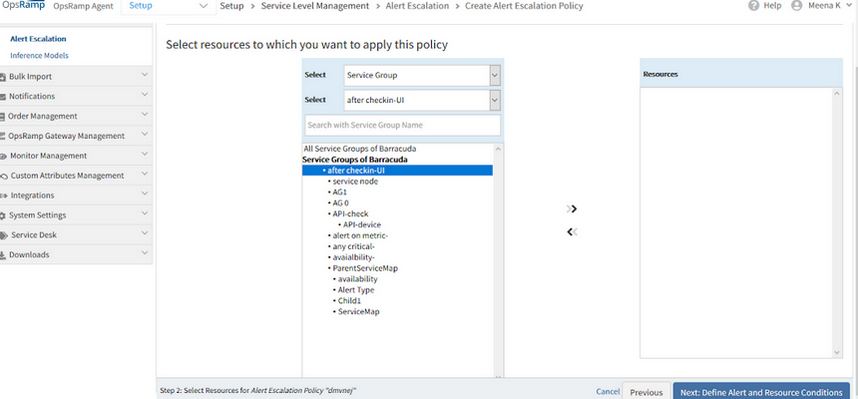
Incorporated Tree structure for Service groups
In the process of assigning the service groups to the escalation policy –
When a Service Group is selected, all the parent level service groups are listed. If a parent level group is selected, all its children are listed.
If there are any sub-nodes under a node, they also will be listed.
Show Matching Members in filter criteria shows “No items found to display”
Filter criteria shows “No items found to display” in Device Management Policy view page when the policy is created for Device groups.
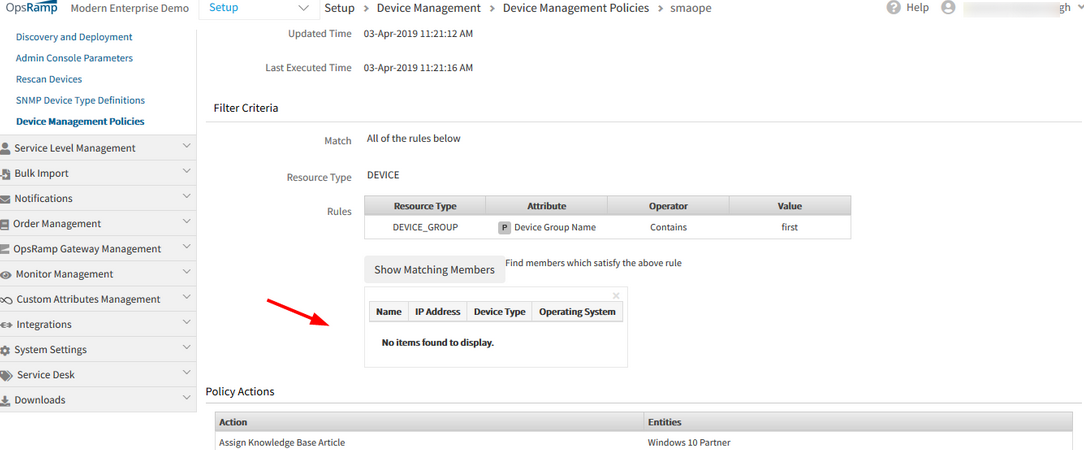
Filter criteria shows “No items found to display” in Device Management Policy view page when the policy is created for Device groups
The device management policy is created with Device Group as filter criteria and it shows matching member/s, but when viewing the same policy, the view page shows no matching members, with a message “No items found to display”.
Issue is fixed. The matching members are displayed correctly.
Cloud Monitoring
Azure Autoscale Metrics
Azure monitors now include the following additional virtual machine scale set metrics.
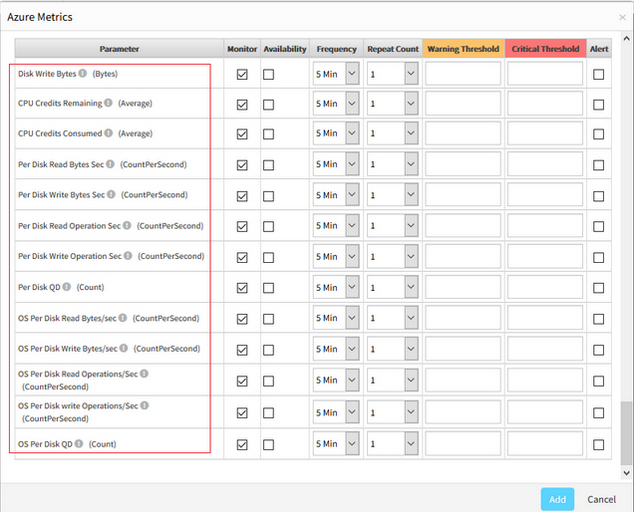
Azure autoscale metrics
AWS CPU Credit Metrics
EC2 monitors now include CPU credit related metrics. With these metrics you can get alerts related to CPU credits.
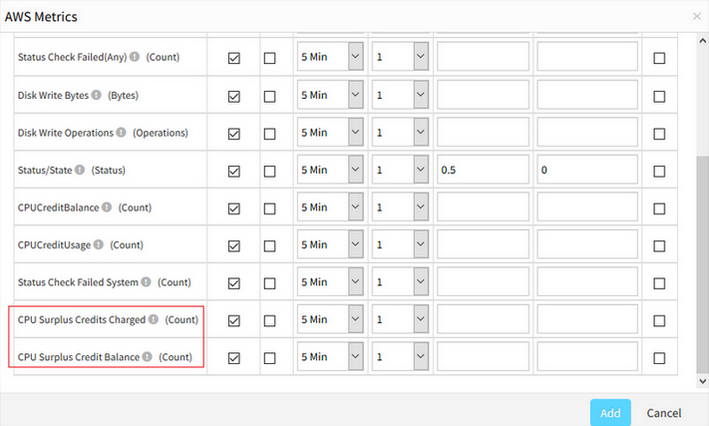
EC2 monitors now include CPU credit related metrics
Availability
Three devices are showing as Unknown in the portal
OpsRamp Agent is showing online on those devices, but Agent graph is not populating in the portal. Reapplied the Agent template and also restarted Agent service, but still devices are showing as Unknown.
Three devices are showing as Unknown in the portal
There is only one availability monitor (Agent status) applied, but able to see one more (Ping) monitor in the database. The Ping monitor was unassigned on the device, but the reference in availability data is left. After removing the stale entries and memcache keys related and then recomputed the availability.
Now, all the three devices are showing up in the portal.
All the three devices are showing up in the portal
APIs
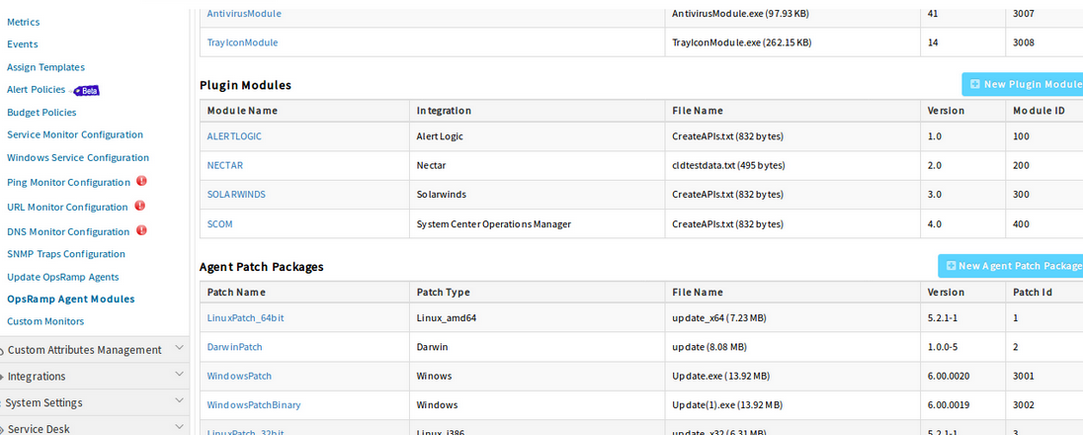
- Antivirus: New API to get the anti-virus definitions available on a device.
- Site: Site APIs have been updated to provide support for zip field.
- Resource: New search minimal details API helps the user to search resources at scale with minimal resource details.