Release Date: September 18, 2019
Dashboards and User Interface
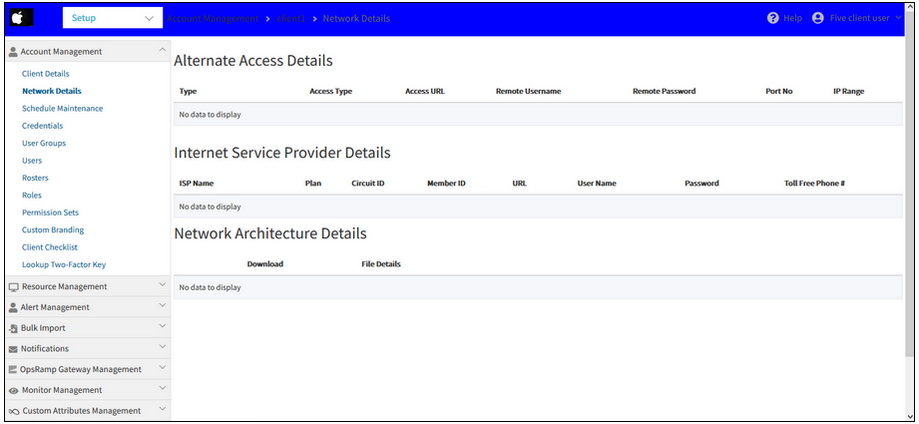
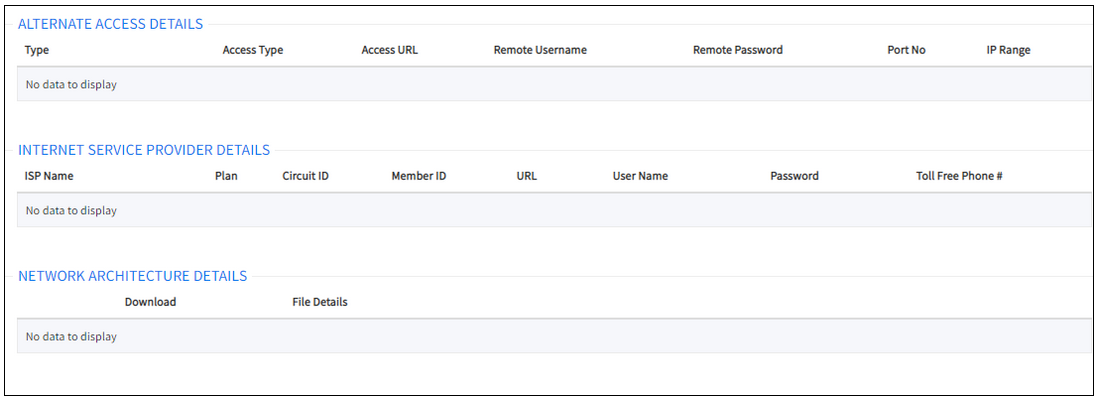
Unable to view Client and Network details pages in the New UI, under Client login
Unable to view Client and Network details pages in the New UI
Unable to view Client and Network details pages in the New UI
Issue is fixed. The Client and Network details pages are showing the information.
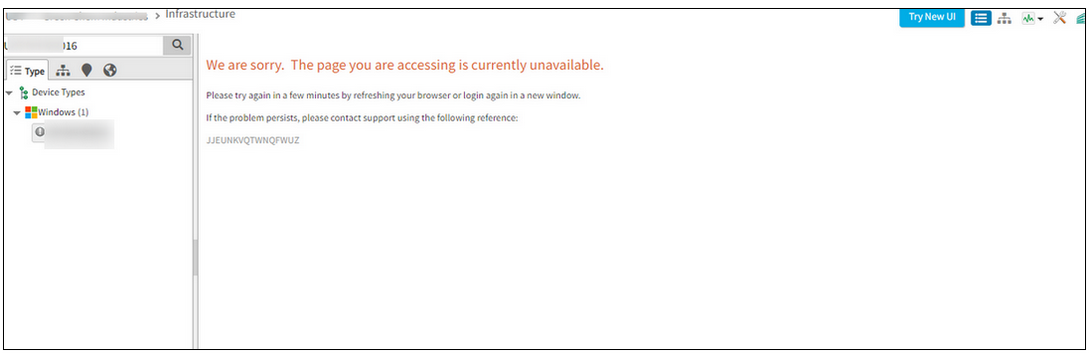
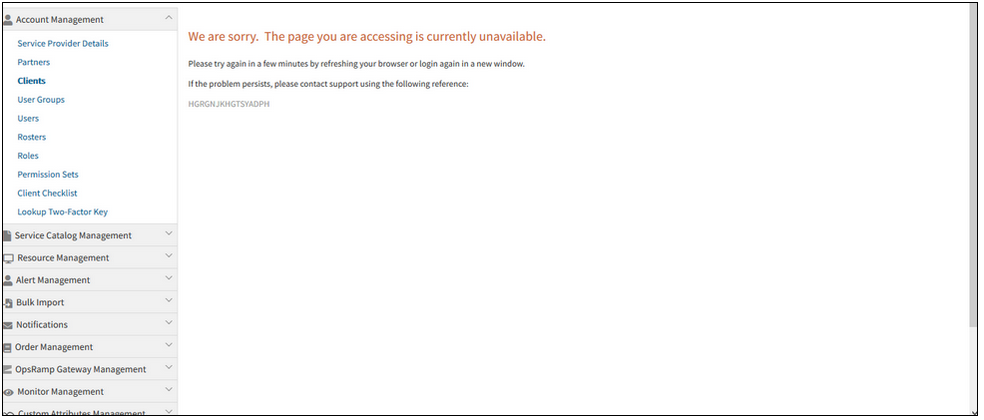
Unable to view device in portal from Classic view
Page is currently unavailable error message is displayed.
Unable to view device in portal from Classic view
Issue is fixed. The device can now be viewed in the portal, in the Classic view.
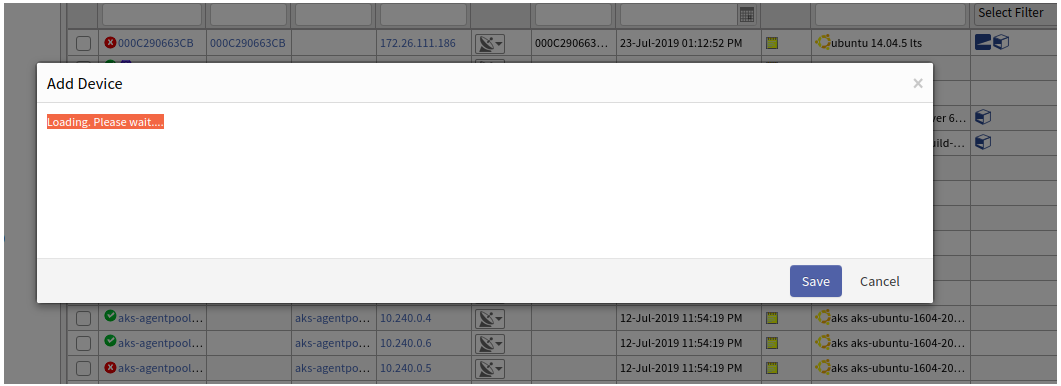
Create or Update Device is not working in Classic UI
After creating a new device and clicking Save, the Add Device popup is displaying a message, “Loading, Please wait”. Same is with the Update Device.
Create or Update Device is not working in Classic UI
Issue is fixed. The Add and Update Device are working properly.
Alert Trend widget is showing blank on dashboard
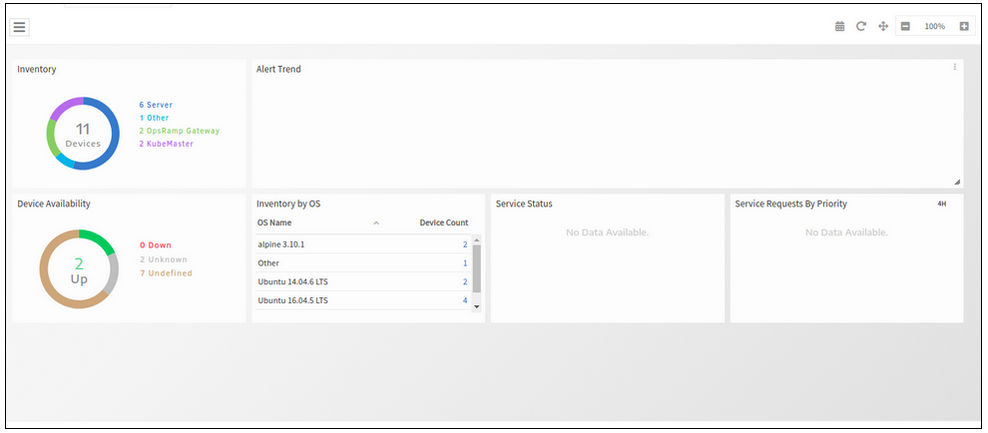
Alert Trend widget is showing blank on dashboard
Issue is fixed. Alert trend widget is loading.
While opening the devices nodes of the Service Map, few of them are showing “500 internal server error”
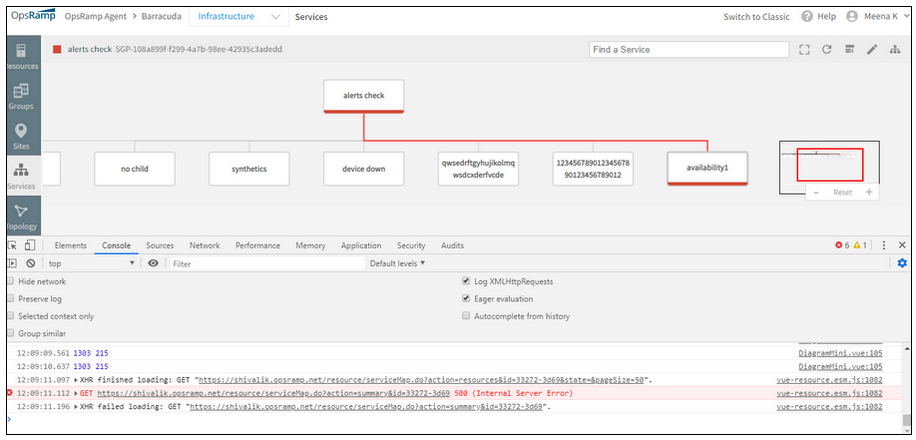
500 internal server error
Issue is fixed. The device nodes are opening properly.
The device nodes are opening properly
Agents tabs are missing on Windows Gateway installation on Windows device that is already having Agent installed
The list of tabs that are missing are:
- Snapshot
- Installed Software
- Services
- Patches
- Script Activity
- Application Patches
- Antivirus
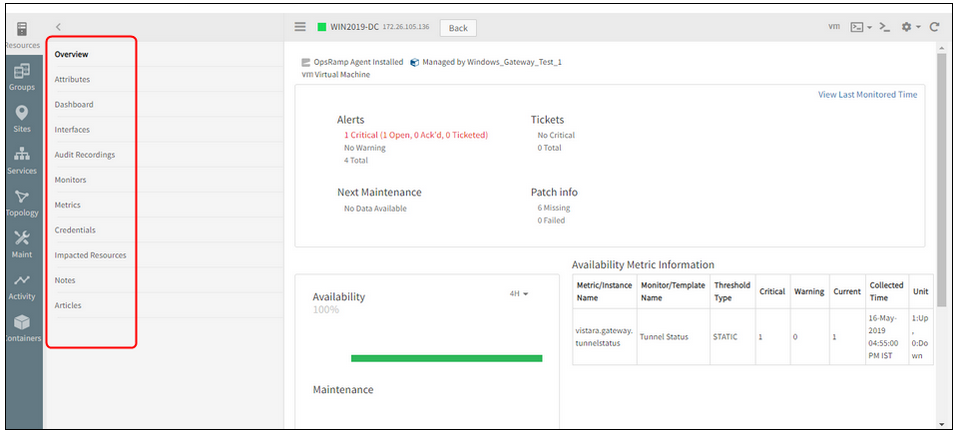
Agents tabs are missing on Windows Gateway installation on Windows device
If the Windows device has Agent installed, then all the related tabs are shown based on Agent installation check and device type.
But if the Windows Gateway is installed, then device type will be changed to “OpsRamp-Gateway,” so now tabs are displayed as per device type (i.e., Now the device type is OpsRamp Gateway). Due to this, previously displayed tabs are missing.
After installing OpsRamp Agent and Gateway on the Windows device, the tabs are displayed properly both in Classic as well as the New UI.
Issue is fixed.
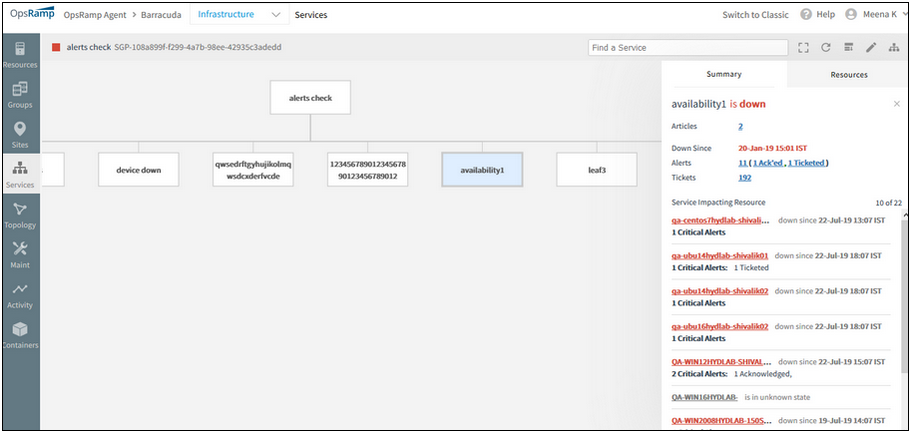
Unable to open existing service maps, displays an error message, “Error fetching Service Map”
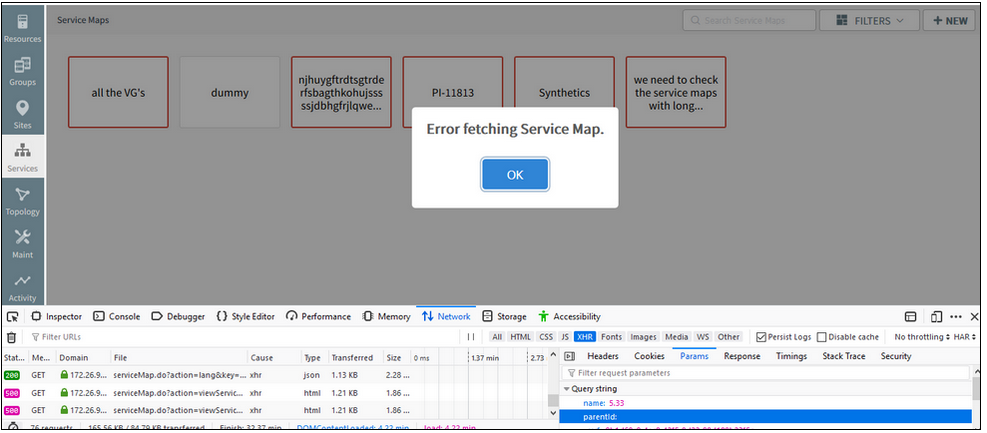
Unable to open existing service maps, displays an error message
Issue is fixed. Service maps are loading properly.
Clicking on the Edit icon in the Client details page is showing an error message
Clicking the Edit icon in the Client details page is showing an error message
Issue is fixed. The Client details page is displaying properly.
Showing RAM units in GB for VMware devices, when Hardware option is selected under the device
It is displaying correctly (in MB) when opened from the Hosts tab for the same VCenter device.
This is the same case in the Classic UI too.
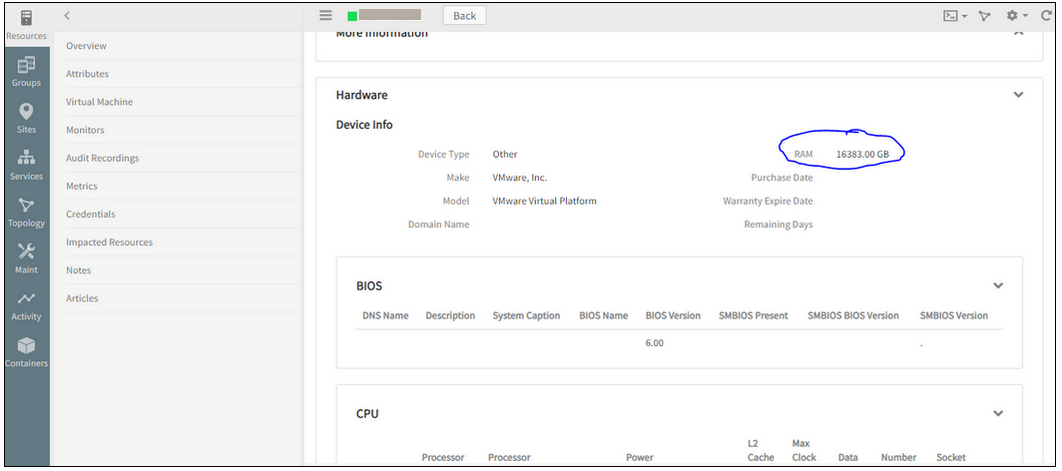
Showing incorrect RAM units for VMware devices
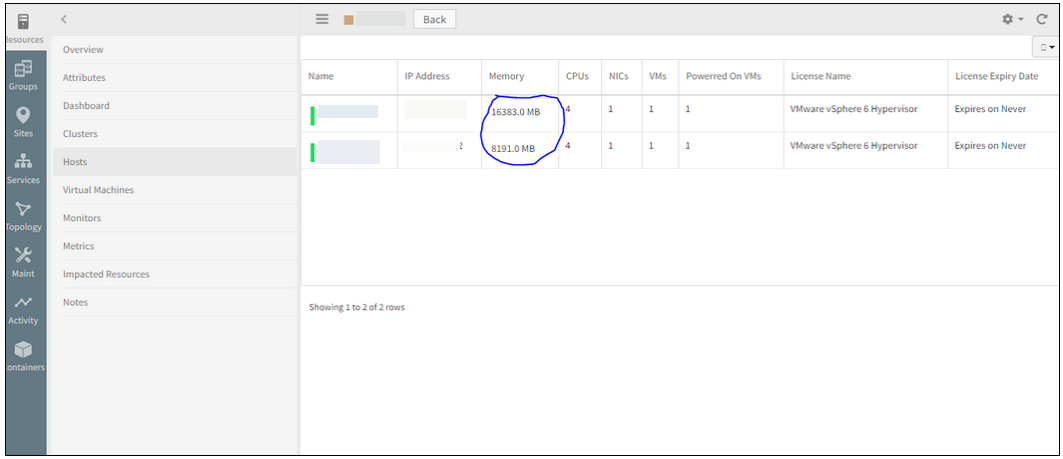
Displaying correctly (in MB) when opened from the Hosts tab
Issue is fixed. The units are displayed correctly now, in MB, in both the cases, i.e., even when the device is opened from the Hardware tab as well as from the Hosts tab, in the Classic and the New UI.
Delete option in Non-Monitorable Cloud Resources details page is not operable
Unable to delete the Workspace and Lightsail resources.
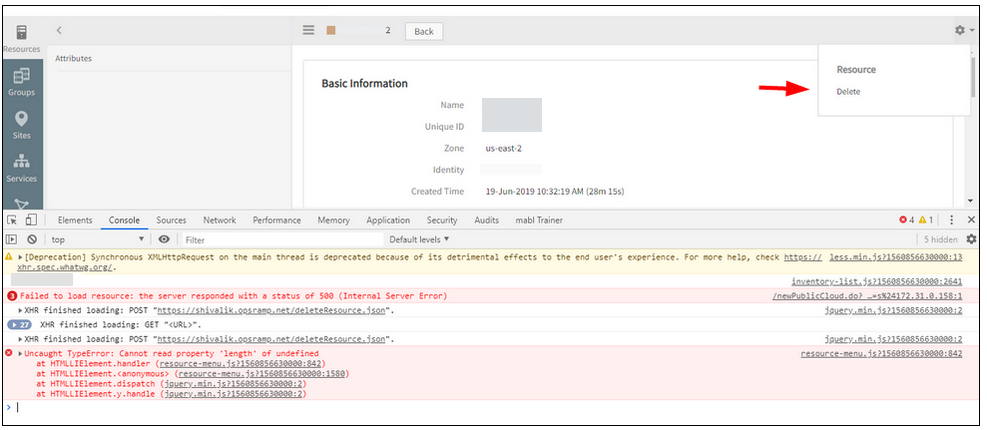
Delete option is not operable
Issue is fixed. Able to delete the resources successfully.
In the process of adding SNMP Device Type Definitions, improper SNMP OID is supported
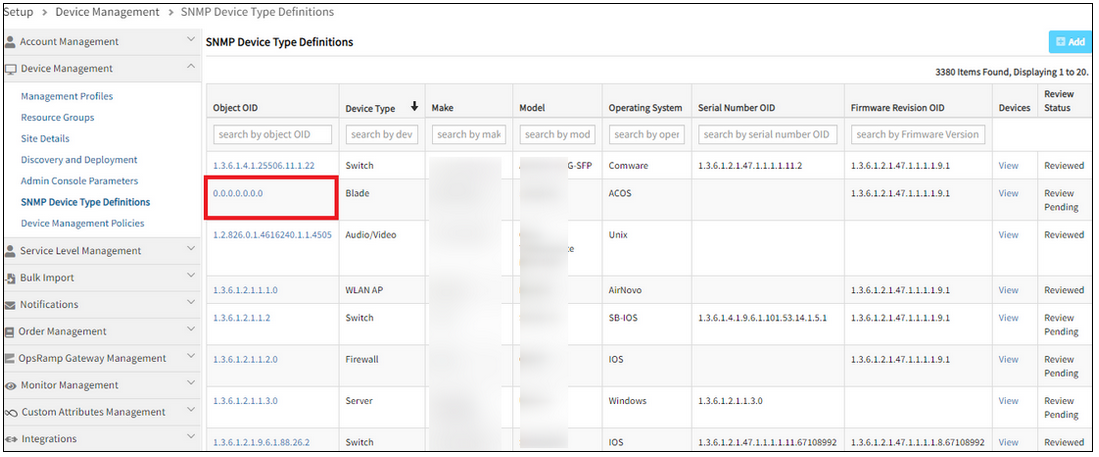
Improper SNMP OID is supported
Issue is fixed.
The SNMP OID with special characters are not allowed. Example: ‘1.2.3.4.5.1.0’, ‘1.1.0.2.6.1.0.
Showing New/Delete icons in the New Category creation page in Knowledge Base
Showing New/Delete icons in the New Category creation page
Issue is fixed. These New and Delete icons are removed from the New Category creation page.
These icons can be seen on the Article listing page.
Post Viptela and CradlePoint Integration, the icons are same for both, on the Infrastructure page
Post Viptela and CradlePoint Integration, the icons are same for both
Issue is fixed. Separate icons can be seen for Viptela and CradlePoint.
UI issue in alert description
Alert description has many “|” symbols (vertical bar) and the description is split into many sentences that have lot of spacing, instead of an appropriate paragraph.
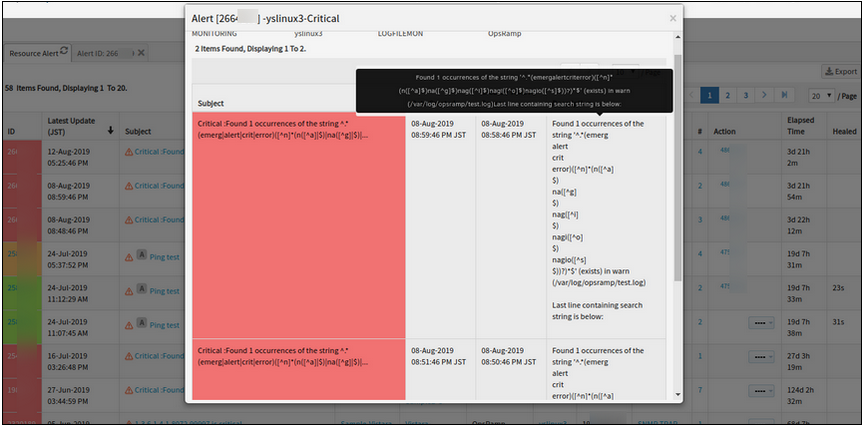
UI issue in alert description
Issue is fixed. The alert description is displaying correctly.
The newly created service map is, by default, showing the linked icon, even though the service map is not linked to any service map
The newly created service map is, by default, showing the linked icon
Issue is fixed. The newly created service maps are not showing the Link icon by default.
By default, no service map is created with Link icon (it should be a child to some other parent in some other tree).
The alert listing is not displayed in the service map side panel
On clicking the alerts count under the device name, in the Summary tab, the popup that is displayed, is not showing the alerts list. An empty list is displayed.
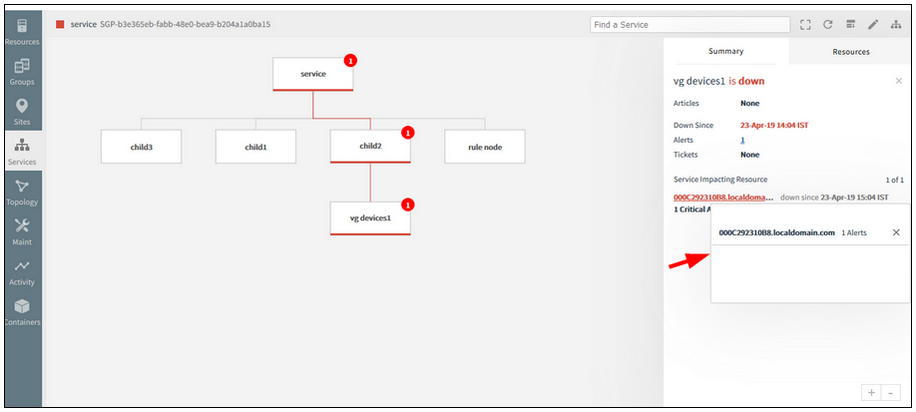
The alert listing is not displayed in the service map side panel
Issue is fixed. The alerts popup is showing the alerts list properly.
Pods and Services are not part of Kubernetes topology, should be removed
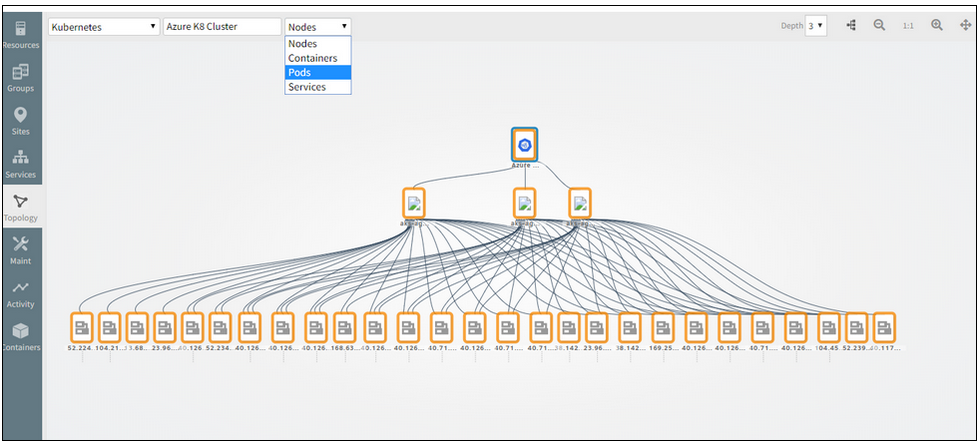
Pods and Services are not part of Kubernetes topology
Issue is fixed. Removed Pods and Services from the selection dropdown (filter option) for Kubernetes Topology.
The filter feature is not working properly in the Service Maps listing page
The service maps should be filtered according to the filter, like Standalone Services and the Linked Services.
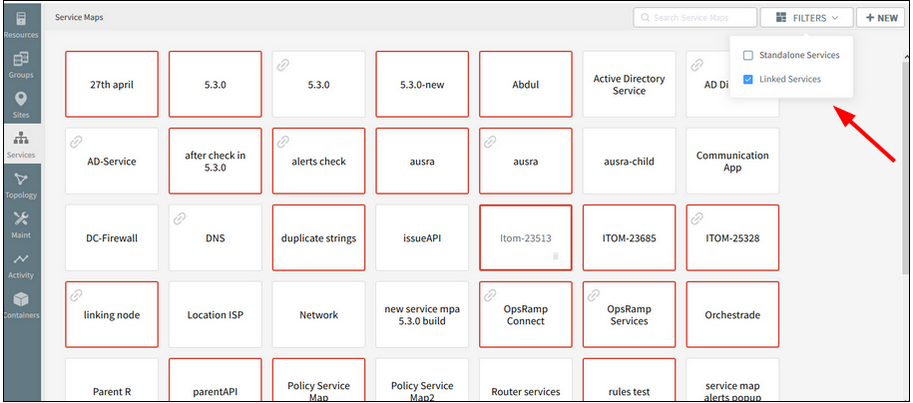
The filter feature is not working properly
Issue is fixed. Service maps listing is displaying correctly according to the Filter.
Added Full screen button on the Service Map Page
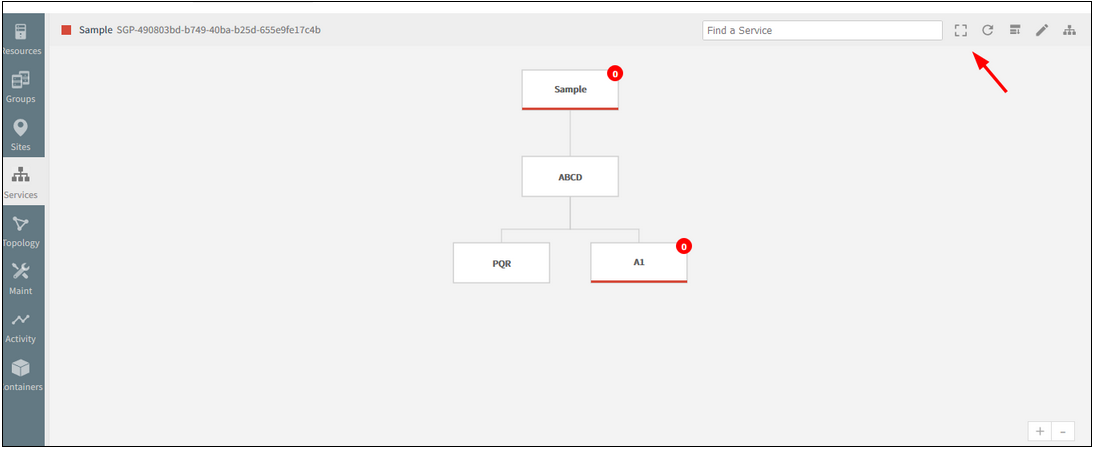
Added Full screen button
Using this feature, view the whole service map (diagram) on a single page, without having to scroll horizontally or vertically.
Clicking the full screen button available on the toolbar will switch from normal screen to full screen view.
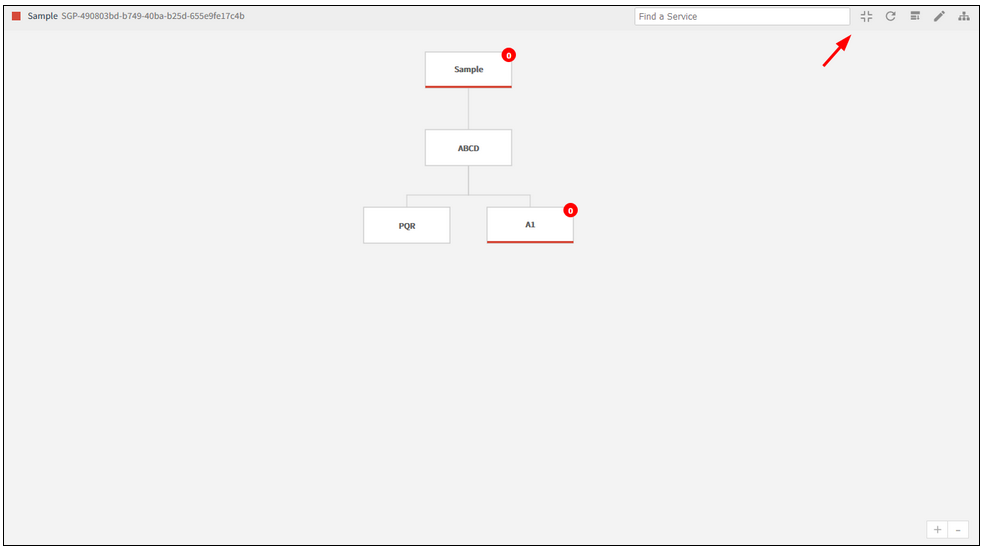
Clicking the full screen button will switch from normal to full screen view
Clicking the button on the toolbar, as shown in the image above, will switch back from full screen view to normal screen.
Typeahead search support provided in the New Infrastructure listing page (Hostname and IP address)
As the user types in the search field (2 or more characters), one or more matches for the search item (s) are found and immediately presented to the user.
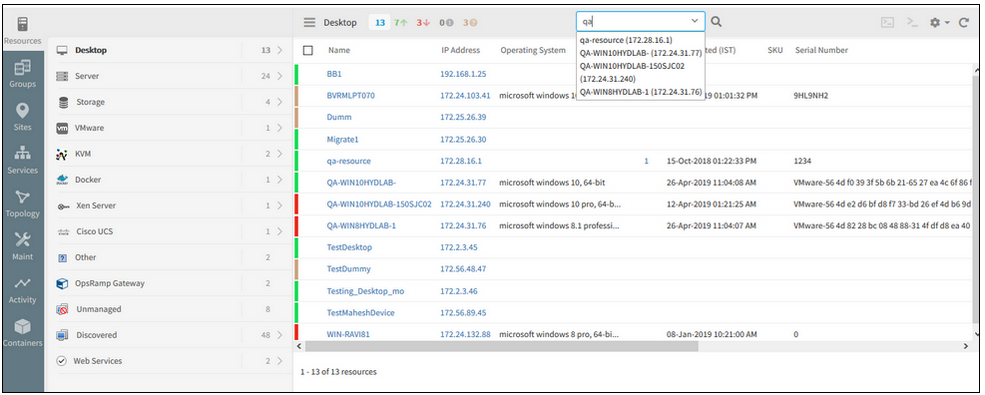
Typeahead search support provided
Name column is made default column in the new infrastructure listing page
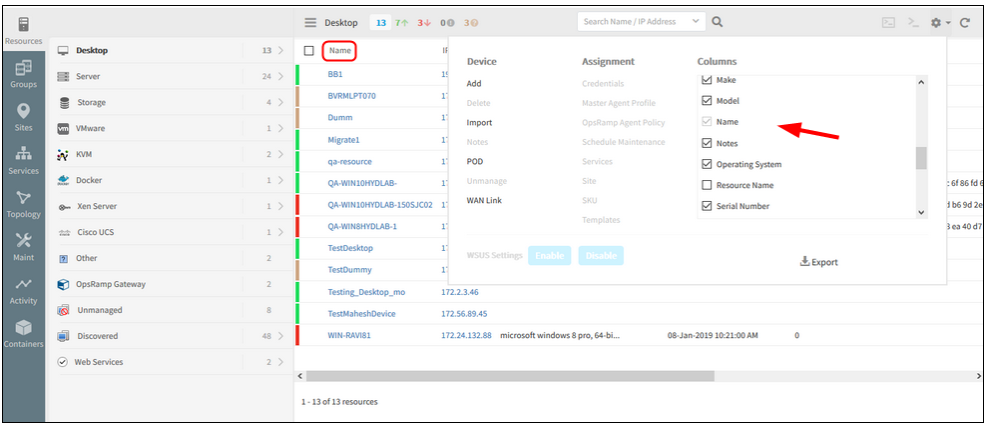
Name column is made default column
In the New Infrastructure Listing page, in the settings dropdown, Columns selection, Name column is not disabled for column configuration.
Port Number field in SNMP trap configuration page is removed
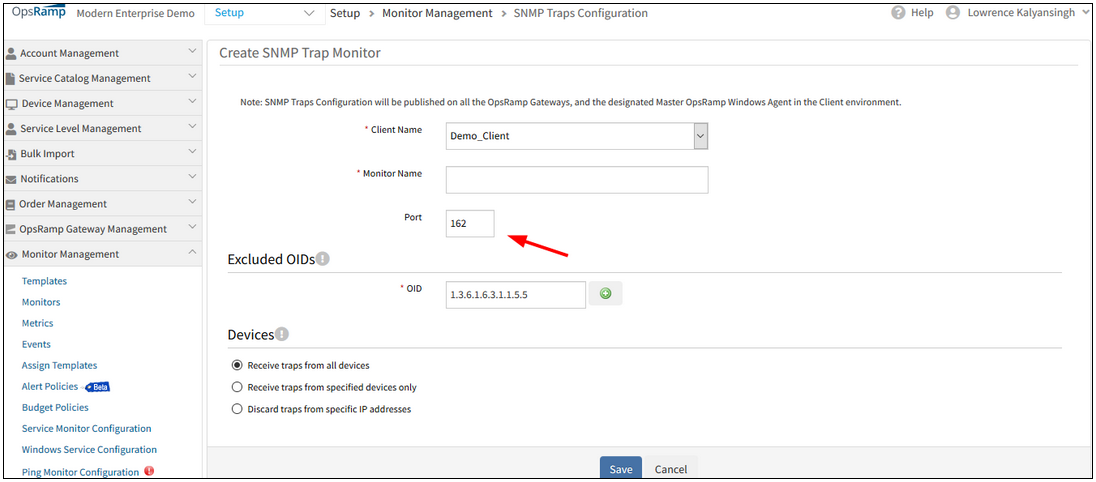
Port Number field is removed
The editable port number option in the SNMP Traps configuration page is removed from the UI.
Custom Attributes are not getting saved for the clients
When user selects a custom attribute in the Columns section against the client (on the Infrastructure listing page), the attribute is not getting saved for that client.
When user changes the client and selects any other new custom attribute and later selects the previously selected client, the old (previously selected) custom attribute value does not appear.
As a result, the customer will have to select the custom attribute option every time they select/reselect the client.
Issue is fixed.
Improved Widgets
The following widgets have been enhanced to provide visualization of data for any type of resource: metric list widget, metric value widget, generic widget, and top metric value widgets.
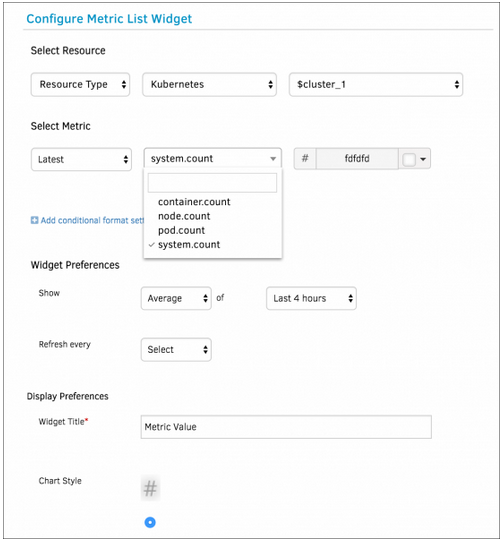
Improved Widgets
Default dashboards for Kubernetes
A new default dashboard template that shows the overall health of Kubernetes environment is now automatically created if you install the Kubernetes environment.
Improved resource listing page
You can now open a new browser tab from resource listing to see resource details.
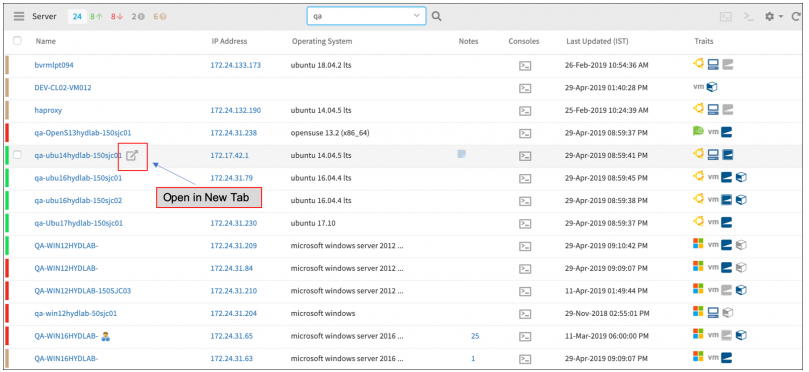
Improved resource listing page
Improved resource details page - Typeahead for custom attributes
You can now easily assign and unassign custom attributes on resource with typeahead.
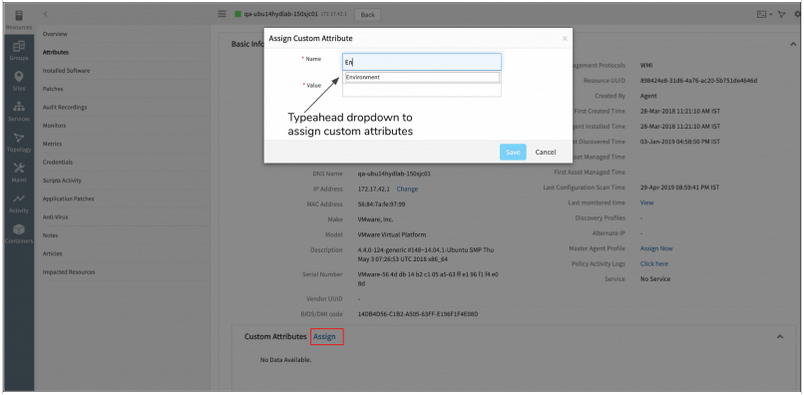
Typeahead for custom attributes
Improved dashboard templates
You can now define dashboard variables for specific resource types. This allows you to create dashboard templates for common use cases such as default dashboards for your Kubernetes or Public Cloud environments.
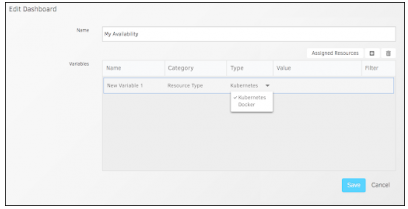
Improved dashboard templates
SSO Integrations unified under Integrations UI
Single Sign-On (SSO) Integrations have now been moved from under the Client page to Integrations. All integrations are now available in the new and improved Integrations page.
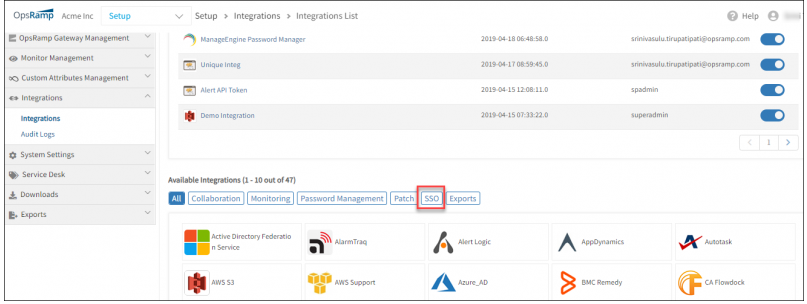
SSO Integrations unified under Integrations UI
Alert Management
Cannot save Alert Escalation
The loading screen is stuck and continuously loading; it is displayed with an error message, “Loading, please wait”.
Also, Alert and Resource Conditions in Alert Escalation policy for Alert State is having Operator issue.
Instead of showing as “Is” it is showing as “Contain”. This is causing policy creation failure.
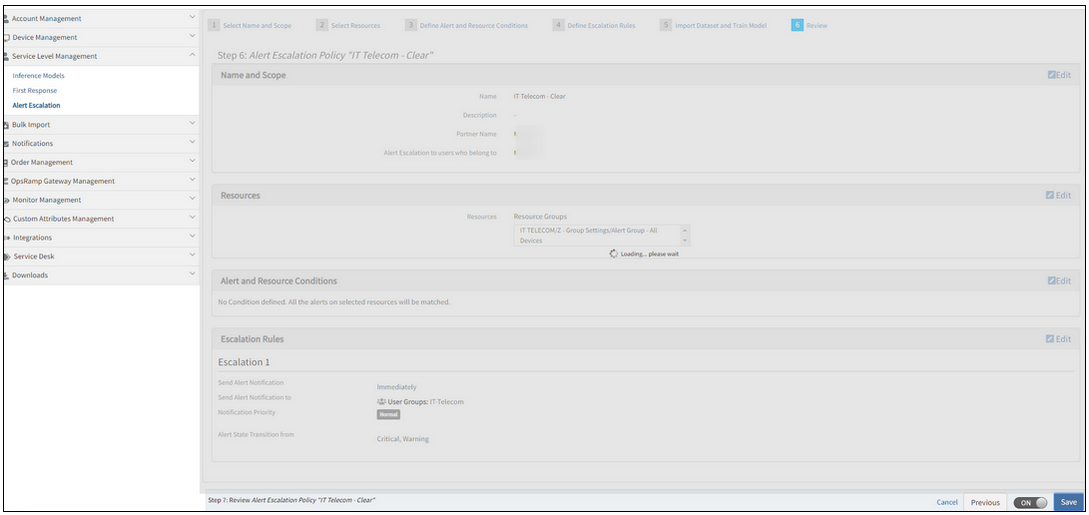
Loading screen is stuck and continuously loading
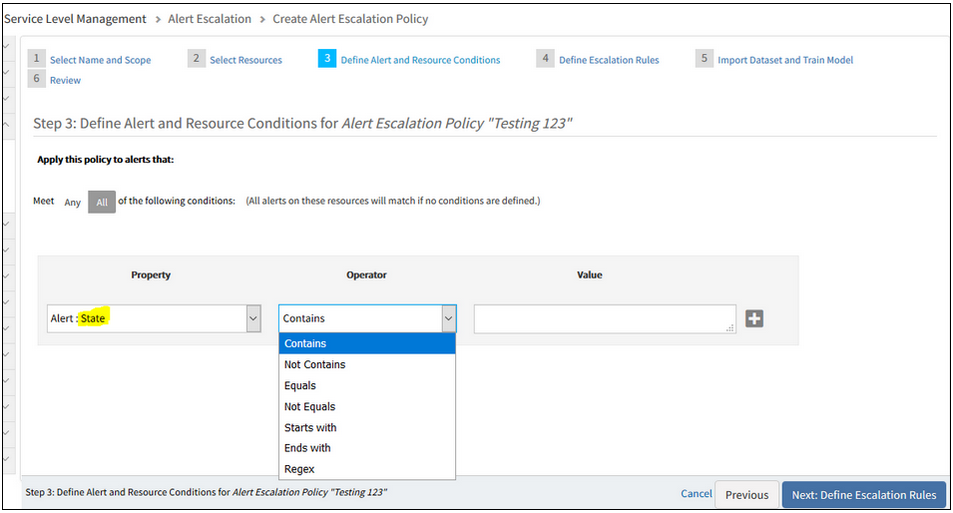
Instead of showing as 'Is' and it is showing as 'Contain'
Issue is fixed. The “Is” Operator is displayed in the dropdown list while defining alert and resource conditions.
Alert Escalation policy is being created successfully.
Alert escalation is creating new tickets for the incidents that are already in suspended mode
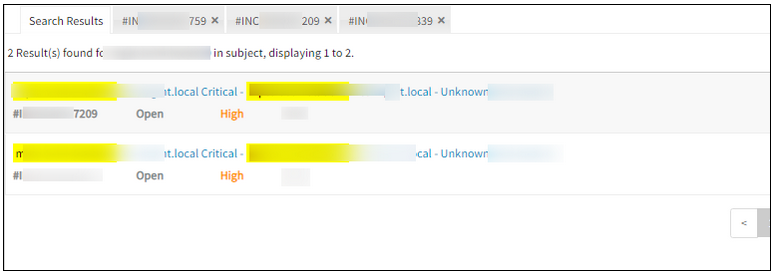
Alert escalation is creating new tickets
Issue is fixed. There are no multiple incidents being created for the same issue.
Missing notification Emails for the Alerts
This is due to the combination of special characters ‘#’ and ‘(’ in alert description while sending the Email notification.
Issue is fixed.
Now Email notification with special characters in Alert description (and subject), from the Escalate alerts policy is working correctly, and the Email notifications are received properly.
Change Detection Graph is not populating for some metrics
After a Change Detection template is assigned to a device, the graph is not populating; the alerts are not triggered for some of the metrics like: system.cpu.utilization, system.memory.usage.physical.
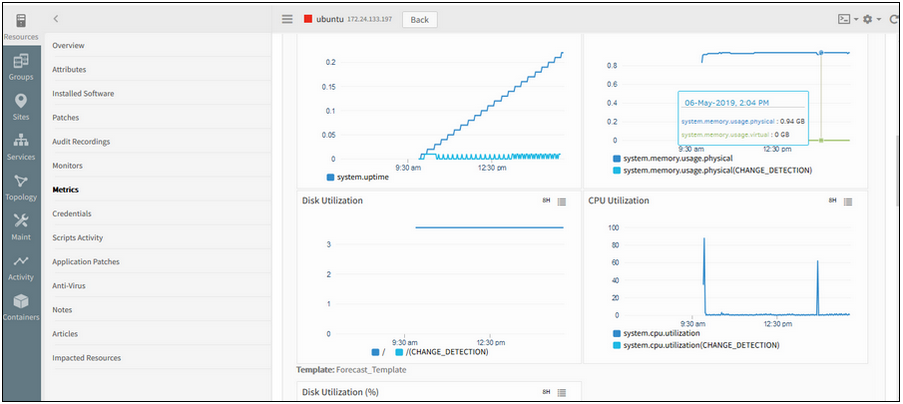
Change Detection Graph is not populating for some metrics
Issue is fixed. The graphs are showing fine now for the above metrics.
When the ML model is training, hovering over the ML icon is showing the “Seasonality Count is…” score
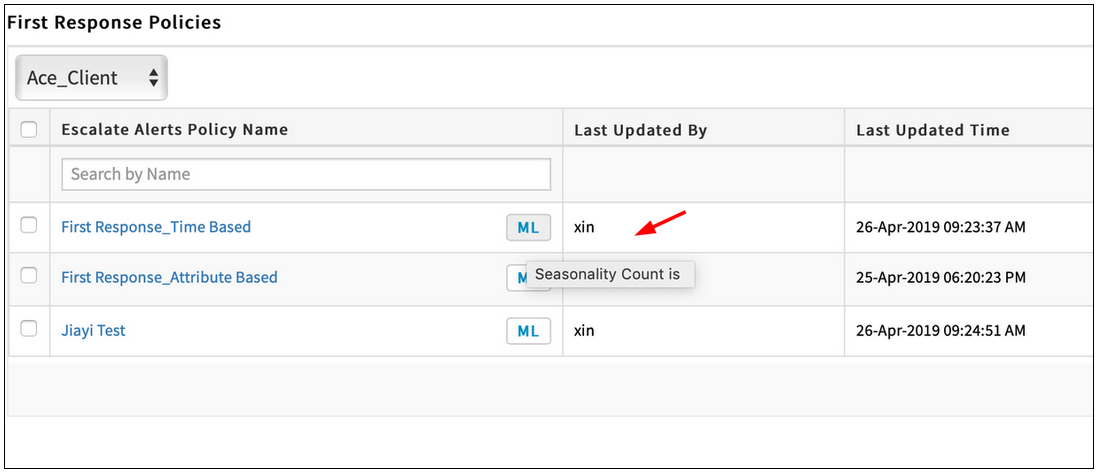
ML icon is showing the 'Seasonality Count is…' score
Issue is fixed. The model score is not shown when the model of the First Response Policy is in training.
Unable to delete First Response policies from the listing page
After selecting all checkbox and clicking the Remove button, a popup is displayed with an error message. The policies are not getting deleted.
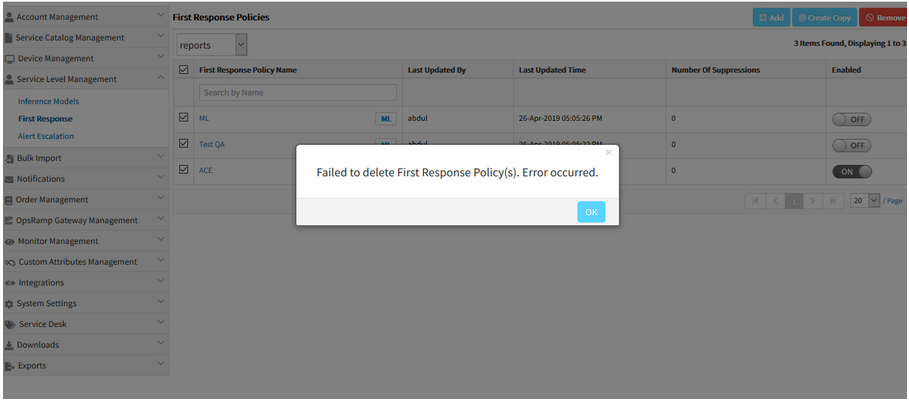
Unable to delete First Response policies
Issue is fixed. Able to delete the First Response policies by selecting the all checkbox option and clicking the Remove button.
Removed automatically set Enabled to OFF behavior on low accuracy ML policies
Due to some complications, the logic (or behaviour) to automatically set the low accurate ML correlation policy is OFF is removed.
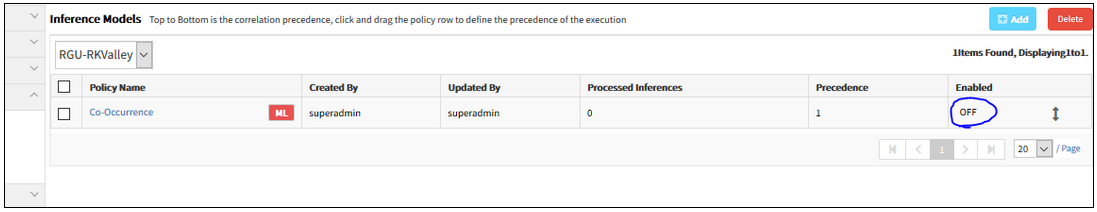
Removed the automatically set Enabled to OFF behavior
Issue is fixed.
Even when the model score is less than 70, it takes the Enabled status, which the user provides while creating the policy.
Even when the model score is less than 70, it takes the Enabled status
While creating an inference, after selecting Resource type, it does not list the resource types in the dropdown
In the process of creating an inference, after selecting the filter criteria and then the Resource type under native attributes, the resource types are not listed. Same is the case with the Service Group and Resource Group.
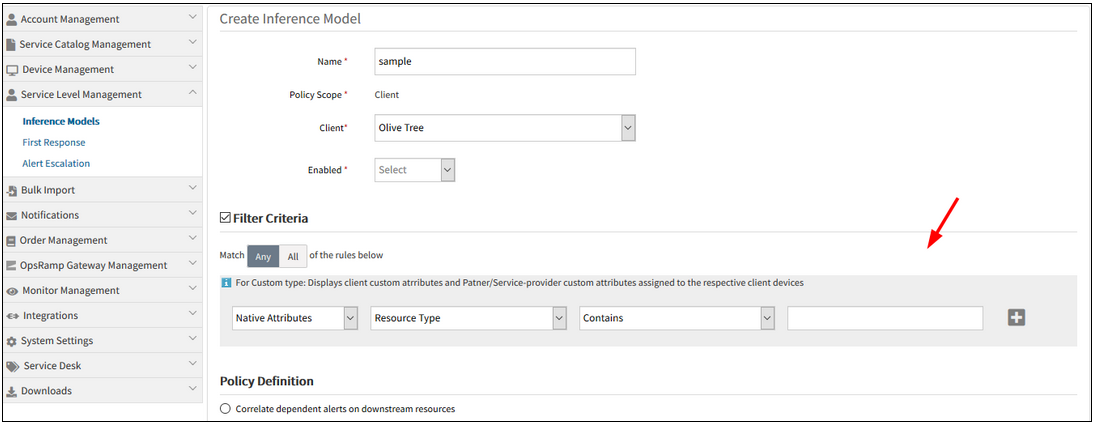
Does not list the resource types in the dropdown
Issue is fixed. Resource types are listed in the dropdown when the Resource Type option is selected. Also, when the Service Group and Resource Group options are selected, the lists are displayed accordingly.
As First Response Policy also has the same functionality, the fix is also applied there.
Fix also for First Response Policy
In the process of creating an Inference Model, when the Filter criteria is Contains, a dropdown should not be displayed
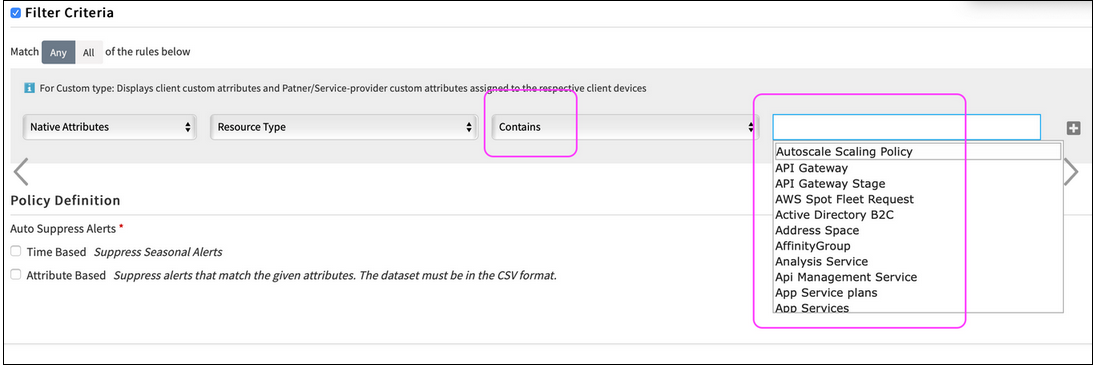
When the Filter criteria is Contains, a dropdown should not be displayed
Issue is fixed.
Dropdown is not displayed for all filter options, except “Equals” and “Not Equals” in Filter Criteria, for Alert Escalation, Inference Model and First Response policies.
Observed Mode for Alert Escalation
Observed mode is now available for Alert Escalation policy. With Observed mode enabled on an Alert Escalation policy, alerts with Observed status are created to display the recommendation on incident routing, prioritization, categorization.
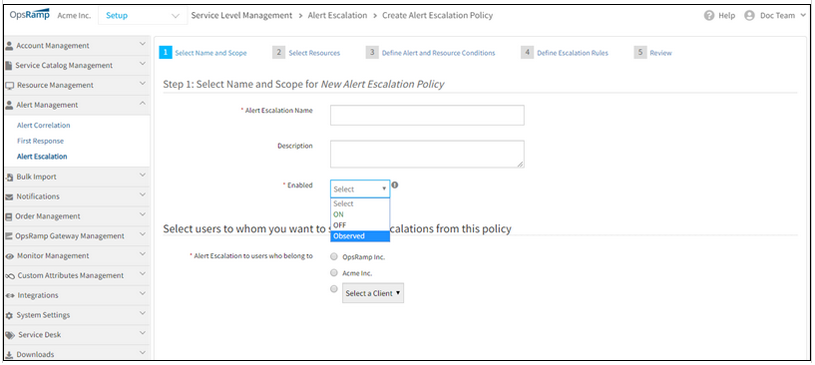
Observed Mode for Alert Escalation
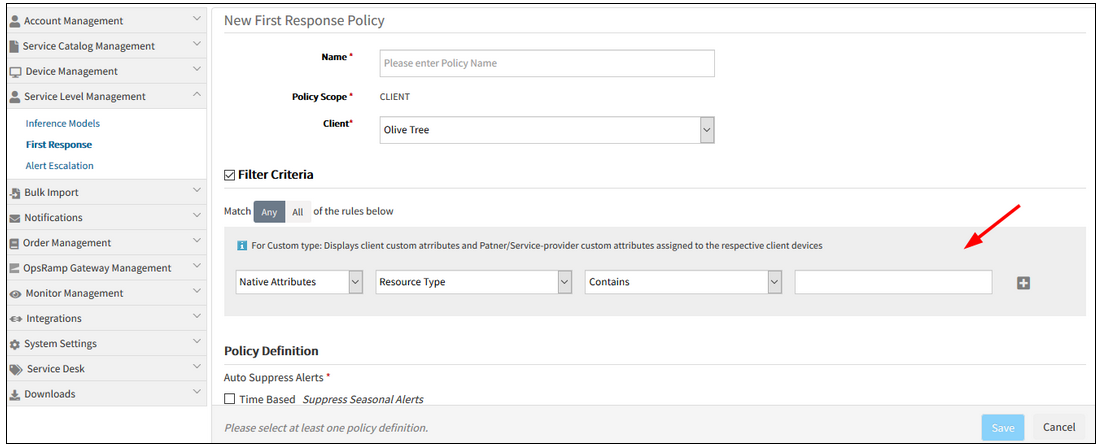
Observed Mode for First Response
Observed mode, added as enhancement to Alert Management, is now available with Alert Escalation policy and First Response policy. With Observed mode applied, the First Response policy creates alerts in Observed mode with OpsRamp recommendation on alert suppression.
All Inferences and alerts created through Observed mode policies have Observed as the current status of alerts. This status simplifies the search and report on Observed mode. You can find all Observed Inferences and alerts with Observed status using Current Status = Observed in the Alert Browser filter.
Topology reinforced alert correlation
The co-occurrence based alert correlation now considers siteName and regionName in correlation. This enhancement groups alerts only if the resources of the alerts belong to the same site or region. For example, if two alerts are considered wherein Alert 1 occurs in Region A and Alert 2 occurs in Region B, the probability of Alert 1 and Alert 2 being correlated, or caused by a similar event is very less. The same reason applies to siteName. By considering siteName and regionName in alert correlation, the accuracy and effectiveness of alert correlation is increased, and provides more effective correlated alerts.
Additionally, the user can customize the correlation result using topology. Users can also decide if correlated alerts have to be all connected. This option works on the user’s input and helps improve the alert correlation accuracy.
Topology reinforced alert correlation
Legacy auto-incident policies disabled
As part of the deprecation plan for legacy auto-incident policies, legacy policies have been disabled and are no longer functional. These policies continue to be available in read-only mode for reference.
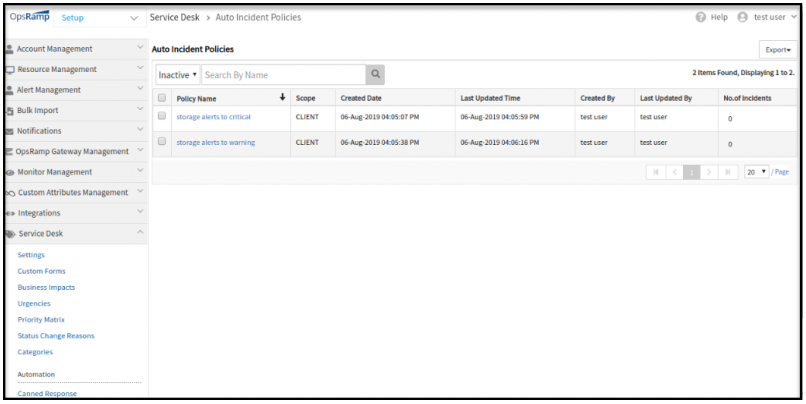
Legacy auto-incident policies disabled
Renamed “Device Management” to “Resource Management”
“Inference Model” to “Alert Correlation” in the menu. And “Alert Correlation Policies” in the List view, and “View Alert Correlation Policy” in the Edit view and “Create Alert Correlation Policy” in the Add view
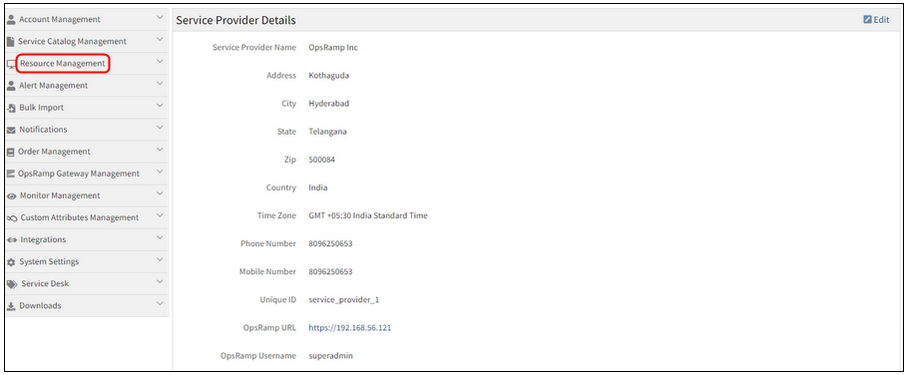
Renamed Device Management to Resource Management
Renamed Device Management to Resource Management.
Inference Model to Alert Correlation in the menu
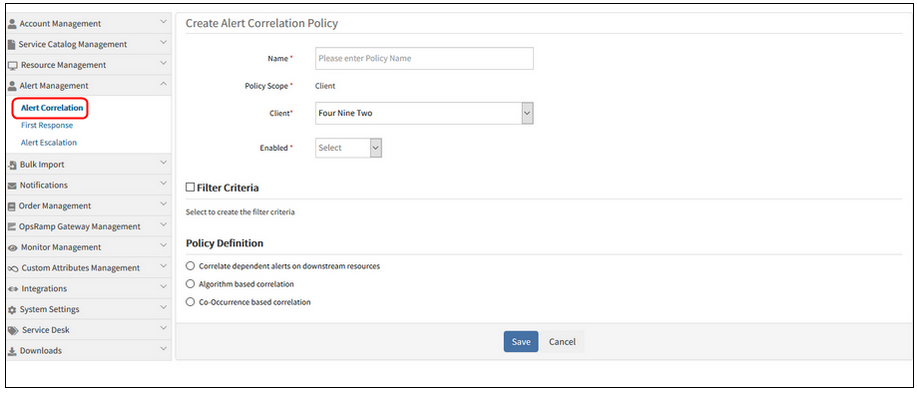
Inference Model to Alert Correlation in the menu
Alert Correlation Policies in the List view
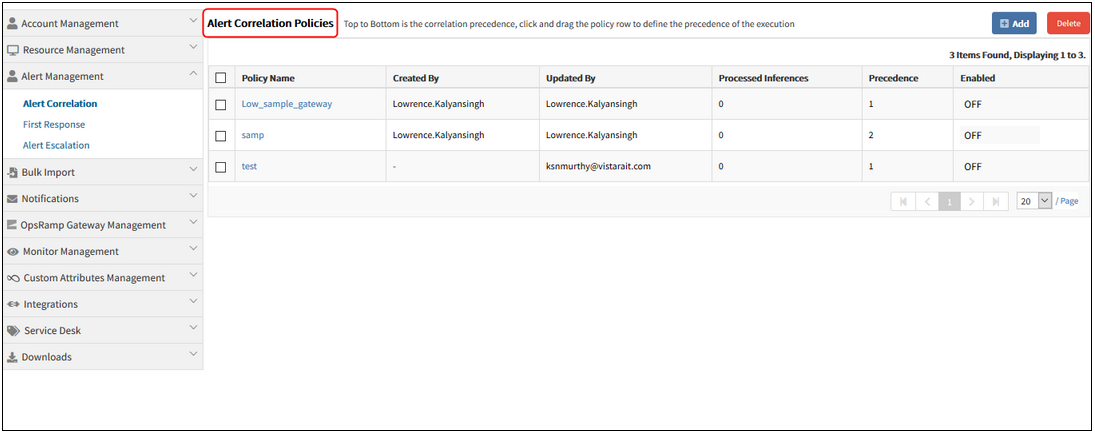
Alert Correlation Policies in the List view
View Alert Correlation Policy in the Edit view
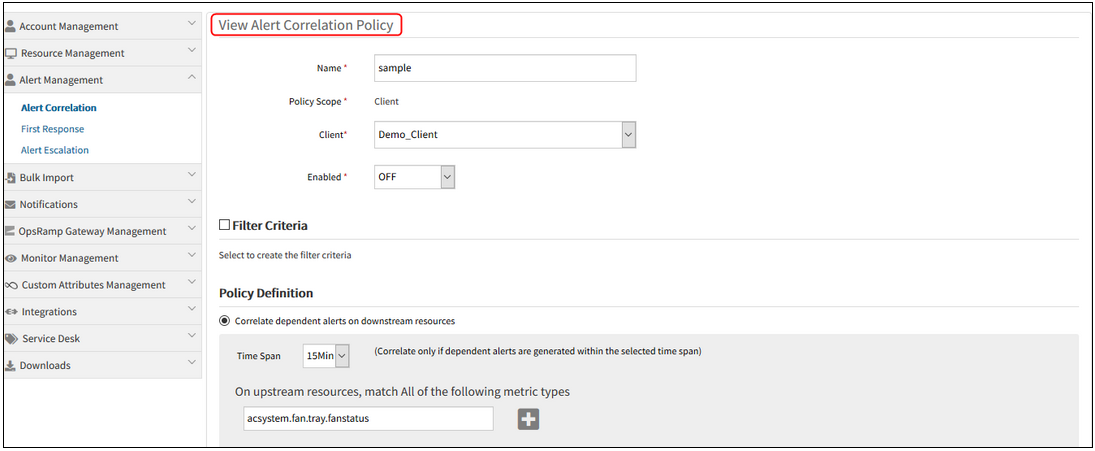
View Alert Correlation Policy in the Edit view
Create Alert Correlation Policy in the Add view
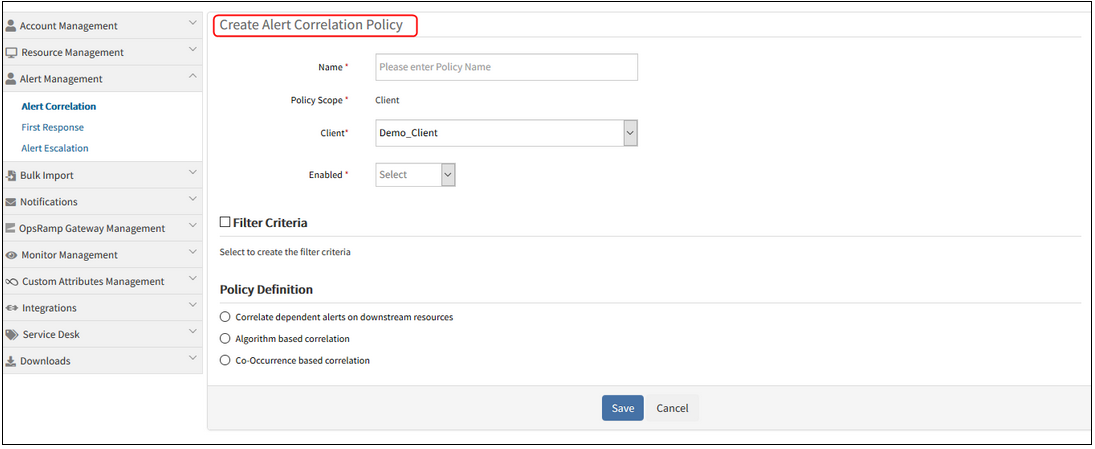
Create Alert Correlation Policy in the Add view
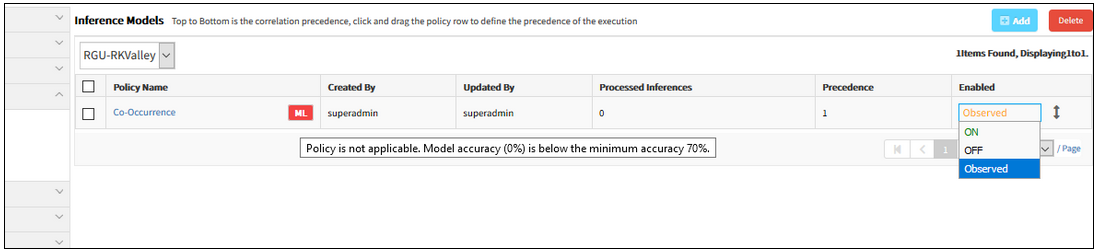
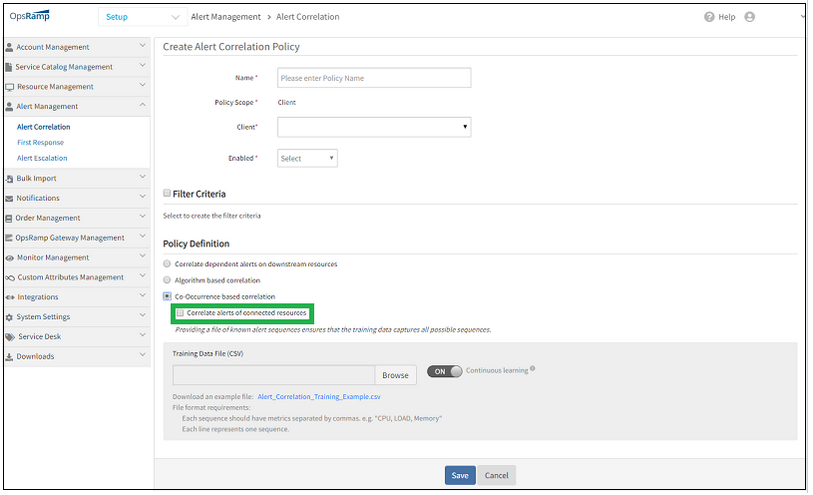
With the ML policy, the user does not have a chance to toggle the policy to Observed mode.
This is because the policy is by default enabled. As soon as the ML policy is created, it is enabled, and the training progress bar occupies Enabled column. The training usually takes hours to run. Therefore, the user does not have the chance to configure “Observed”.
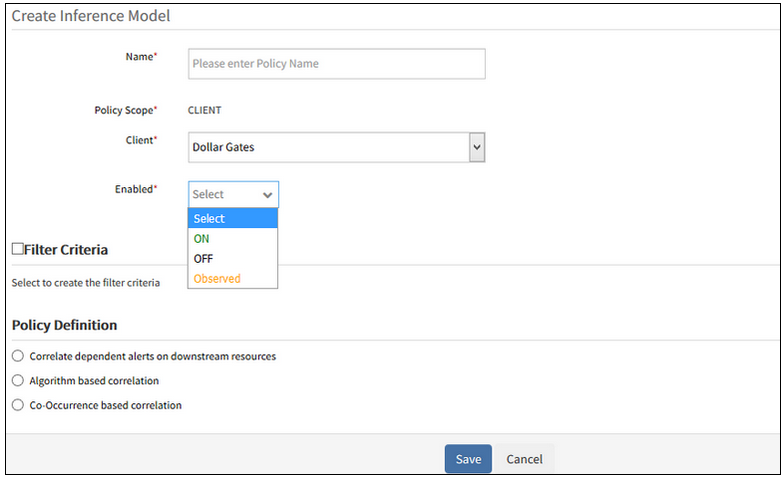
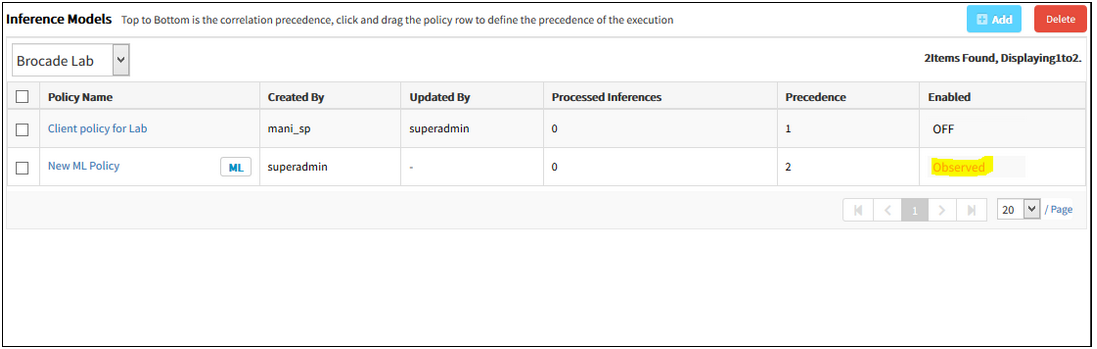
Therefore, “Enabled” option is added in the policy definition. The “Enabled” option is shown when the user is creating a new policy (Inference Model) or is editing the existing policy. The user can view the On, Off, and Observed options while creating an Inference model.
After creating the Co-Occurrence based correlation policy by selecting Enabled option as Observed, and after the training process is completed, it is showing Observed. Similarly, the On and Off options are showing respectively.
After the training process is completed, it is showing Observed
Inference Model policy details:
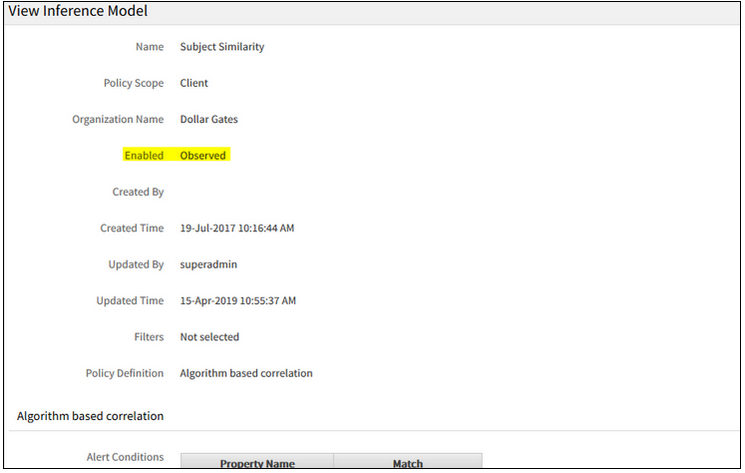
Inference Model policy details
After training, policy in Observed state:
After training, policy in Observed state
Learning based auto alert suppression
Learning based auto alert suppression
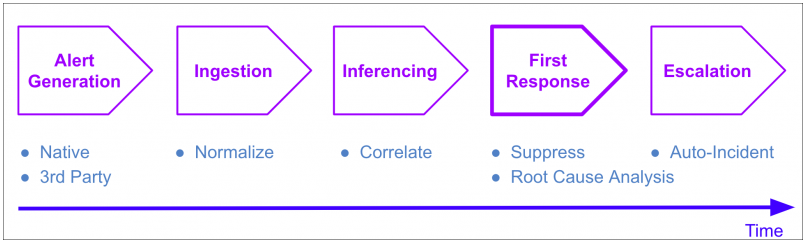
A new option is now available to take automated first response actions on alerts. The new First Response policy runs after Inferences are created, and before Escalation Policies run. With the First Response policy you can automatically suppress known and expected alerts in the environment, and thus reduce alert noise.
Two types of first response actions are available:
Seasonality based auto suppression
This option is suited to auto suppress alerts that that occur in a periodically repeating pattern – for example:
- CPU and memory alerts from a server due to nightly backup jobs.
- Availability alerts from cloud VMs that are automatically shutdown nightly.
OpsRamp automatically learns occurrence patterns of alerts and suppress those that occur in at a predictable cadence. If such an auto suppressed alert should remain open for longer than predicted, OpsRamp will automatically un-suppress the alert – ensuring that real problem conditions that need user attention are not lost.
Seasonality based auto suppressed can be enabled simply by selecting an option within a First Response Policy. Once enabled, OpsRamp will automatically start learning occurrence patterns and taking suppress actions.
Attribute based auto suppression
This option is suited to auto suppress known alerts that are always suppressed as part of a standard operating procedure. For example, alerts due to known and benign warning conditions.
To enable this option, you provide training data (in CSV format) that includes examples of alerts that you want suppressed. Additionally, you can also select the continuous learning option to enable OpsRamp to automatically learn which alerts to auto suppress, based on users’ suppress actions – when OpsRamp is confident that it has learned users’ suppression behavior, it will automatically start suppressing alerts on behalf of users.
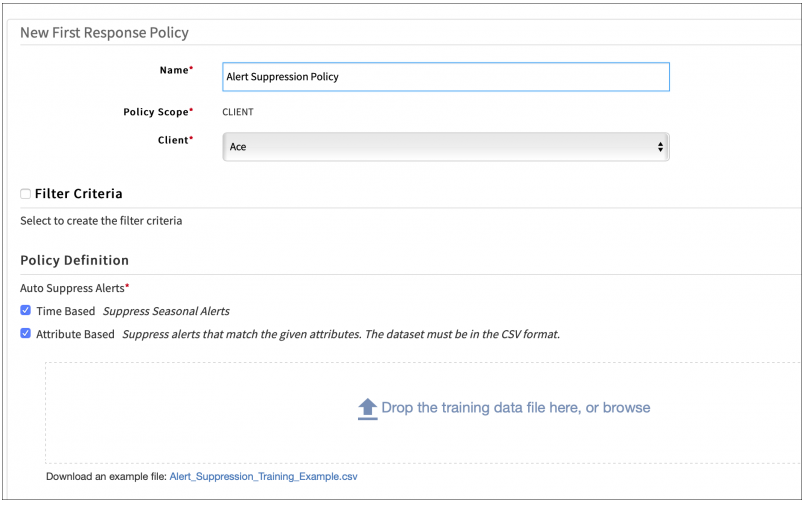
Attribute based auto suppression
Auto suppressed alerts, will have a comment in alert details explaining the reason of suppression.
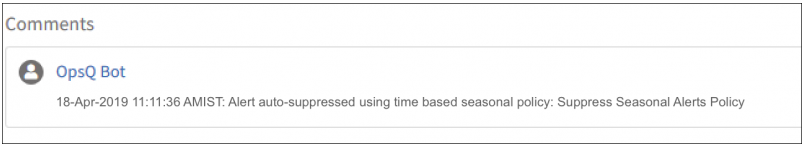
Auto suppressed alerts
Automatic resource creation from third-party events
To better correlate and respond to events ingested from third-party tools, OpsRamp now automatically creates new managed resources upon receiving events from third-party tools via integrations. Resources are created based on uniquely identifiable information such as IP address, hostname, etc. that are inferable from the content of ingested events.
With this feature, resources are automatically created the first time a resource is visible in an external event. These auto-created resources provide valuable service-context that is applied in learning correlation patterns and automated response actions for future events from these resources.
Learning based auto incident at partner scope
Alert escalation policies with use of the learning-based auto incident options can now be defined at partner scope. This allows organizations that use the same incident assignment and prioritization regime across multiple clients to define policies at partner scope, instead at client scope for each client separately.
Continuous learning option for alert escalation policy
Alert escalation policies now support a continuous learning option for auto incident creation. If continuous learning is enabled, OpsRamp continuously re-trains its machine learning models weekly, based on recent alert data. This continuous learning complements user provided training data, via training files – patterns learned from user provided training data and continuous learning are both incorporated into auto incident creation actions.
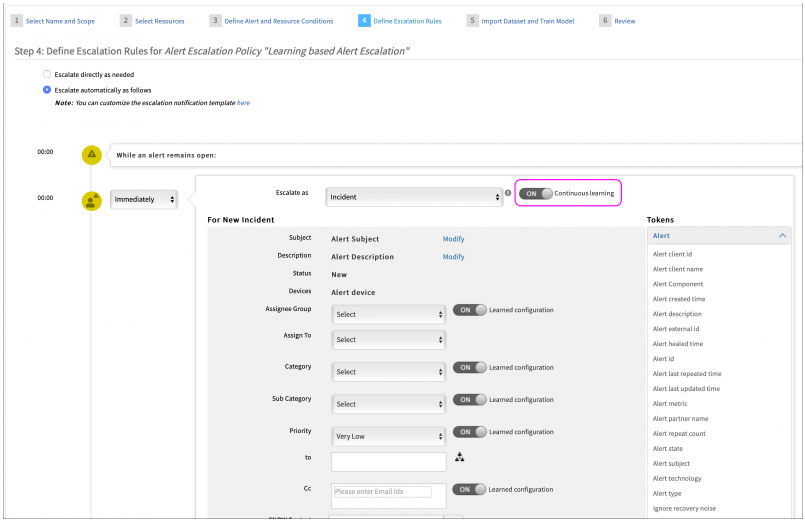
Continuous learning option for alert escalation policy
Inference models that span multiple clients
Inference models can now be defined by partner users on behalf of their clients. These inference models can represent the partner’s recommendations, based on learning from across customer environments. Prior to this release, inference models could only be defined one client at a time and only incorporated learned patterns that are local to the client.
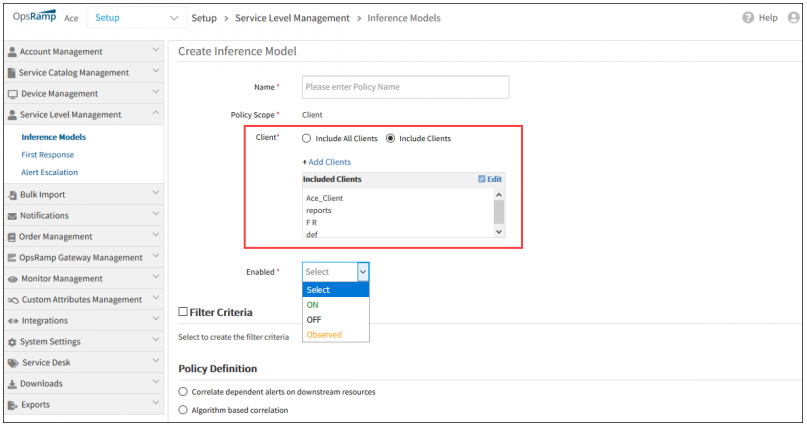
Inference models that span multiple clients
The first alert’s IP address as the IP address of the Inference
Assigning the first alert’s resource IP address to the inference. If the first alert is decorrelated, then the second correlated alert’s IP address will be updated to the inference alert and so on.
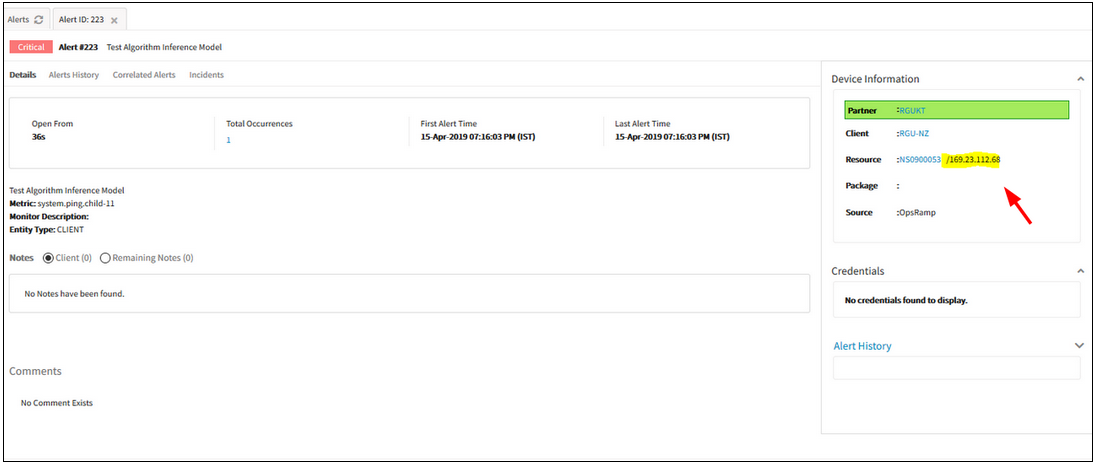
The first alert’s IP address as the IP address of the Inference
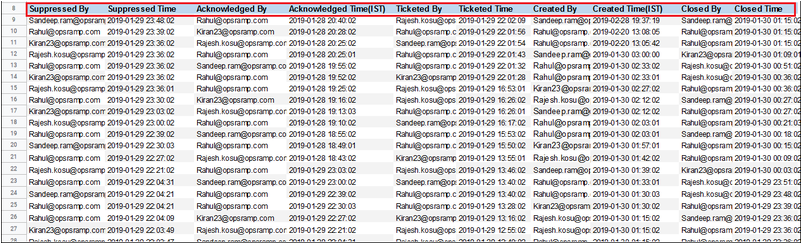
Added all status history fields in both Custom Alert reports as well as Canned Alert reports
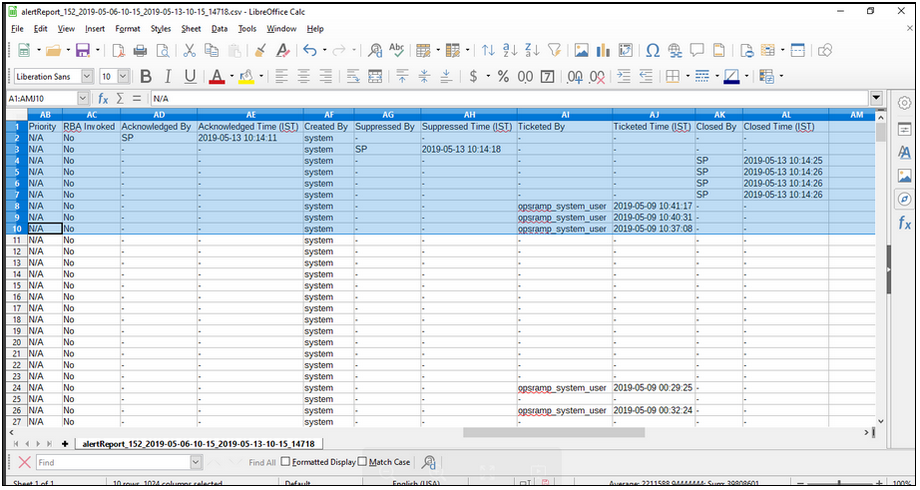
Added all status history fields in both Custom Alert reports as well as Canned Alert reports
Acknowledged By, Acknowledged Time (IST), Created By, Suppressed By, Suppressed Time (IST), Ticketed By, Ticketed Time (IST), Closed By, Closed Time (IST) status history fields are added in both Custom Alert reports as well as Canned Alert reports. Able to view data against the fields.
Resource Management
“Keep Agent installed resources" option is missing in the UI during the process of uninstallation of multiple integrations
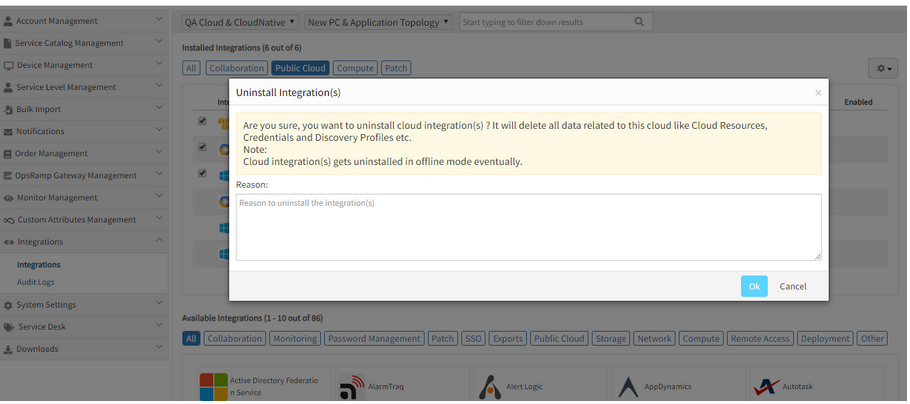
Keep Agent installed resources option is missing in the UI
Issue is fixed. The Keep Agent installed resources option can now be seen in the Uninstall Integration(s) popup dialog box.
The user can check the option to keep all the Agent installed resources, else if the option is not checked, the Agent installed resources will be removed.
Unable to assign devices while creating credential set from Setup
After entering the mandatory fields on the Credentials tab (Credential Details page), and after selecting the device type, no devices are loading in the Available Devices box, on the Assign Devices page, though there are devices available.
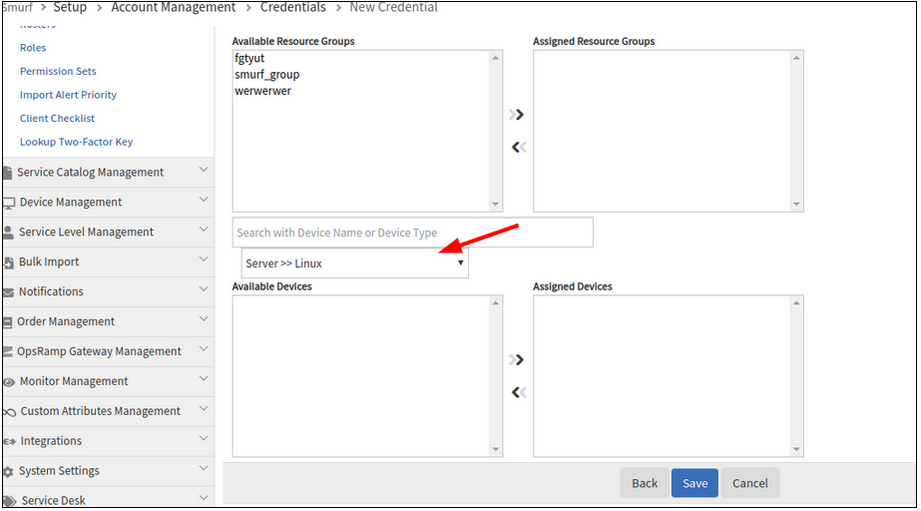
Unable to assign devices while creating credential set from Setup
Issue is fixed.
Devices are loading in the Available Devices box after selecting the device type, on the Assign Devices page.
Creating a blank device group by not adding any resources, either by policy or manually, is showing some random resource counts
Creating a blank device group by not adding any resources
Issue is fixed.
No random numbers are displayed for the resource group. A blank group is created, and the resource count is shown as 0.
Custom Attribute Count is displaying incorrectly for cloud Resources
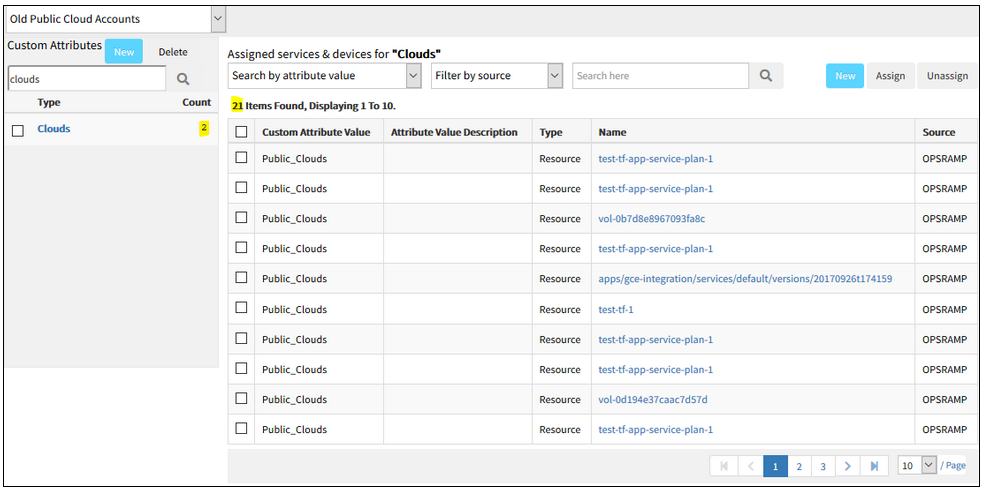
Custom Attribute Count is displaying incorrectly for cloud Resources
Issue is fixed.
The custom attribute count associated with the Category is displaying correctly, for the cloud resources.
Policy log date filter search is displaying incorrect results
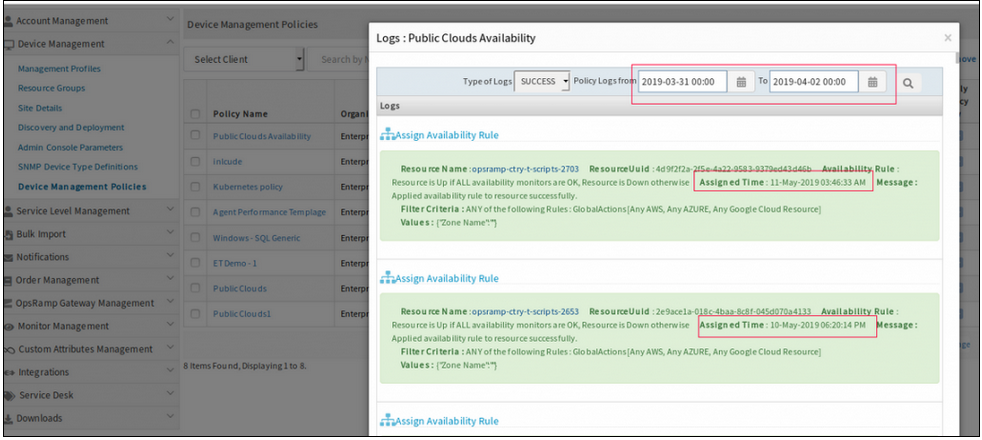
Policy log date filter search is displaying incorrect results
Issue is fixed.
The Device Management policy log date filter search is functioning properly.
Resource Groups are not populating resources with filters
Filters were created via Update Group API. When using “Show Matching Members” the resources populate. However, when saving the group nothing is being displayed in the UI.
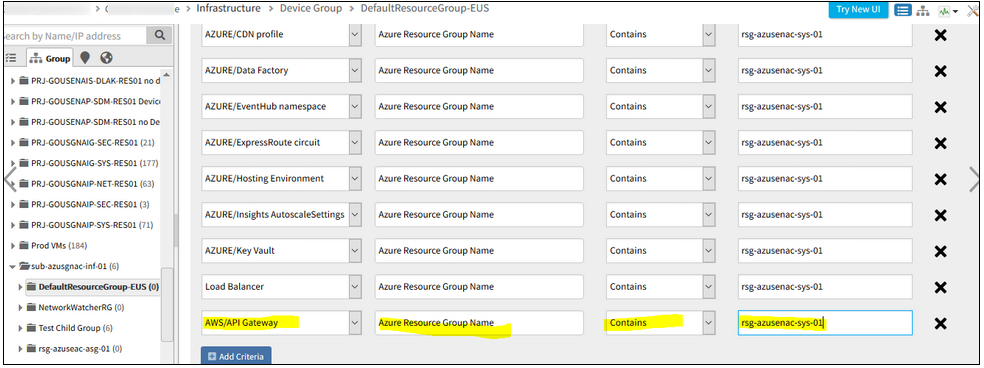
Resource Groups are not populating resources with filters
While adding filter, instead of using AZ_NETWORK_CONECTION, the user keyed in AZ_NETWORK_CONNECTION in one of the filters. As a result, the combination of all the filters did not work, and so the group did not get saved.
Issue is fixed. Now the groups are populating resources with filters.
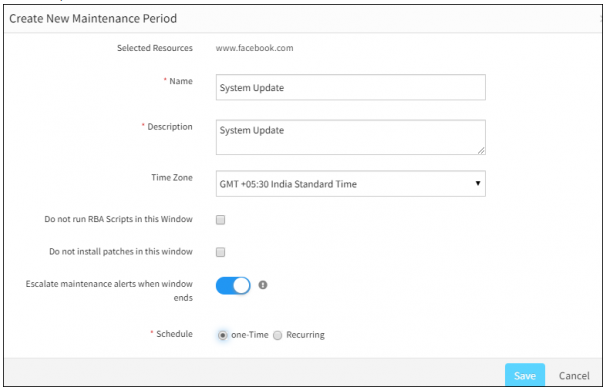
Not able to disable the Escalate maintenance alerts when Window Ends option
User does not want any escalations on Schedule maintenance alerts when the window ends.
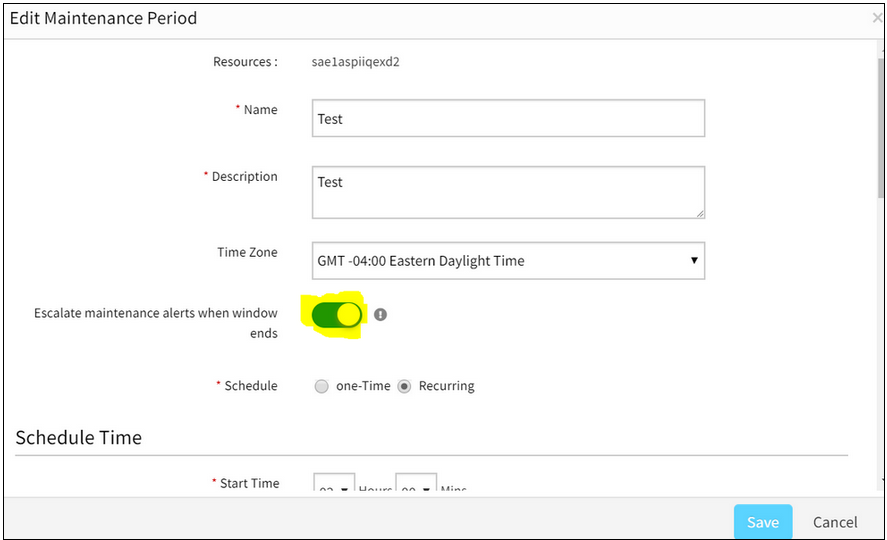
Not able to disable the Escalate maintenance alerts when Window Ends option
Issue is fixed.
Now the user can disable the option, so that there are no escalations on Schedule maintenance alerts when the window ends.
Synthetic resource UI is made the same as other resources
Attributes tab is added for Synthetics.
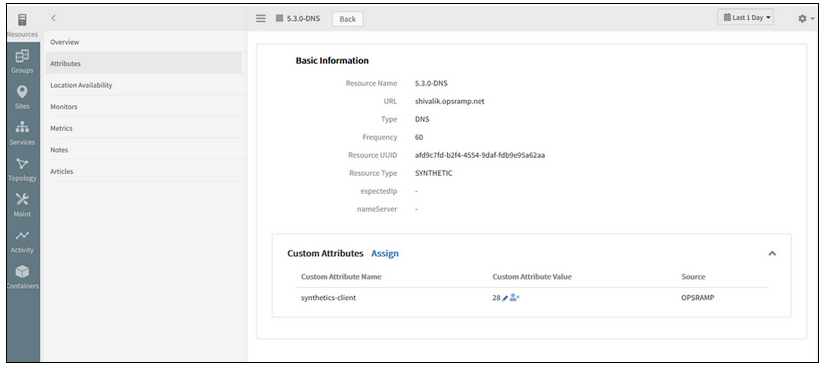
Attributes tab is added for Synthetics
Ability to search for resources in the New Infrastructure page using Custom Attributes
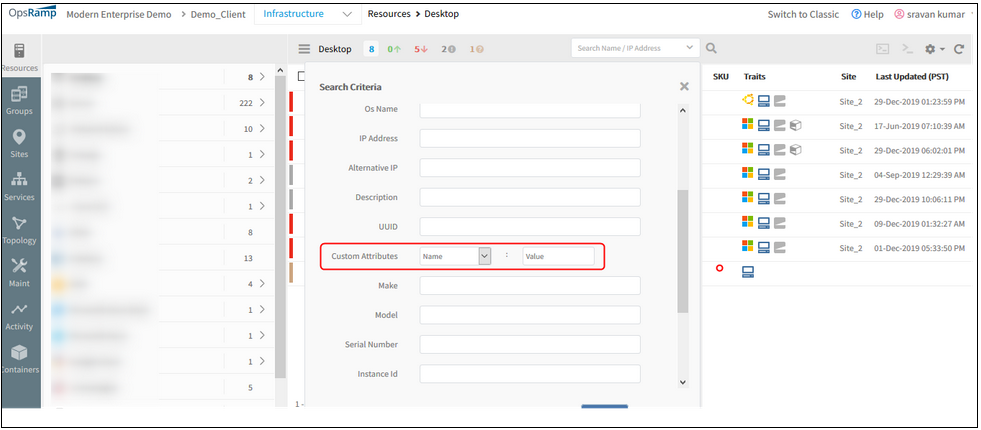
Ability to Search for resources in the New Infrastructure page using Custom Attributes
Now the user will be able to search and filter a resource (or a set of resources) using custom attribute value, in the New infrastructure page, in Advance Search criteria.
The users can search for resources with custom attributes along with Name and IP address.
Ability to easily Un-assign custom attribute values from a specific resource
The user should be able to perform the Unassign custom attribute values from the Infrastructure Attributes page.
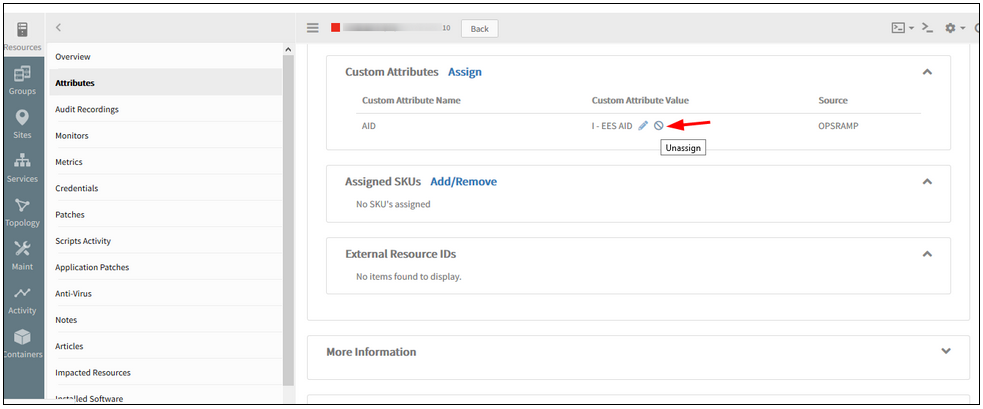
Ability to easily Un-assign custom attribute values from a specific resource
The user will be able to Assign and Unassign Custom attribute values from the Device details page (Infrastructure -> Attributes page).
The user can no longer create custom attributes from the resource details page.
Network Automation
WLAN controllers are in the Discovered state, but unable to see them in the Infrastructure listing page
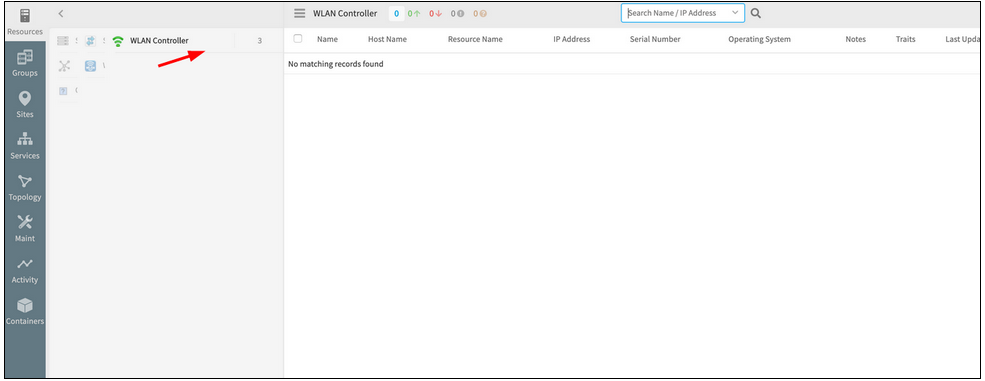
WLAN controllers are in the Discovered state, but unable to see them
Issue is fixed. The 3 WLAN controllers, which have been discovered, are listed in the Infrastructure page of the New UI.
Monitoring Management
Missing F5 Load Balancer links in Keyline topology compared to Classic topology
F5 Load Balancer topology has 2 links connected to each device in Classic topology but in Keyline there is a single link connected to each device.
F5 Load Balancer links are missing in Keyline topology
Issue is fixed. Getting two links for each device from the parent device.
Not able to change Gateway profile for Discovery
There are 3 ESX hosts integrations installed.
Another profile was selected, as the profile with which the devices were previously discovered became inactive (Profiles become inactive and will not be displayed in the profile list dropdown, if the Gateway is down). An error message was displayed when another profile was selected.
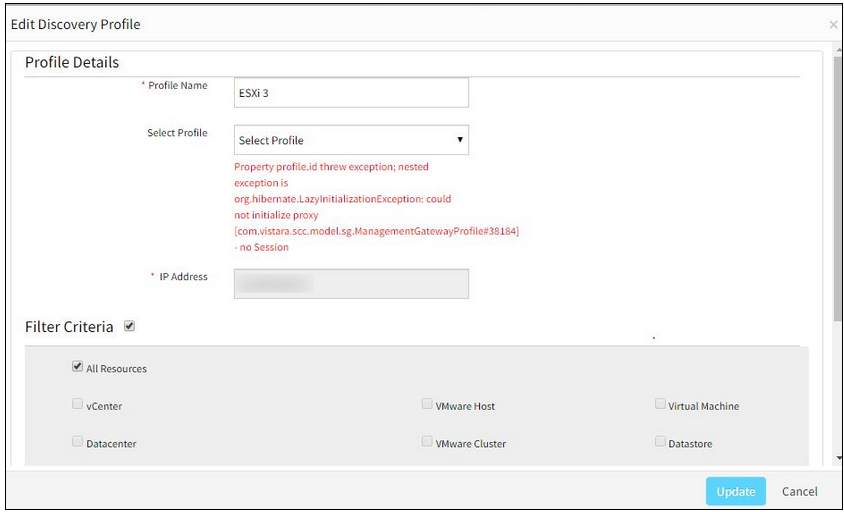
Not able to change Gateway profile for Discovery
Issue is fixed. Now able to change Gateway profiles successfully.
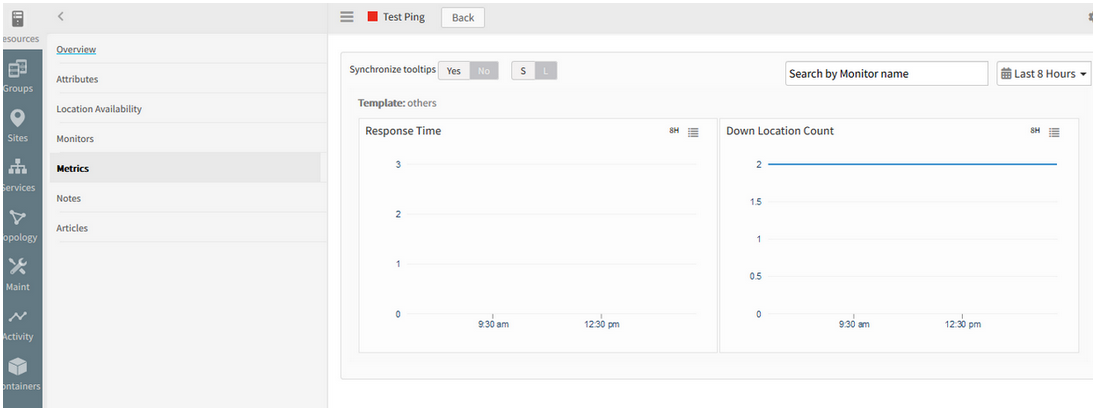
Metric data on graphs is missing
Graph data are not showing before June 6th.
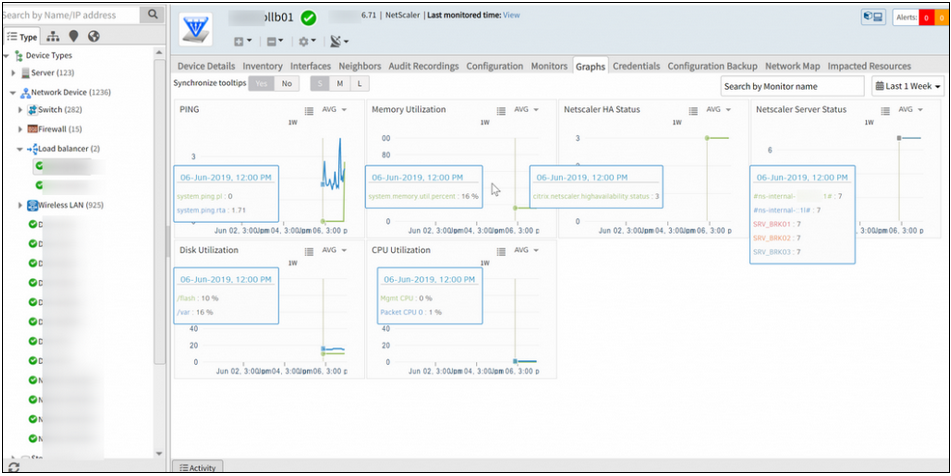
Metric data on graphs is missing
Issue is fixed.
The graph data (before 6 June) is displayed perfectly.
Receiving vmware.auth.error alerts continuously
User changed the credentials, and those credentials are not sent to the Gateway. As the templates are not pushed to the Gateway, the Gateway queries the target device with the old credentials. Hence, the authorization exceptions/alerts are received.
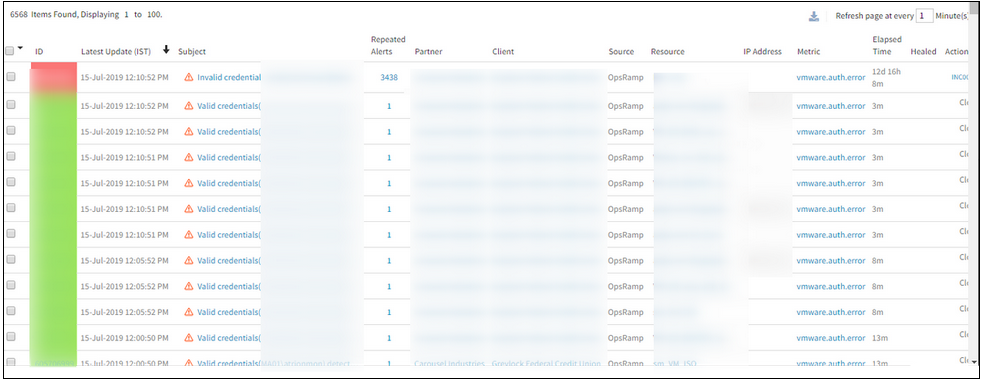
Receiving vmware.auth.error alerts continuously
Issue is fixed. Templates are re-pushed and now there are no auth alerts being triggered.
Improved visualization of topology maps
Topology maps now have improved visualization that makes it easy to see and navigate large scale topologies.
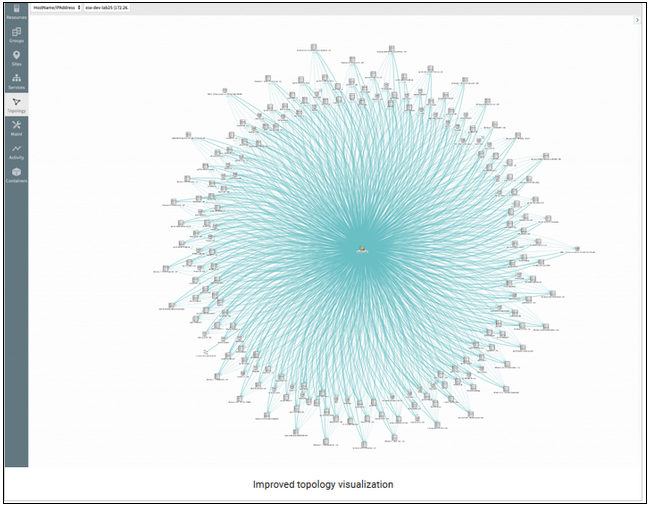
Improved visualization of topology maps
Integrations
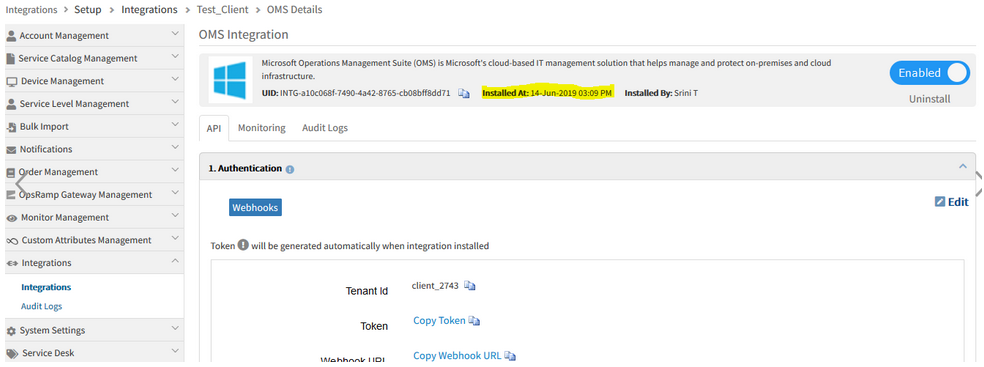
Installed Time shown in the new integration details page is not matching with actual individual application details page
Date and time Format are also different in both the pages.
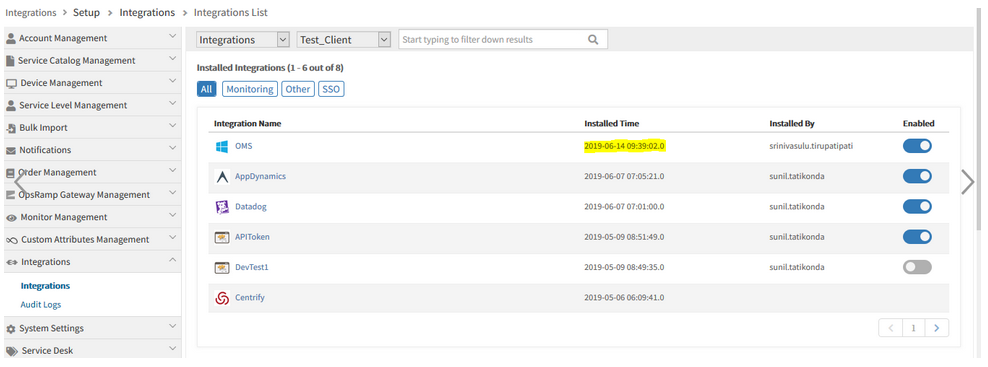
Installed Time shown in the new integration details page is not matching
Date and time Format are also different in both the pages
Issue is fixed. Installed date and time format are showing correctly in the new integration details page and the individual application details page.
Installed time is showing correctly in both the pages.
Missing Integration option in Collector Type dropdown in Advanced Search on the Templates listing page
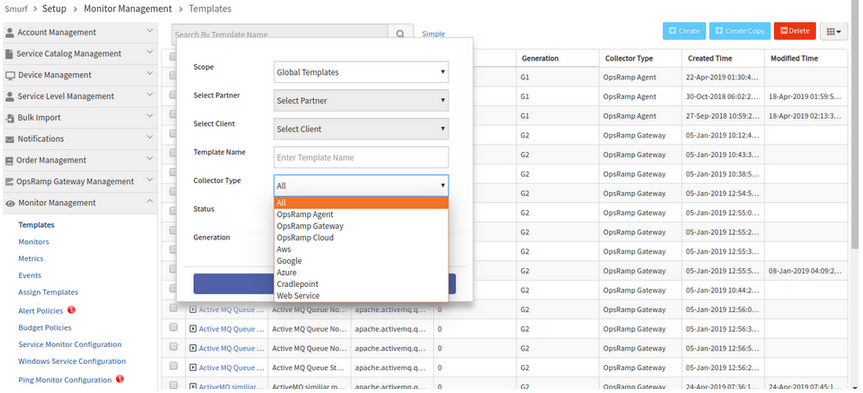
Missing Integration option in Collector Type dropdown
Issue is fixed.
Integration option is available in the Collector Type dropdown in the Advanced Search popup on the Templates listing page.
Integration with Palo Alto Networks Prisma
Palo Alto Networks Prisma Public Cloud (formerly known as Redlock) is now available as Monitoring Integration. Users can ingest cloud vulnerability events, such as OpsRamp alerts by Webhook configuration on the integration.
Uninstall compute and cloud on user affirmation
While uninstalling an Integration, the Reason field was not mandatory. The field is now kept mandatory.
So, the customers can understand why an integration was uninstalled.
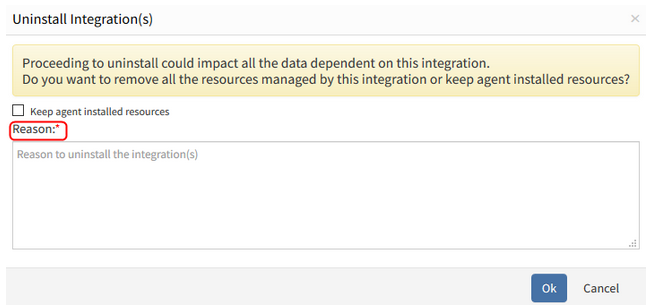
Uninstall compute and cloud on user affirmation
The field is mandatory, in UI and API.
Provided search functionality for installed and available integrations in UI
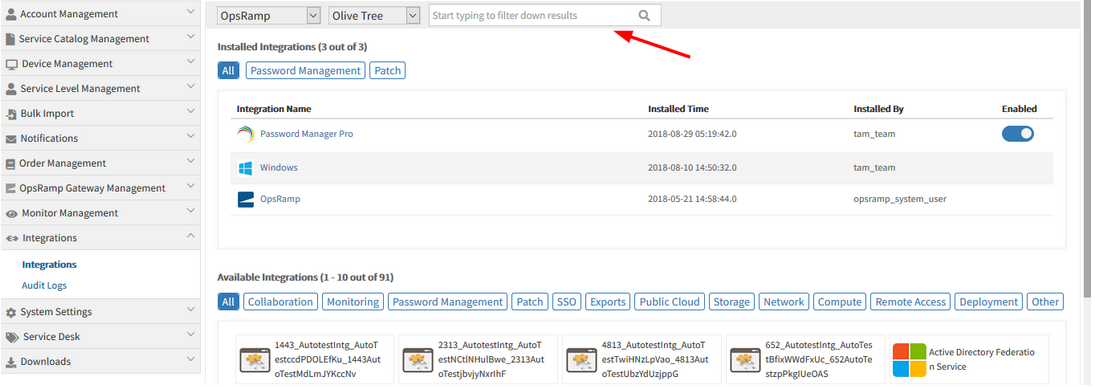
Provided search functionality for installed and available integrations in UI
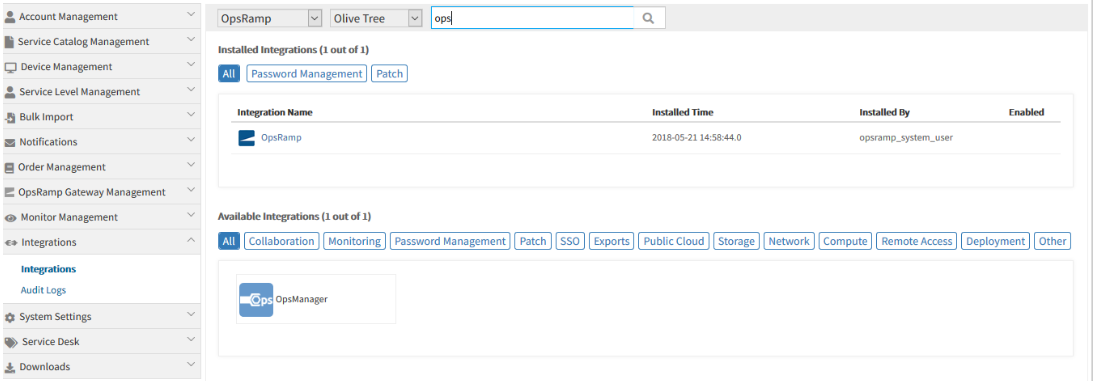
Provided search functionality for installed and available integrations in UI
The search results appear in both the Available as well as Installed Integrations.
The Gear icon is provided instead of Uninstall button, to uninstall an App. This feature is currently available for Installed Integrations.
Once the user selects an App, the Gear icon is enabled, so that the user can select the Uninstall option to uninstall the App.
By clicking on the row, the Apps can be selected.
Gear icon is provided to uninstall an App
External Resource ID is displayed in the details page of devices
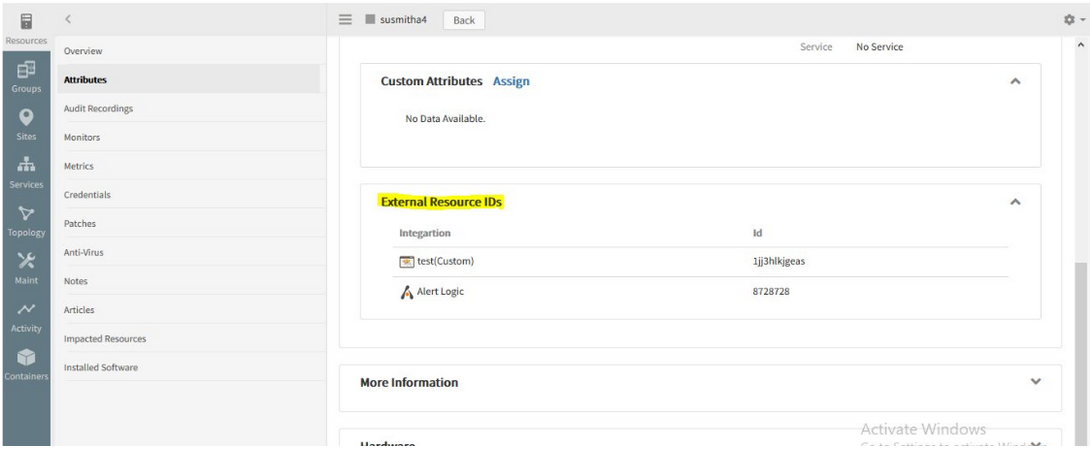
External Resource ID is displayed in the details page of devices
The External Resource ID details can now be viewed in the Device details -> Attributes page.
Monitoring of integration failures
OpsRamp now automatically monitors the health of event and ticket integrations – monitor failures in outbound API calls, statistics about inbound events, etc. User needs to create template using the new integration monitoring metrics and assign as shown below.
Metrics for Integration errors monitoring:
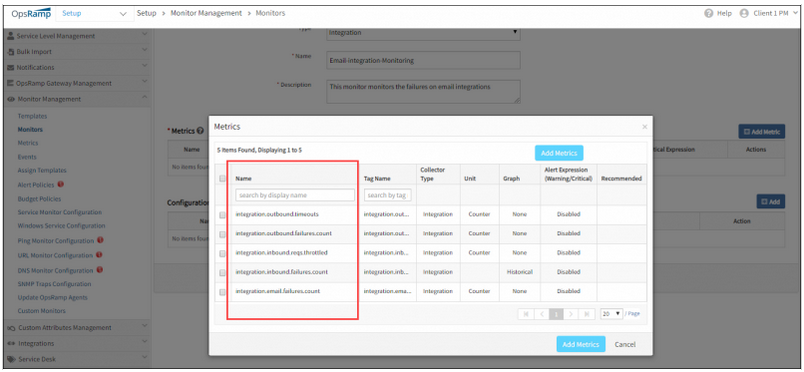
Metrics for Integration errors monitoring
Monitoring installed integrations:
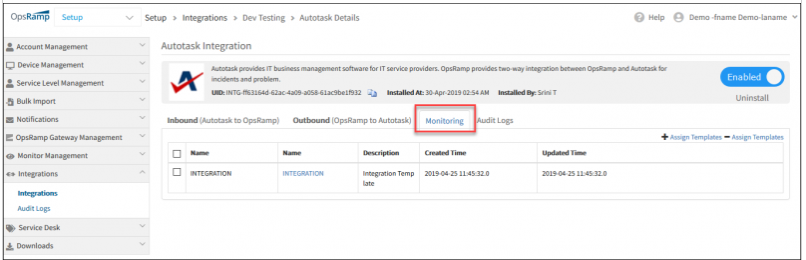
Monitoring installed integrations
Apply monitoring templates to integrations:
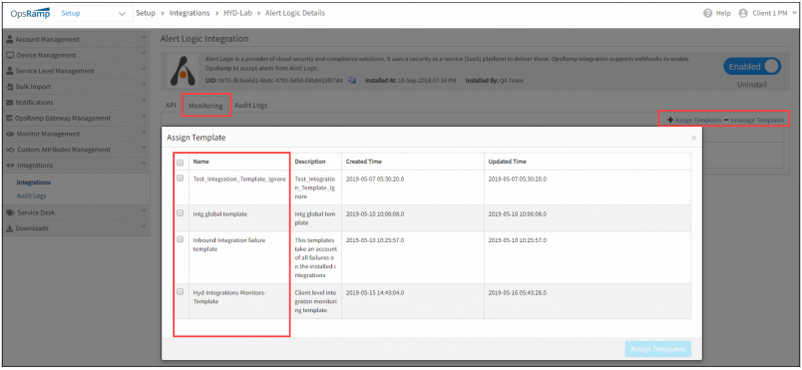
Apply monitoring templates to integrations
Alerts on integrations:
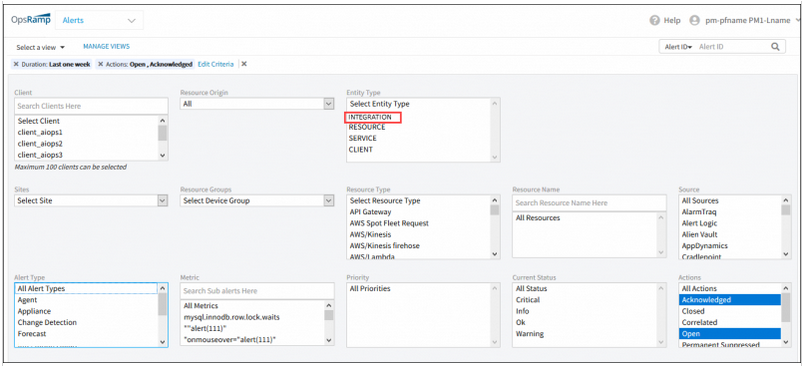
Alerts on integrations
Cloud Monitoring & Cloud Native Environments
Some monitoring graphs for the AWS based EC2 instance are not getting updated
Status check graphs are not getting updated. At the same time, EC2 groupings are not working. Alerts are not generated when the instance is down. The tagging was done properly on the console, but not getting reflected in the portal, so EC2 instance had to be added manually.
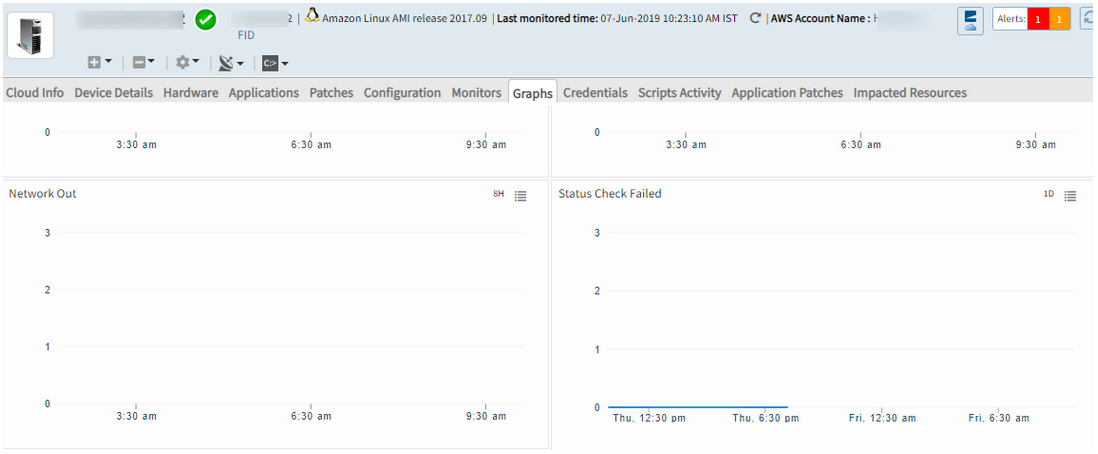
Graphs for the AWS based EC2 instance are not getting updated
Issue is fixed. The monitoring graphs for the AWS based EC2 instance are showing perfectly.
Unable to discover Meraki devices using API access key
When the user logs in to the Meraki portal, able to see multiple devices. However, when discovery is done in OpsRamp it was successful, but only one device is being discovered to OpsRamp.
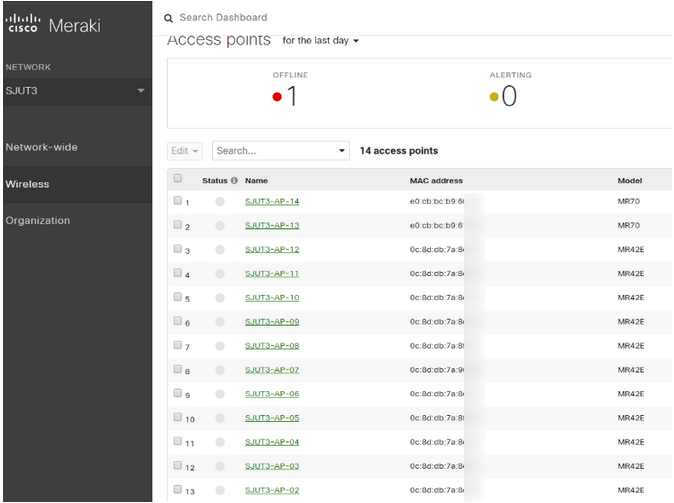
Unable to discover Meraki devices using API access key
Issue is fixed. Discovery shows all the devices being discovered.
Azure Stack resources are not displayed in the UI
Only Virtual Machines are displayed with wrong count in the left panel.
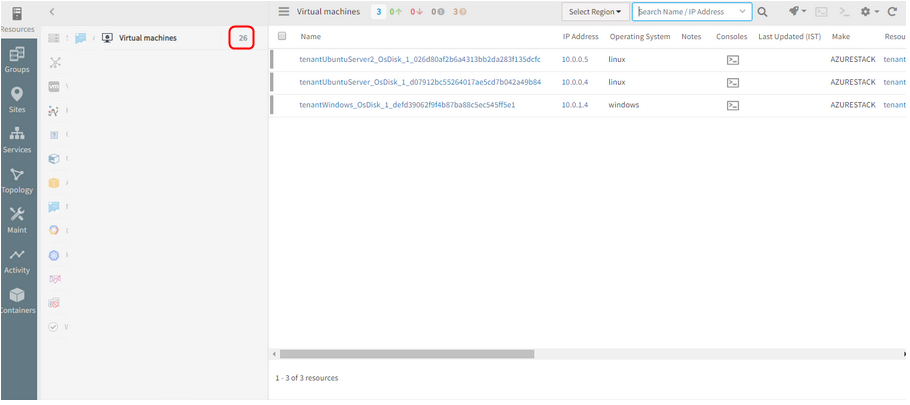
Azure Stack resources are not displayed in the UI
Issue is fixed. The Azure Stack resources are displayed. Virtual machines count is displayed properly.
AWS instances search is yielding inaccurate results
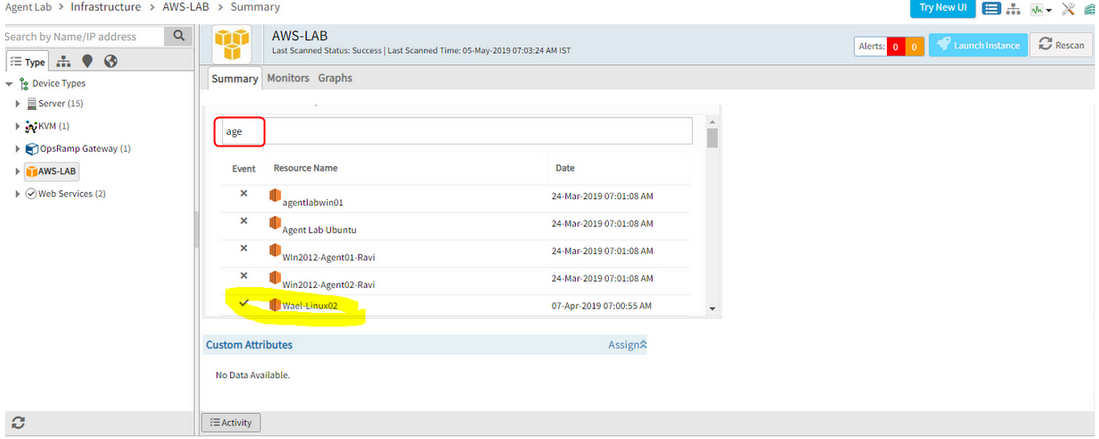
AWS instances search is yielding inaccurate results
Issue is fixed. The Cloud resources search is showing results perfectly.
Messages are getting stuck in SQS queue
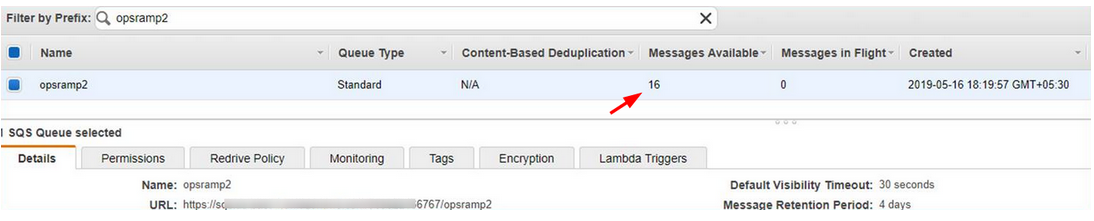
Messages are getting stuck in SQS queue
AWS Events streaming is not working for AWS Assume role integrations. Security token is not getting updated automatically. After configuration of AWS events the token is getting expired after a while, and the events are not getting processed.
Issue is fixed. The security token is getting refreshed continuously.
Tags are not being picked up by Resource Group
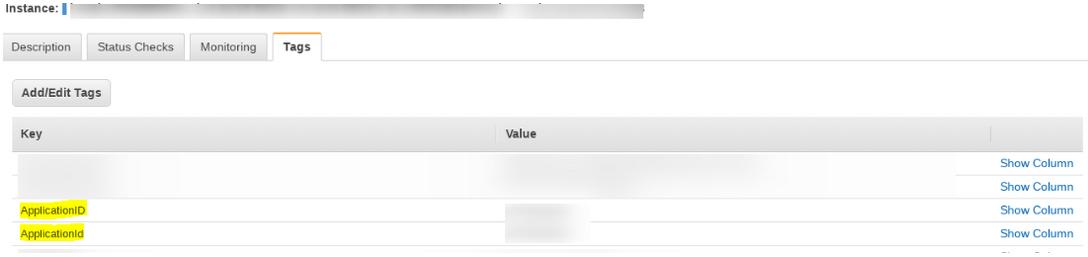
Tags are not being picked up by Resource Group
Getting MYSQL constraint violation/duplicate record exceptions while saving tags into the system. This is due to the duplicate tags maintained in the AWS cloud side.
For now, the duplicate tags are ignored and only one entry is being saved.
Issue is partly fixed. Allowing tags with two or more different cases is being worked upon and will be fixed in the upcoming releases.
AWS discovery for specific Regions
The ability to select a region in AWS provides increased flexibility in the decision-making process to finalize where to deploy a given service according to various compliance, regulatory, and performance concerns. This same flexibility is now available in OpsRamp. Now, users of OpsRamp can select the region(s) to on-board, with the default setting configured to select All.
Note: This affects the existing Integrations API when adding an AWS account into the OpsRamp portal. Users will need to specify the region in which they intend to add into the OpsRamp portal.
Support for AWS Landing Zones
AWS Landing Zone is a solution that helps customers quickly set up a secure, multi-account AWS environment based on AWS best practices. With the large number of design choices, setting up a multi-account environment can be time consuming. AWS Landing Zones can help save time by automating the set-up of an environment for running secure and scalable workloads while implementing an initial security baseline through the creation of core accounts and resources. AWS Landing Zone deploys an AWS Account Vending Machine (AVM) product to help with provisioning and automatically configuring new accounts.
With OpsRamp, users automatically on-board accounts under the master (payer account) in AWS Landing Zones. This enhancement allows for increased insight into the various child accounts without having to on-board each account individually.
Discovery of other types of Load Balancers in Google
Load Balancing is an essential component when providing a scalable, high performance/high availability service to your users. To support this, OpsRamp is expanding its Load Balancing protocols within the Google Cloud Platform to include:
- TCP
- UDP
- SSL (Proxy)
- TCP (Proxy)
Graphs have gaps, and there were no alerts/incidents created for the same
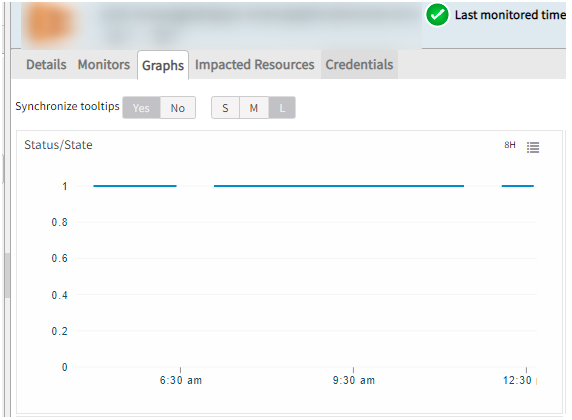
Graphs have gaps, and there were no alerts/incidents created for the same
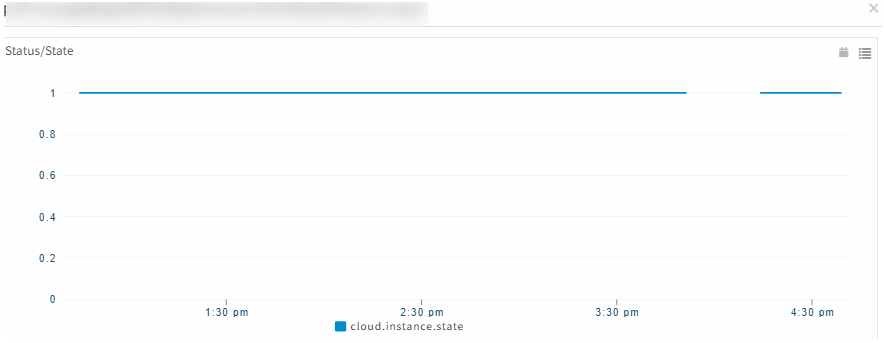
Graphs have gaps, and there were no alerts/incidents created for the same
There were some stale job entries that were created due to which there was heavy load on the scheduler node. Once the load was distributed and stale jobs were removed, the scheduler node is fine, and graphs started populating well.
There was a very similar issue for which logs were enabled, which required scheduler restart. During scheduler restart usually all the jobs are re-scheduled which takes up considerable amount of time, around 30 minutes.
During this time the Status/State graph data is not pulled, that is the reason for the gap.
Typeahead search support provided in the Topology search page (Hostname and IP address)
As the user types in the search field (2 or more characters), one or more matches for the search item (s) are found and immediately presented to the user.
Typeahead search support provided in the Topology search page
Provided Typeahead search support for Hostname and IP address in the Topology search page, in order to make the Topology explorer user friendly.
Mesosphere Discovery and Monitoring
OpsRamp can now discover and monitor a Mesosphere based cloud-native environment.
Azure Stack Discovery and Monitoring
OpsRamp can now discover Network connections, Virtual networks and Load balancers in Azure stack environment.

Discover Network connections, Virtual networks and Load balancers in Azure stack environment
Web Services Monitoring
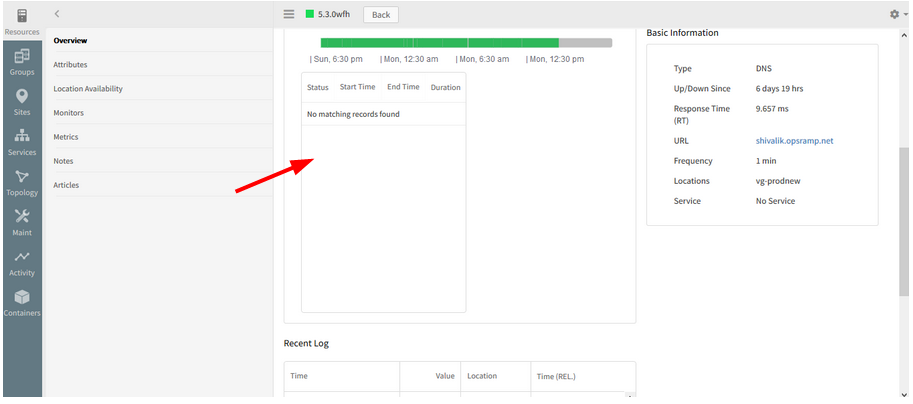
The Location wise availability log is not showing the newly added location for the synthetic
The Recent Log and the Response time graph are displaying properly.
Not showing the newly added location for the synthetic
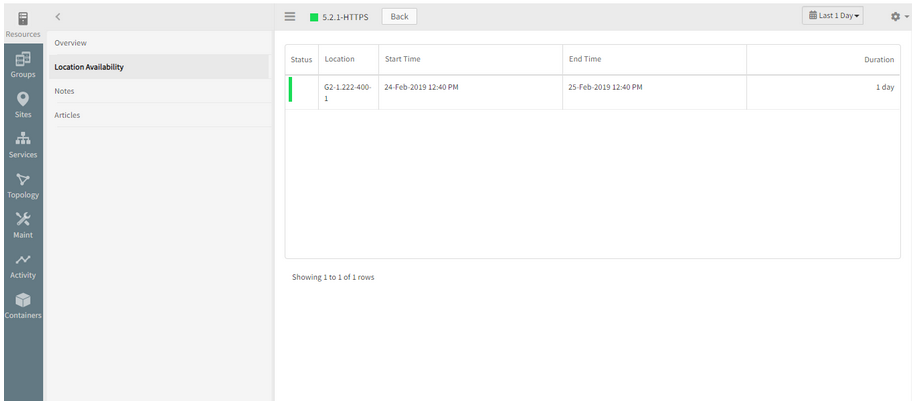
Not showing the newly added location for the synthetic
Issue is fixed. Location wise availability log is showing the newly added location.
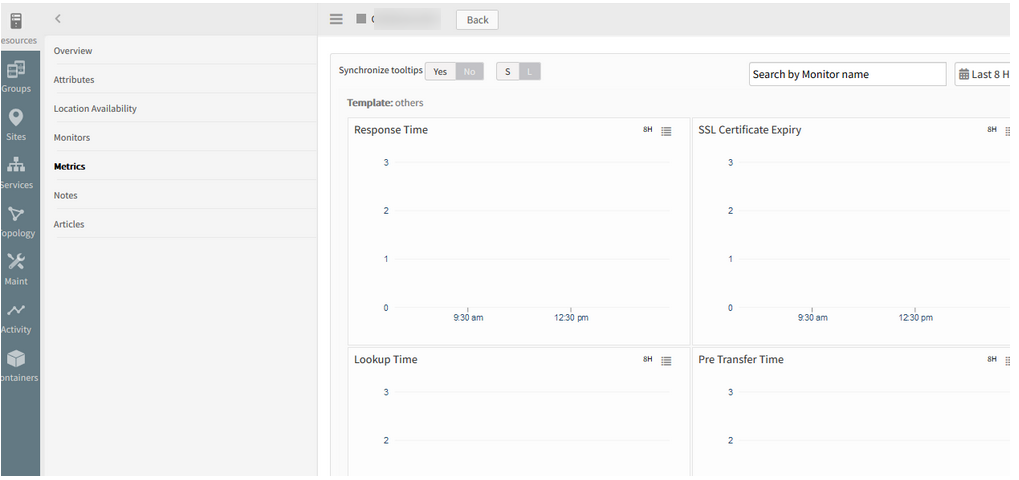
In HTTP/HTTPS type WSM’s, all the Metric Types (e.g., response time, lookup time, connect time, etc.) are clubbed into single graph
There should be separate graph for each metric type
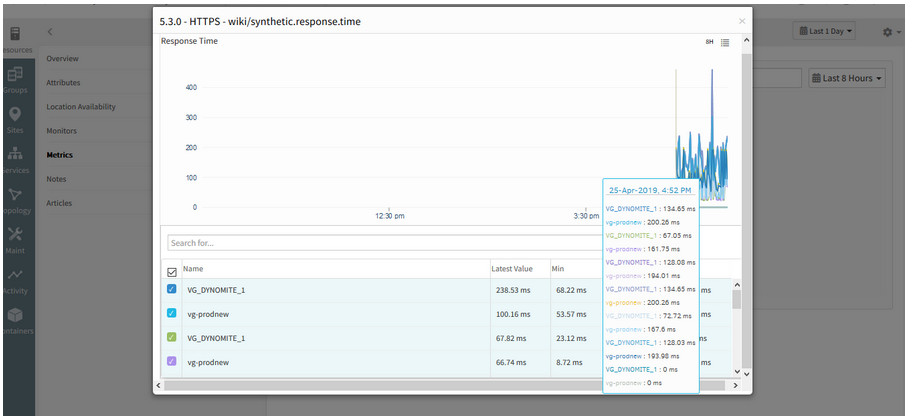
All the Metric Types are clubbed into single graph
Issue is fixed. The graphs are displayed separately (individual graphs for individual metrics).
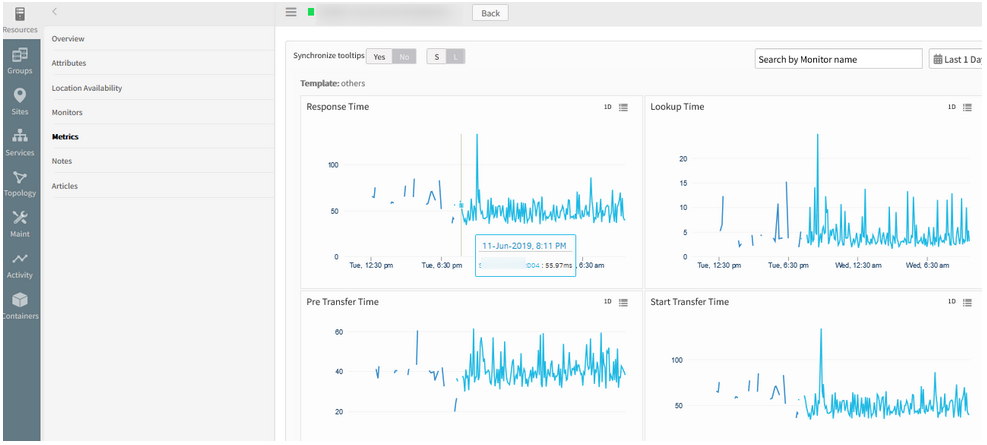
The operator in component level thresholds is showing “<=” instead of “>=” for response time metrics.
After 5.3.0 migration of Web Services Monitoring (WSM) resources, the operator in component level thresholds is showing “<=” instead of “>=” for response time metrics.
This will trigger false alert generations.
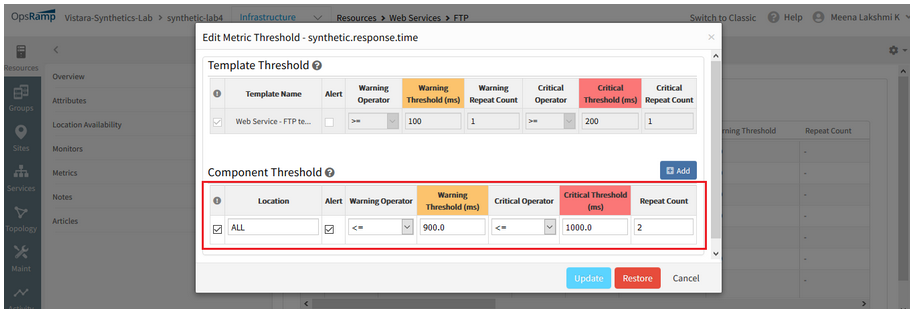
Operator in component level thresholds is showing '<=' instead of '>='
Issue is fixed. The operators (warning and critical) are showing correctly, (i.e., “>=”) for response time metrics, as defined in the Alert policy.
The availability of the Synthetic is showing DOWN, but the availability bar is showing it as UP
The availability bar and the availability of the Synthetic should be the same.
Availability of the Synthetic is showing DOWN, but the availability bar is showing it as UP
Issue is fixed. The Availability is displayed correctly.
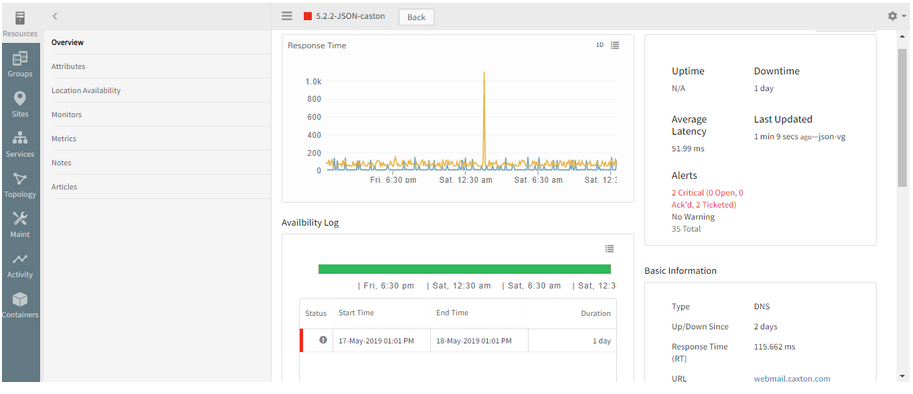
There are about 167 web services. No alerts are received. It is not showing the status as Down
Test ping check first showed Green.
It is not showing the status as Down
Need to enable alert on “availability.down.locations.count” metric. Only then alert is received if it reaches thresholds and goes to Down as it is marked as availability metric. Otherwise, it will turn to Unknown if the data points are not generated till certain time.
The device is showing as Unknown as there is no alert definition configured against the availability metric.
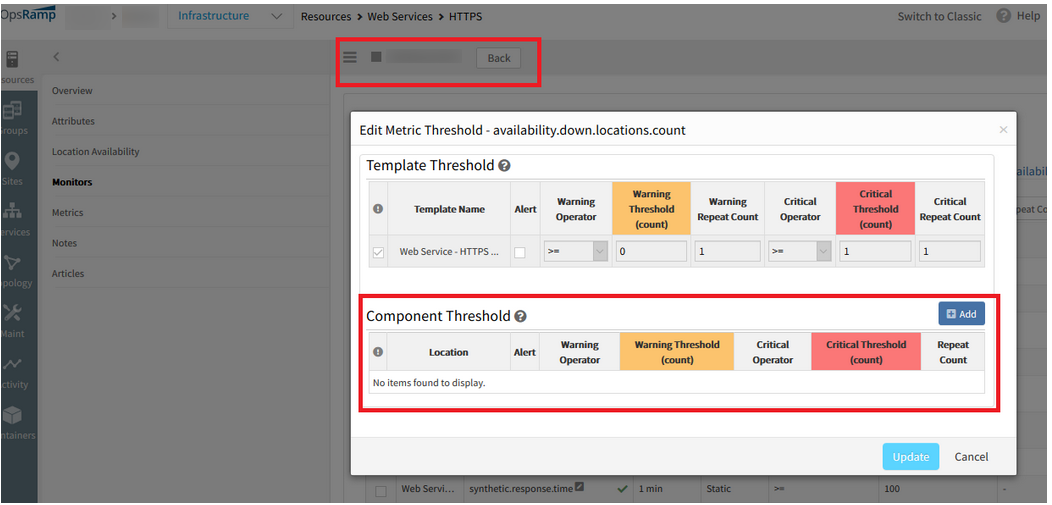
Device is showing as Unknown
Device is showing as Unknown
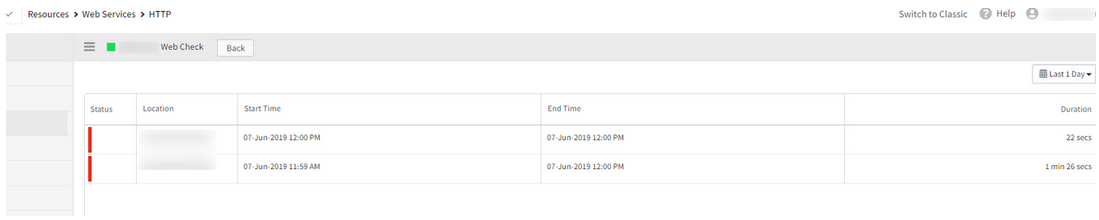
As the critical threshold is reached, the count is showing 2 in the graph, and the device is showing as Down.
Test Ping is Down because there is a critical alert on the availability metric.
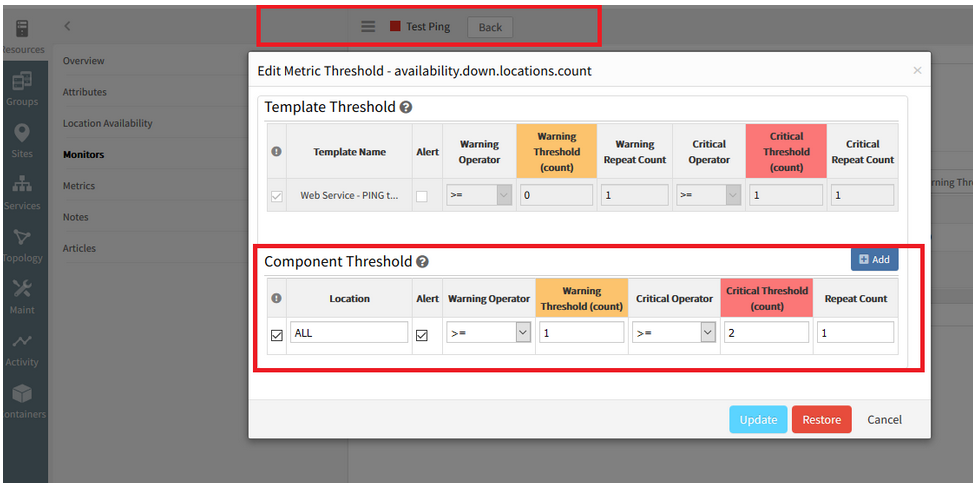
Device is showing as Down
Count is showing as 2 in the graph, and the device is showing as Down
Also, the graphs are not plotting continuously.
Graphs are not plotting continuously
Issue is fixed. After restarting the web probe service on the Gateway, graphs are plotting continuously.
Monitoring templates
You can now monitor synthetics using monitoring templates, just like you can monitor other types of managed resource. Prior to this release, monitoring configuration for a synthetic had to be configured separately for each synthetic. With monitoring templates, you change monitoring settings, such as alert thresholds, across multiple synthetics simply by changing the monitoring template.
As a result of these changes, pause and resume actions are no longer available for a synthetic. Instead, you can assign or unassign the template for the same effect.
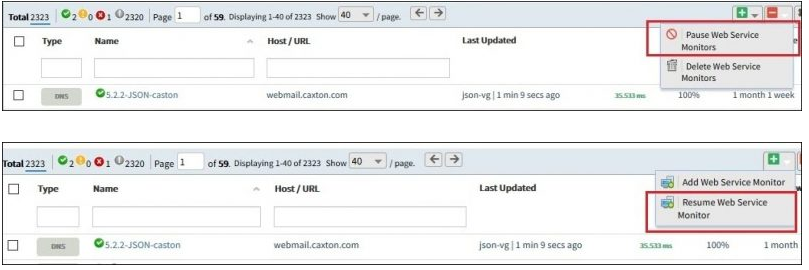
Pause and resume actions are no longer available for a synthetic
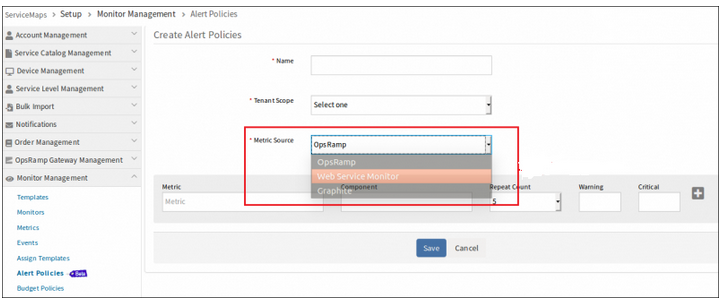
Alert Policy
Alert Policy will be removed from Add Web Service Monitor page and also from Monitor Management page. Now Alert option is added in template section and user can modify or customize at template level or Synthetic Resource level like common template model.
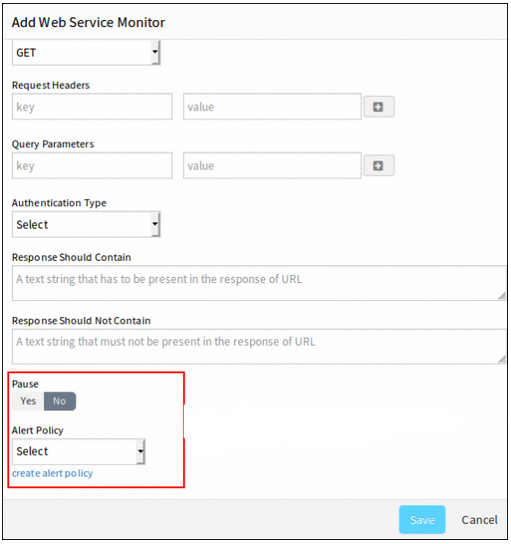
Alert option is added in template section
Alert Policy will be removed from Add Web Service Monitor page and also from Monitor Management page
Scheduled maintenance
You can now put a web service resource into scheduled maintenance like other resource. Prior to this release, you had to disable monitoring (Pause and Resume) on each web service individually.
You can put a web service resource into scheduled maintenance
Knowledge base articles
You can now associate knowledge base articles with a web service resource, just like you can do with other types of resources.
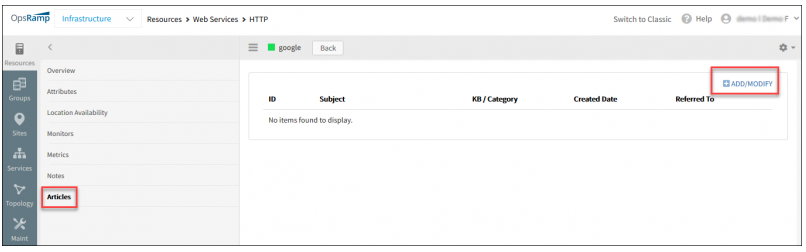
Associate knowledge base articles with a web service resource
Sites
You can now add web services (synthetics) to a site.
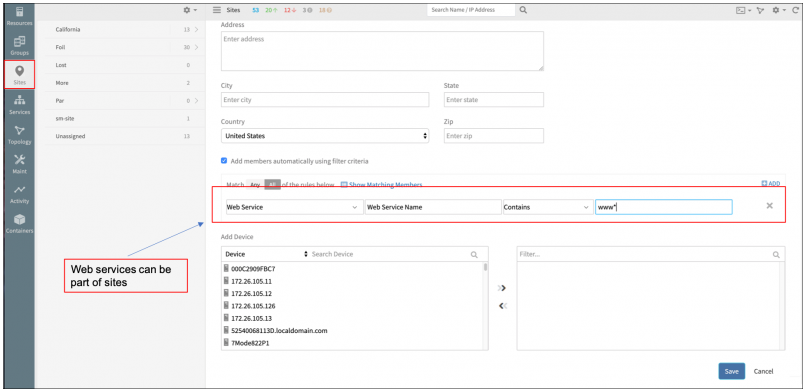
Add web services (synthetics) to a site
Network Monitoring
Interfaces are not getting discovered for Network devices
All the device related information (Make, Model, S/No., etc.) are being discovered correctly for 3 devices when discovered via SNMP, but interfaces are not getting discovered.
When SNMP walk is done from OpsRamp Gateway, the interfaces can be seen. Also, when the SNMP 64-bit interface template is applied, able to view, but not under the Interfaces tab.
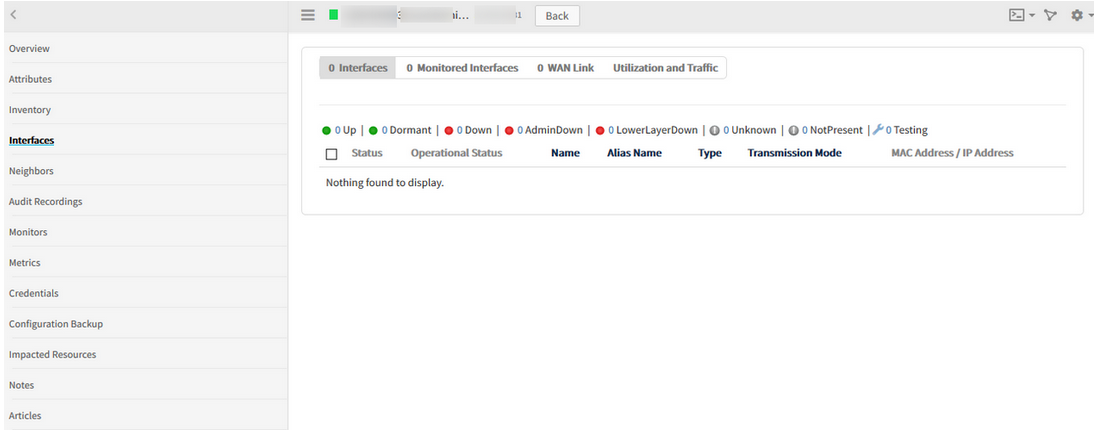
Interfaces are not getting discovered for Network devices
Issue is fixed. Now the Interfaces can be viewed in both Classic and New UI.
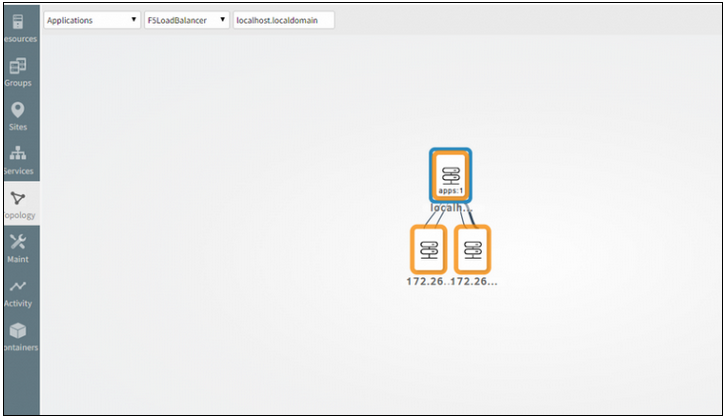
F5 load balancer is added in topology page under Applications category
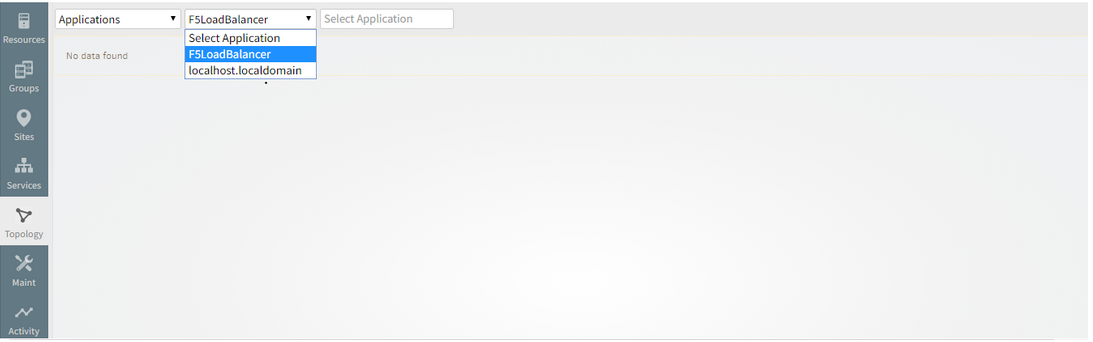
F5 load balancer is added in topology page under Applications category
Patch Management
Device Type and Device Name are interchanged in Devices offline Notification Mail
The Device Type columns shows Device Name and Device Name column shows Device Type.
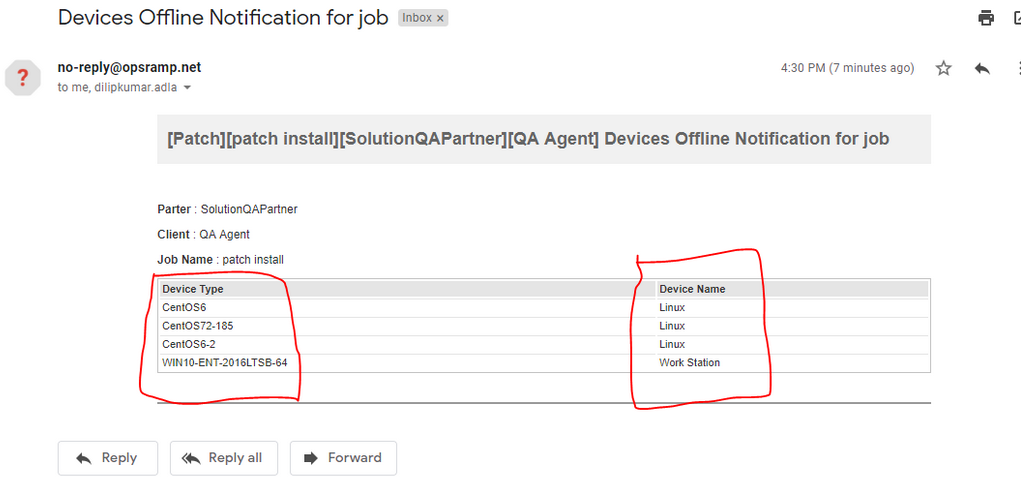
Device Type and Device Name are interchanged
Issue is fixed. The columns are displaying correctly.
Provided Patch Status and Patch Pending Approval widgets at Device Group level
Patch Status Widget:
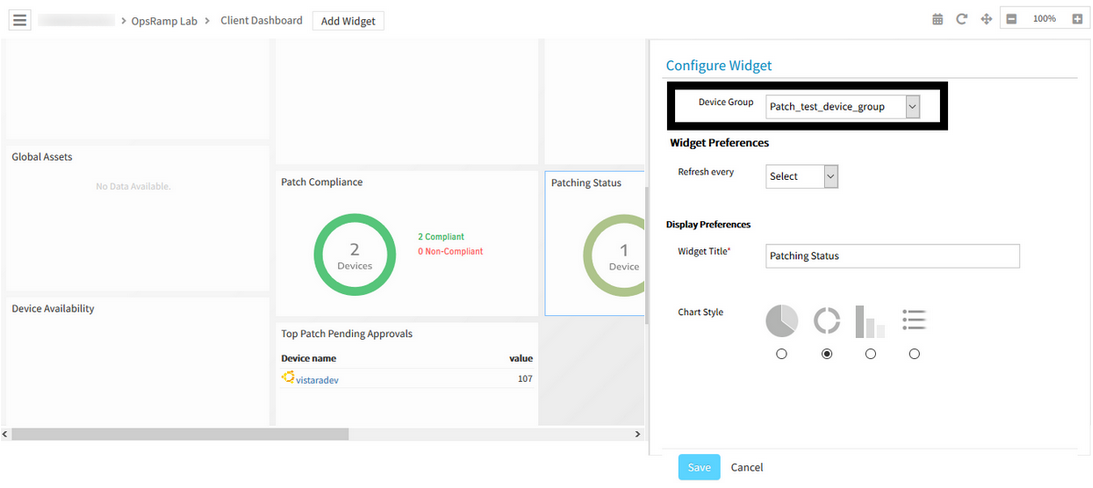
Patch Status Widget
Patch Pending Approval Widget:
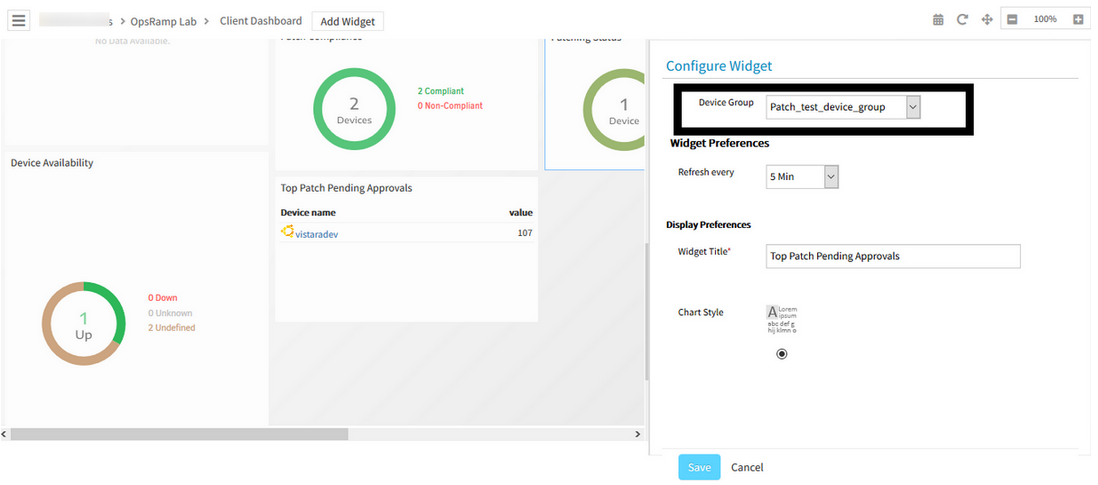
Patch Pending Approval Widget
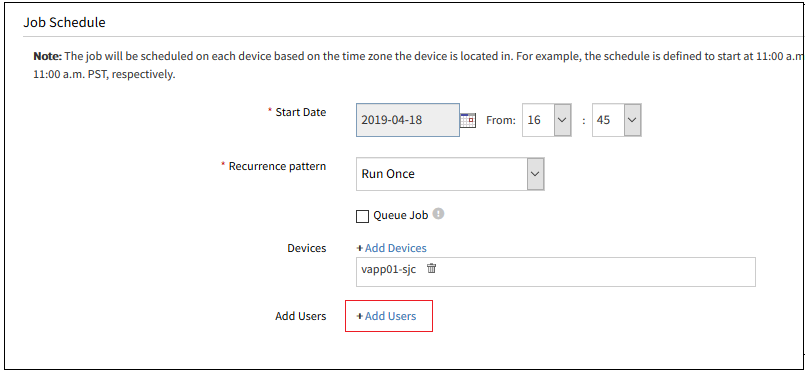
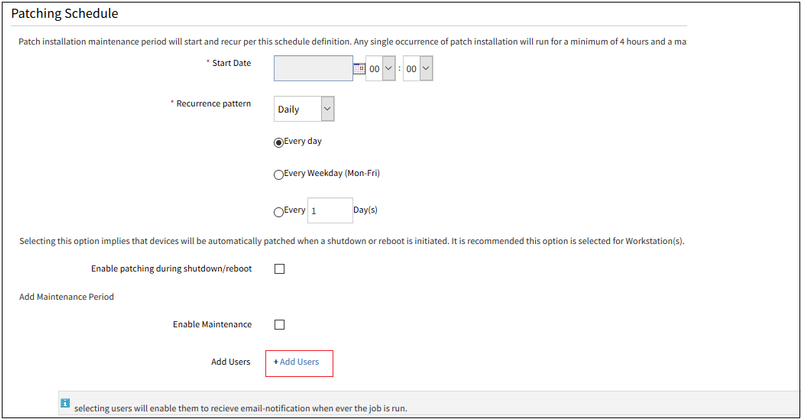
Notification on patch jobs
OpsRamp can now send email notification at the completion of a patch scan and after patches jobs are applied. The summary includes key information on the outcomes of the job such as the number of devices successfully scanned or patches, number missing patches, number devices that were not patches successfully, etc.
Note: To receive these patching notifications you must have report notifications enabled in your user preferences.
Notification on patch jobs
Notification on patch jobs
While adding Patch Compliance, all the Devices groups are loading, for the users who do not have permission to access
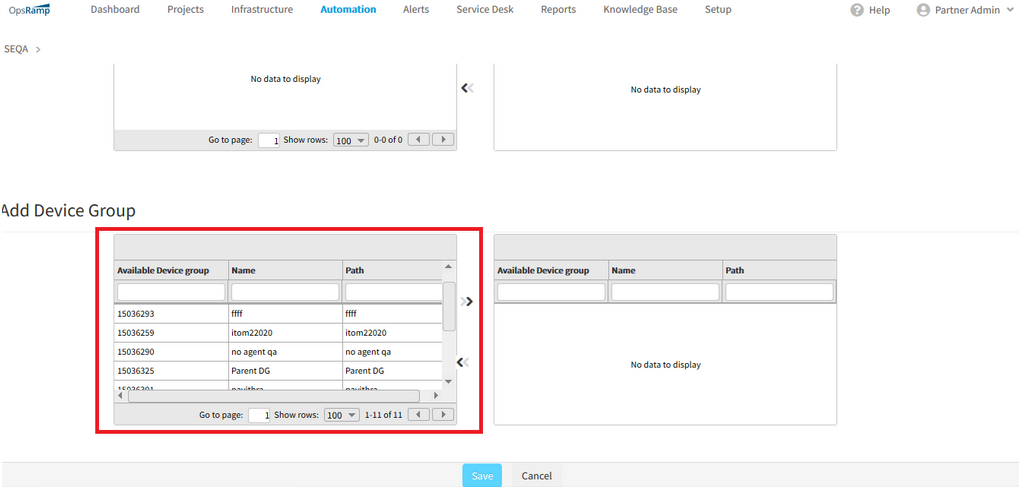
All the Devices groups are loading, for the users who do not have permission to access
The edit option in patching is allowed only for the users having All devices permission: RBAC user.
Availability
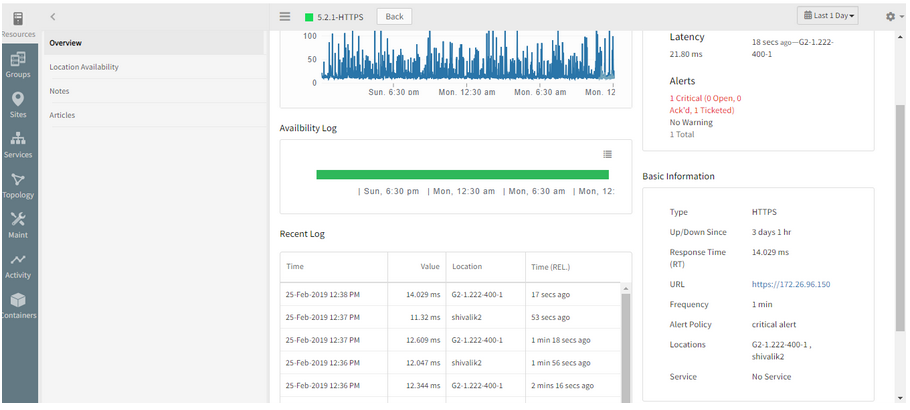
The Availability log and the Location-wise Availability log are not displaying for the Web Services
Availability log is not displaying
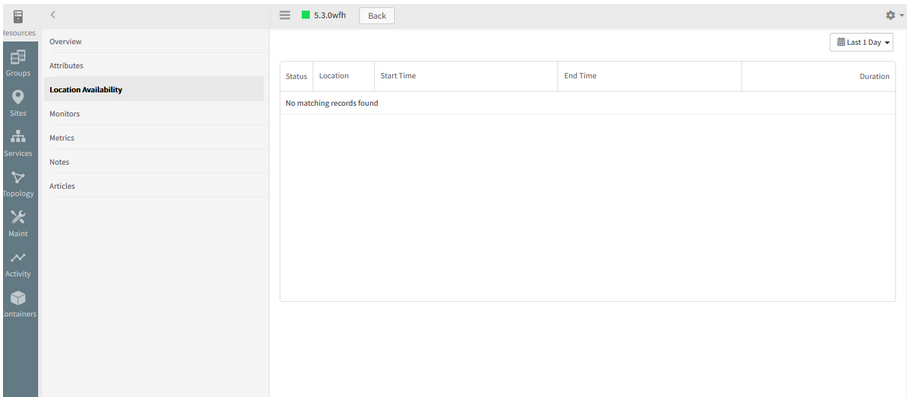
Location-wise Availability log is not displaying
Issue is fixed.
Availability log and the Location-wise Availability log are being displayed for the Web Services.
Core Platform
Matching members are not being displayed while creating a Device Group
When trying to filter on 4 tags, the below error message is displayed.
When searched on the first 3 tags, it is showing 54 results. If one more filter is added, Page Unavailable message is displayed. Changing the search criteria also shows the same Page Unavailable message.
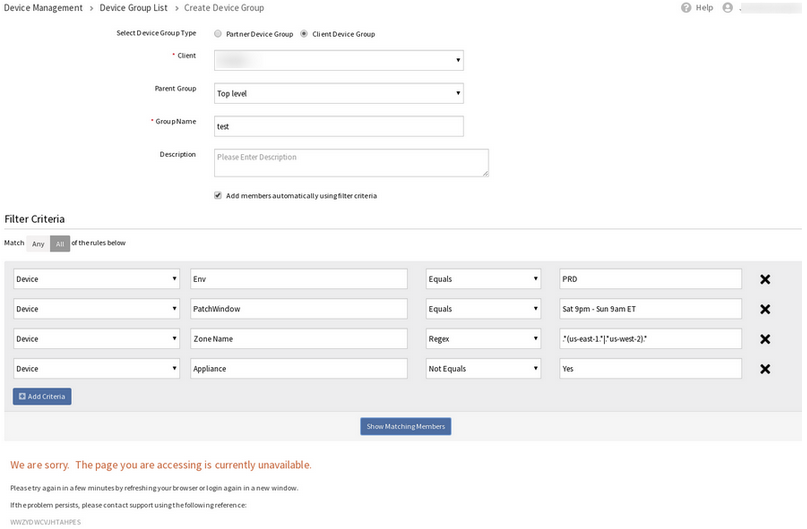
If one more filter is added, Page Unavailable message is displayed
When searched on the first 3 tags:
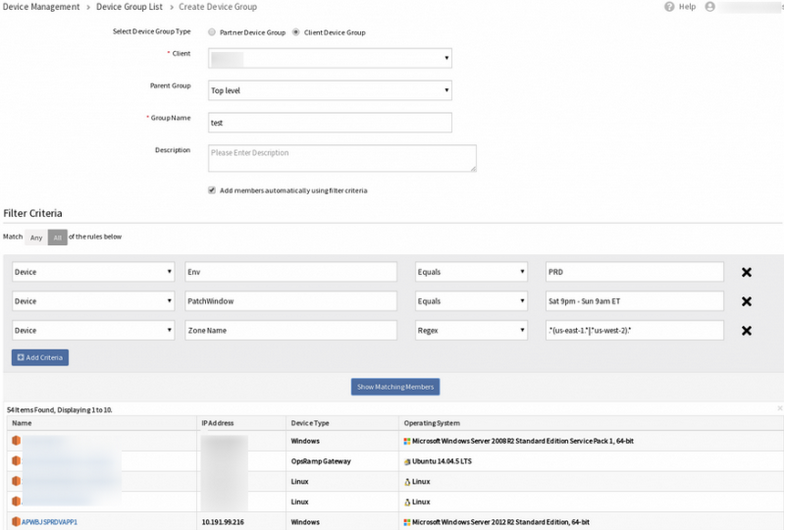
When searched on the first 3 tags, it is showing 54 results
Issue is fixed.
The filter is working properly with any number of tags.
Experiencing huge lags while opening alerts
Alert history also is not loading.
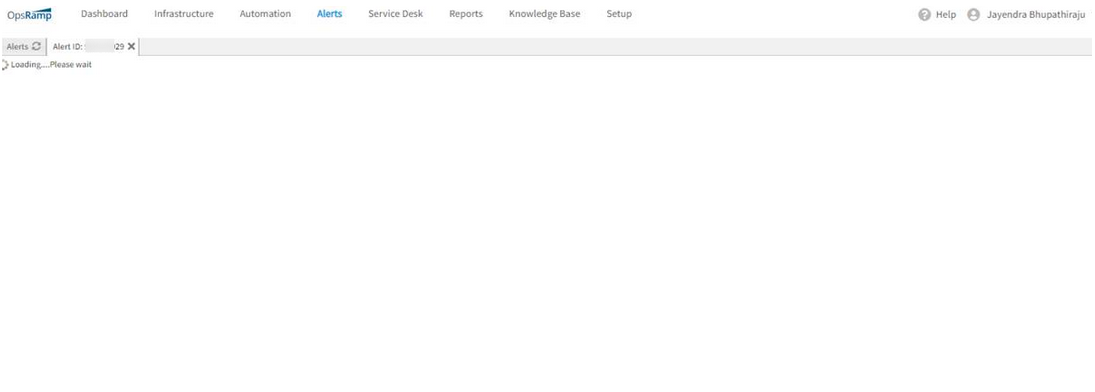
Alerts are not loading
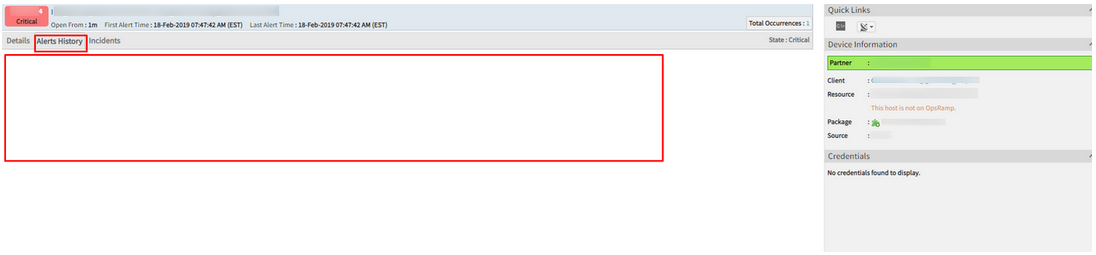
Alert history also is not loading
Issue is fixed. Latency is resolved.
Now the alerts and alert history are loading properly.
Compute Monitoring
When there are alerts on the Blade servers and their components, the alerts only carry the name of the Blade Server (like Blade 1, Blade 2)
There should be additional details for the UCS monitoring alerts.
Provided the following details in Alerts which can be used to identify the exact resource under the UCS tree.
sys/chassis-1/server-1
chassis-1 -> identifies the chassis.
server-1 -> identifies the server under the chassis.
Now, the Chassis name is also displayed in the alert.
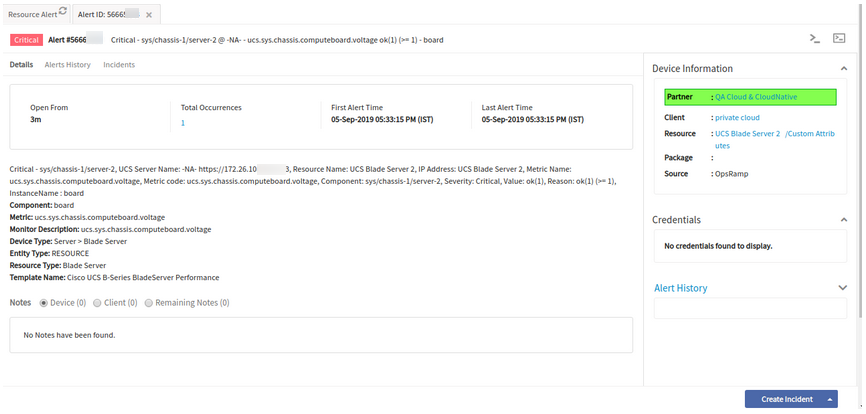
Chassis name is also displayed in the alert
It is easy to identify which server from which chassis the alerts belong to.
Service and Topology Maps
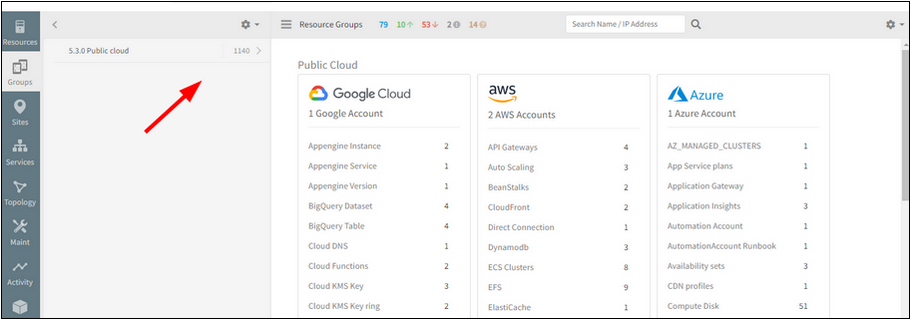
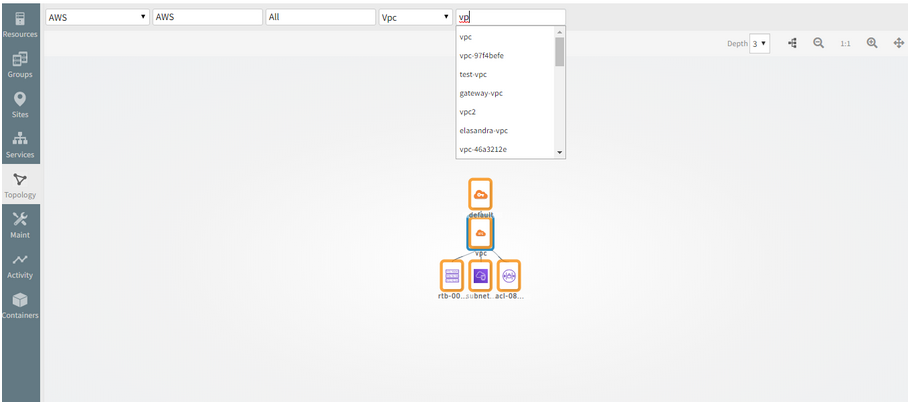
Cloud Topology for Amazon AWS
OpsRamp now automatically creates a topology of your public cloud resources, from discovery. The new cloud topology map shows relationships between your cloud assets such as AWS VPC, RDS, EC2 instances as well as relationships between your Data Center assets and public cloud.
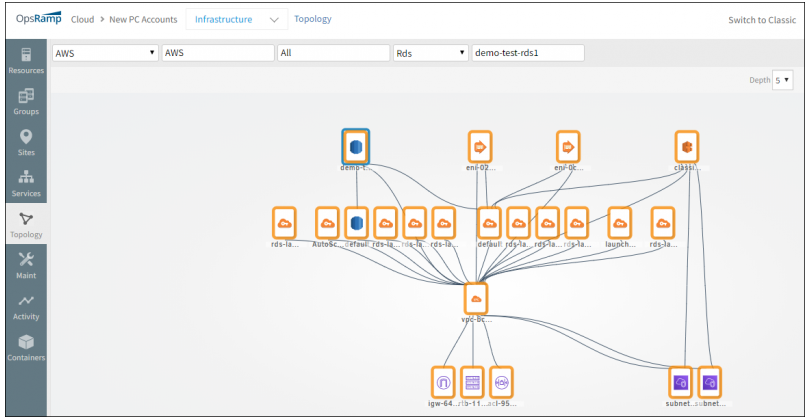
Cloud Topology for Amazon AWS
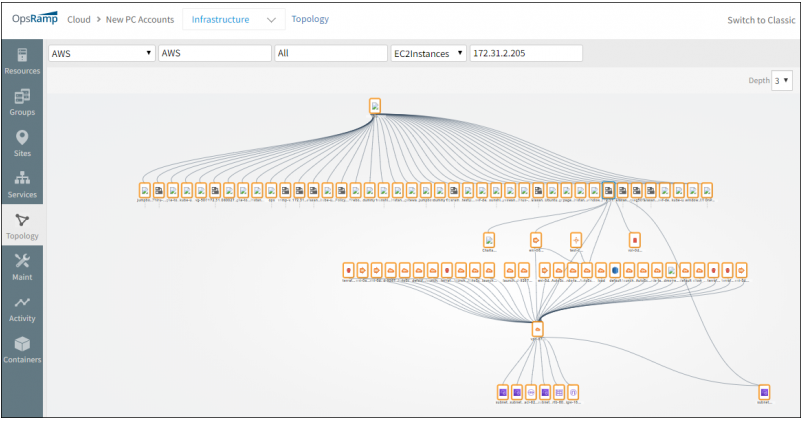
Cloud Topology for Amazon AWS
Improved Application Discovery
Load balancer connections
Application discovery can now discover connections between a load balancer and downstream application servers. This brings visibility to the “last mile” of typical enterprise application deployment architectures. Currently, this feature is available only for F5 Big-IP load balancers.

Improved Application Discovery
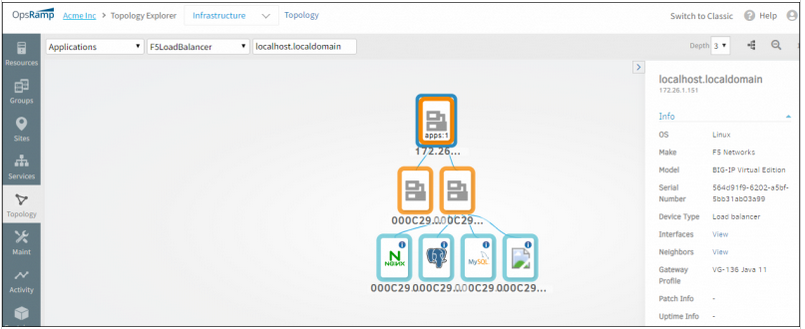
Improved Application Discovery
Network discovery of cross-site connection topology
Network discovery now includes discovery of network connections between sites within the enterprise as well as between Data Center and the cloud. Network discovery uses BGP/OSPF routing configuration to discover cross-site connections
OSPF Neighbours
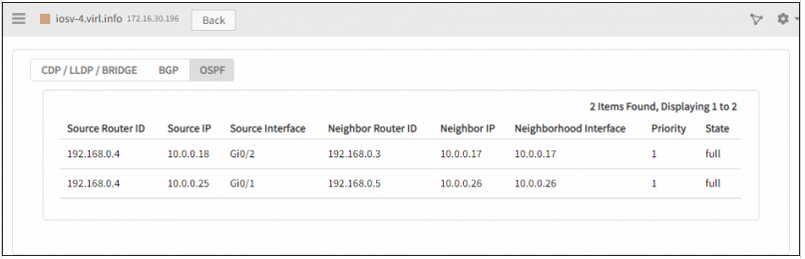
OSPF Neighbours
CDP/LLDP and BRIDGE Neighbours
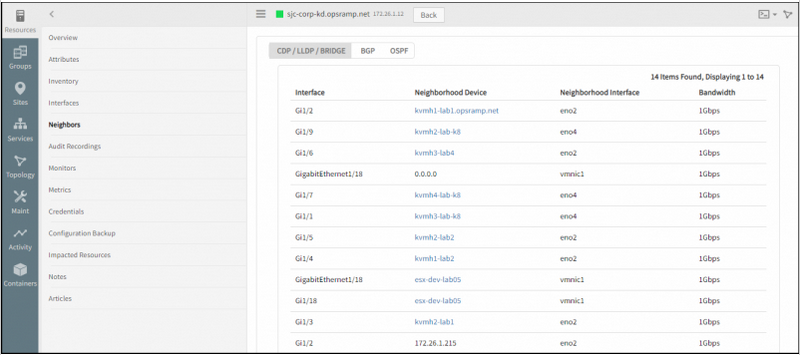
CDP/LLDP and BRIDGE Neighbours
BGP Neighbours
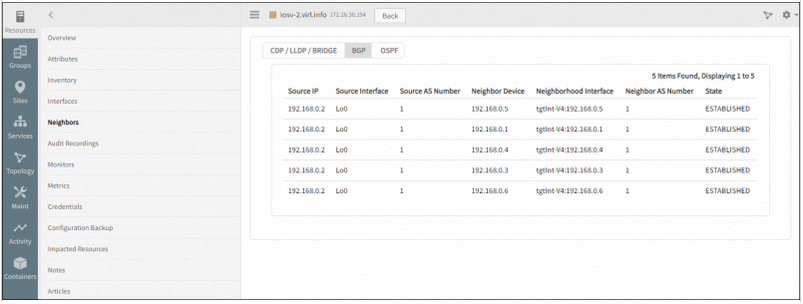
BGP Neighbours
CDP/LLDP and BRIDGE Topology
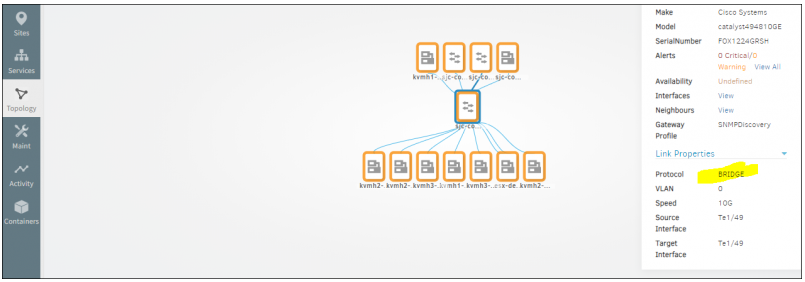
CDP/LLDP and BRIDGE Topology
You can now filter the service map listing page by standalone services and linked services
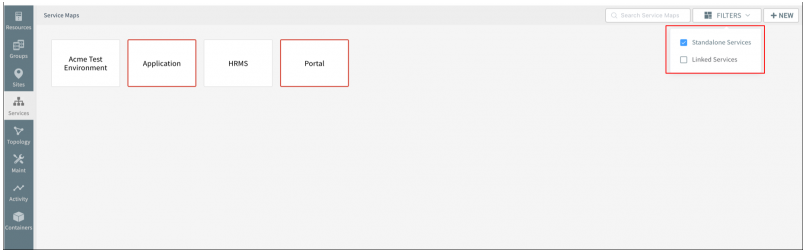
Filter the service map listing page by standalone services and linked services
Now configure a service map’s availability rules based on the availability of member web services (synthetics)
Prior to this release, you could not configure availability rules for a service map based on the web service.
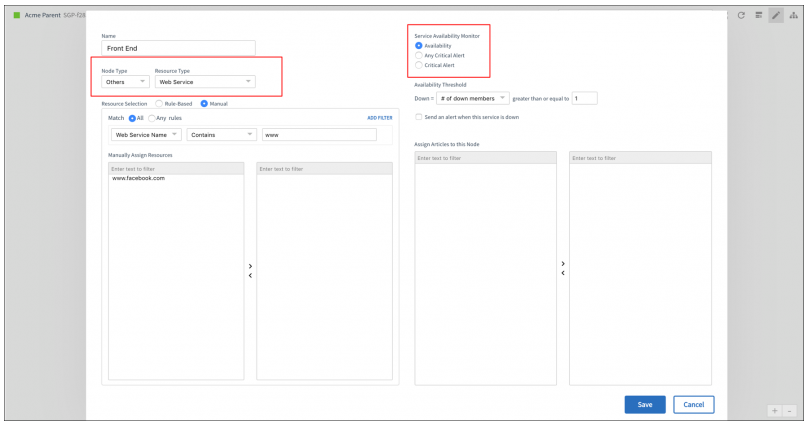
Configure a service map’s availability rules based on the availability of member web services
Application Management
Monitors for new applications
OpsRamp can now monitor the following applications, common in modern cloud native application stacks, via the Gateway:
- Elastic Search
- Apache Solr
- ActiveMQ XML
- RabbitMQ
- Apache Spark
- Fluentd
- Radius Authentication Server
- Couchbase
- Couchdb
- Sybase Database
- Neo4j
- Cockroach Database
Resource Attributes
Edit native attribute values
You can now edit native attribute values of a resources that are not automatically discovered. Prior this release, you could only edit attributes for manually created resources.
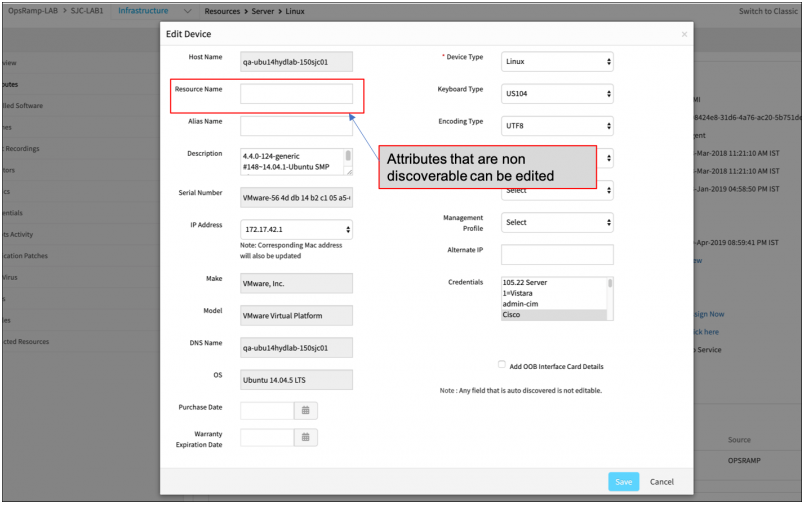
Edit native attribute values of a resources that are not automatically discovered
Un-assign and re-assign actions in device management policies
Device management policies – un-assign and re-assign templates, knowledge base articles, jobs, credentials and custom attributes.
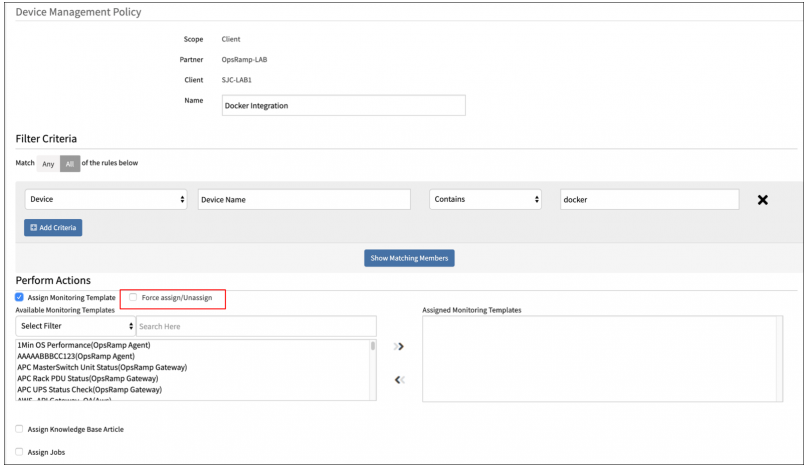
Un-assign and re-assign actions in device management policies
Custom attribute enhancements
You can now assign custom attributes to any type of managed resource, including web services (synthetics), cloud resources, storage arrays, etc. Prior to this release, custom attributes were only supported on compute resources.
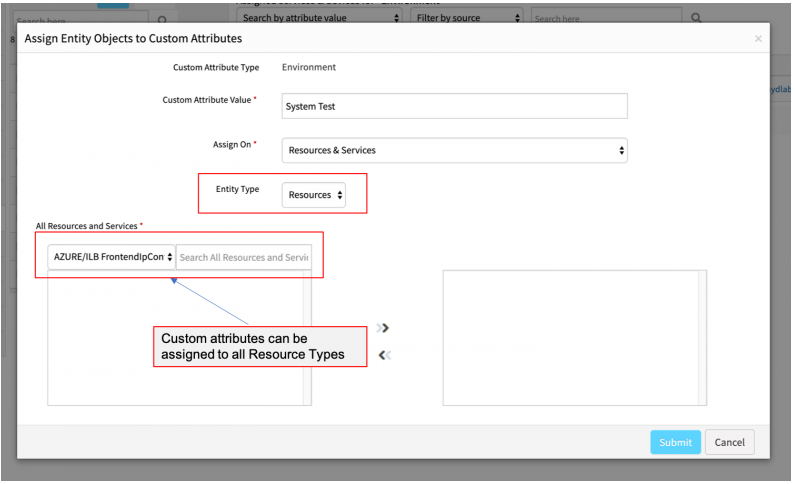
Custom attribute enhancements
Reports
Issue with generating reports
The reports status is showing In Progress for a couple of hours and not getting generated.
Issue with generating reports
Issue is fixed. The reports are being generated.
Error message when creating Monitor Details Report
In the process of creating Monitor Details Report, when the Across All Clients option is selected, and then when Sites, devices, etc. are selected, an error message is displayed, Client Not Selected.
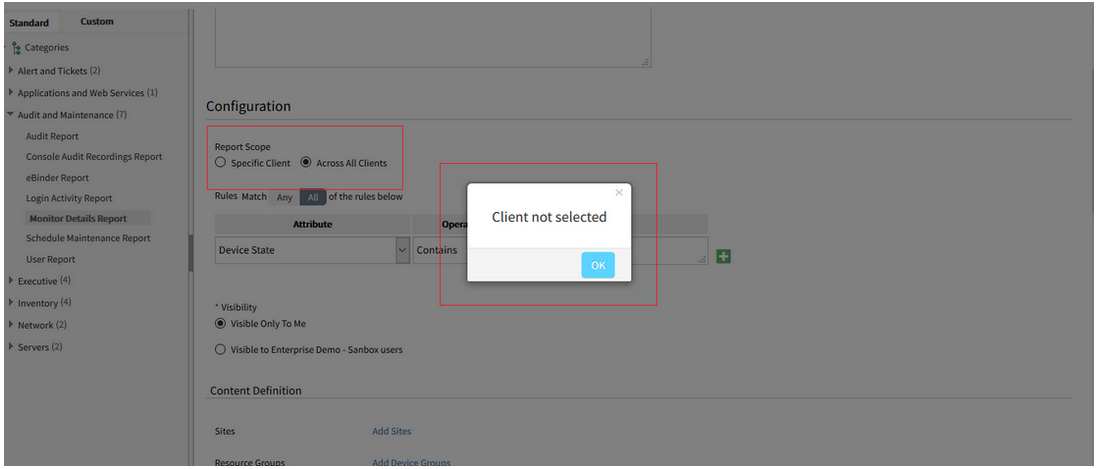
Error message when creating Monitor Details Report
Issue is fixed.
When Across All Clients is selected, there is no error message displayed. The reports are being created successfully; the Monitor Details, Schedule Maintenance, and Network Backup reports.
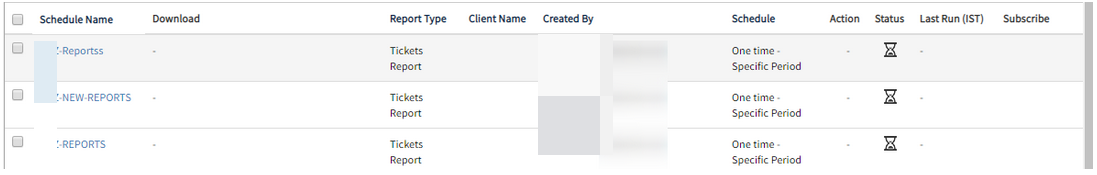
Metric report is not being generated automatically
As a result, the reports must be run manually.
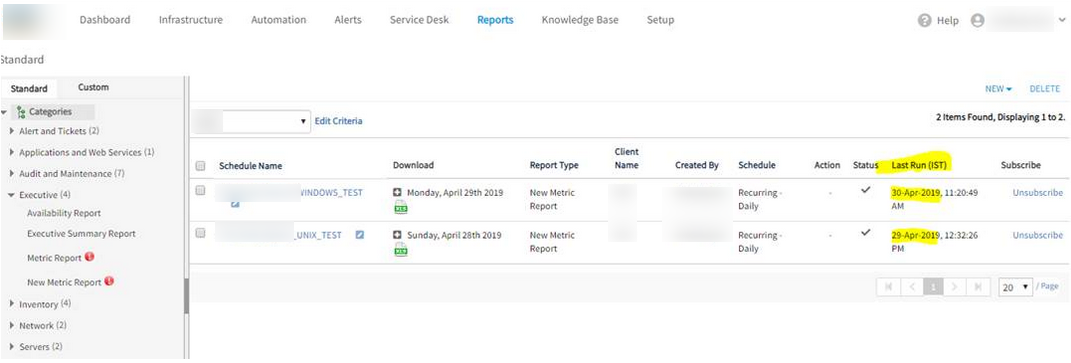
Metric report is not being generated automatically
Due to high utilization on the server, the reports did not trigger.
Issue is fixed. The daily schedules are generating as expected.
Additional cloud inventory attributes in custom reports
Custom inventory report is enhanced to include virtual private cloud attributes, such as VPC id, VPC Name, Subnet ID, and Subnet name.
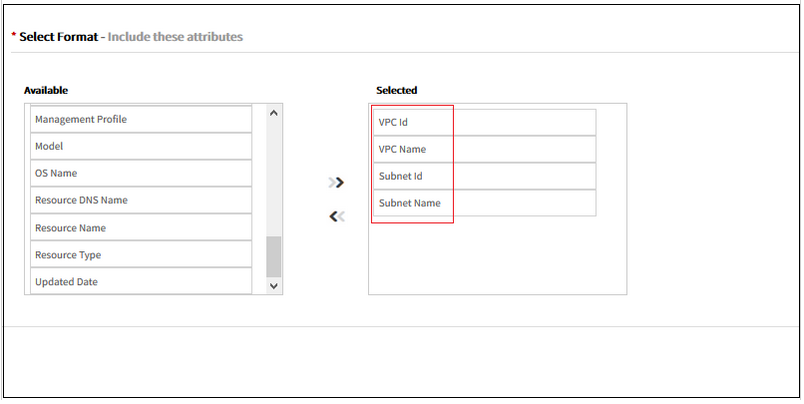
Additional cloud inventory attributes in custom reports
Metric filters in custom reports
OpsRamp lets you now filter alerts based on the source metric used to generate alert. For instance, you can generate an inbound integration failures report by filtering the custom alert report with a metric filter as shown below.
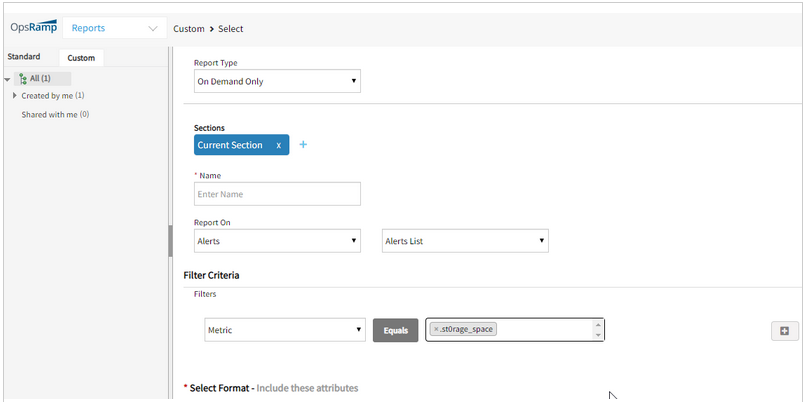
Metric filters in custom reports
Data Export
OpsRamp can export snapshots of inventory, alert, ticket and metric data to Amazon AWS S3. Exports can be scheduled for a specific time or a recurring period. With this capability, you can incorporate OpsRamp generated data about your environment into your overall data warehousing and data mining efforts.
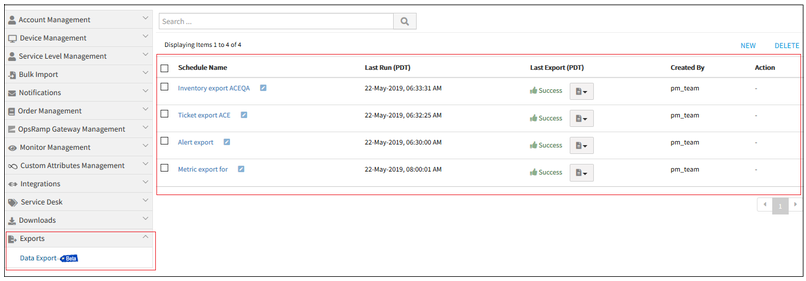
Data Export
Note: This feature is an optional module that is not enabled by default. Please contact your OpsRamp account manager if you would like this feature to be enabled.
Custom report enhancements
Custom inventory report
You can now filter inventory reports by the first created date of a resource.
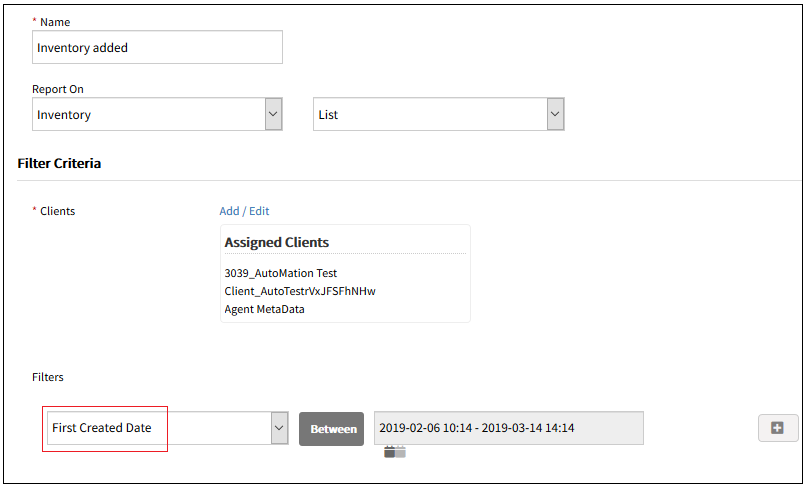
Custom inventory report
Custom alert report
Custom alert report now includes alert history attributes such as createdBy, createdTime, acknowledgedBy, acknowledgedTime, suppressedBy, etc.
Custom alert report
User and Access Management
Automated user provisioning
OpsRamp can now automatically provision users when they first log into OpsRamp via a SAML compliant single sign-on solution such as Microsoft Active Directory Federation Services (ADFS), Okta, or OneLogin. OpsRamp also maps rights granted to a user in the SSO solution to a role in OpsRamp.
With this feature, if you use a SSO solution across the organization, you do not need to provision users in OpsRamp separately.
Agent and Gateway Management
Windows agent deployment utility
OpsRamp now provides a utility to deploy the Windows Agent in bulk across Windows machines. The utility is available for download from the Setup page.
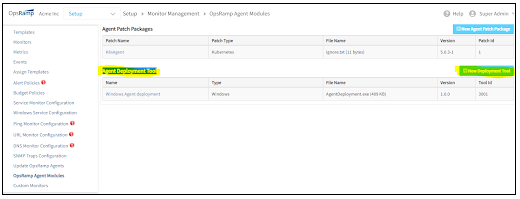
Windows agent deployment utility
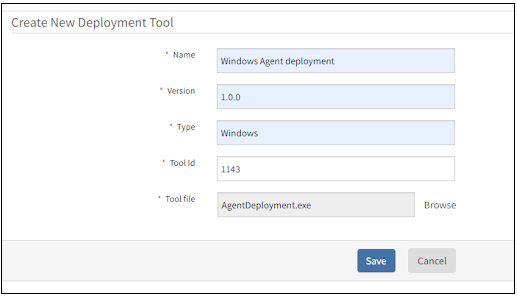
Windows agent deployment utility
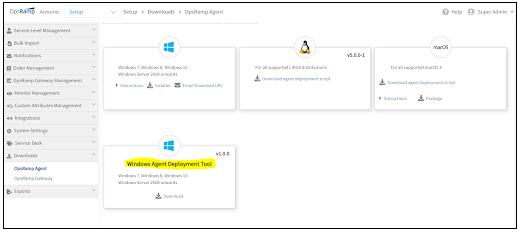
Windows agent deployment utility
Automate Gateway registration
A newly spun up Gateway can now be registered and activated programmatically. The Gateway now supports an API through which you can provide the activation token and initiate registration. Prior to this release, Gateway registration could only be done interactively.
Firmware update for Gateway
Starting with this release, OpsRamp Gateways will run a new version of firmware – version 5.3.0 which is more secure and up-to date. Existing Gateways, running version 5.0.0 firmware or older firmware versions, cannot be updated in-place, to version 5.3.0 firmware. This is because version 5.3.0 is a major update. Existing Gateways will need to be replaced with new Gateways.
Gateway images with version 5.3.0 firmware will be available for download within three weeks of this release. Documentation on how to replace existing Gateways with new Gateways will be published at the same time. Please contact support (support@vistanet.jp) if you have questions or need guidance in updating Gateways.
Note:
- Existing Gateways: Your existing Gateways running pre-5.3.0 firmware will continue to work normally even after this release. End-of-life timelines for Gateways with pre-5.3.0 firmware will be announced shortly.
- Generation 1 Monitoring Templates: Gateways running version 5.3.0 firmware will no longer support legacy Generation 1 templates. Over the last 12 months, most environments have already been migrated to Generation 2 templates. Please contact support (support@vistanet.jp) if you have questions.
Service Management
Unable to see the Incidents list under Service Desk
User is able to view the tickets count, but when clicked on the count no ticket list is displayed.
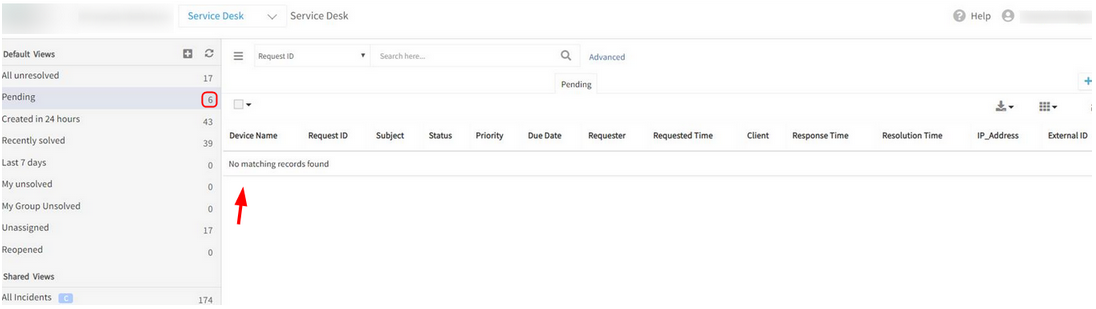
Unable to see the Incidents list
Issue is fixed. The ticket list is displayed when clicked on the tickets count.
Knowledge Base
Unable to download any of the attachments from KB articles
It is prompting for a different file download, ‘ServiceDesk.do’.
When validated from Firefox, it prompts for the above file and a Blank page is displayed.
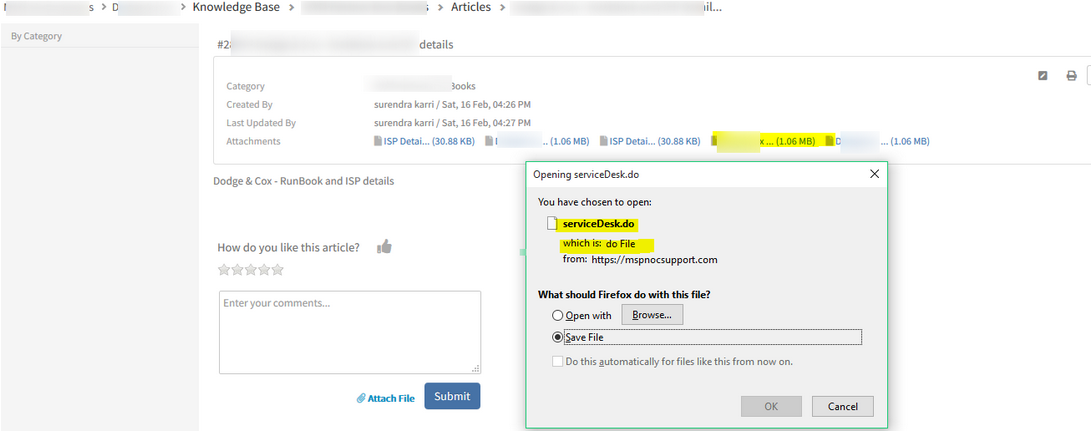
Unable to download any of the attachments from KB articles
Issue is fixed. KB article attachments are displayed appropriately.
Left pane is not displaying KB Articles
The large number of KB Categories and articles is causing Gateway timeout while loading the Knowledge Base Category tree.
It is taking more time than usual to get the count of articles for all the categories.
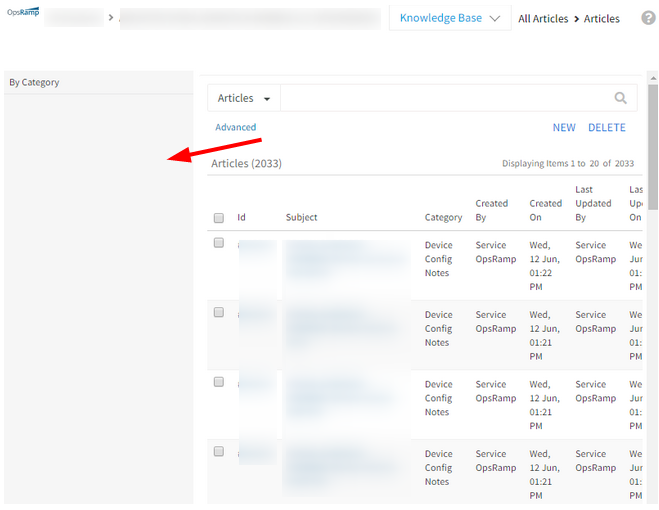
Left pane is not displaying KB Articles
Issue is fixed. The Category tree is loading successfully.
Automation
Duplicate Integration names are displayed under Service Task for Job Workflows
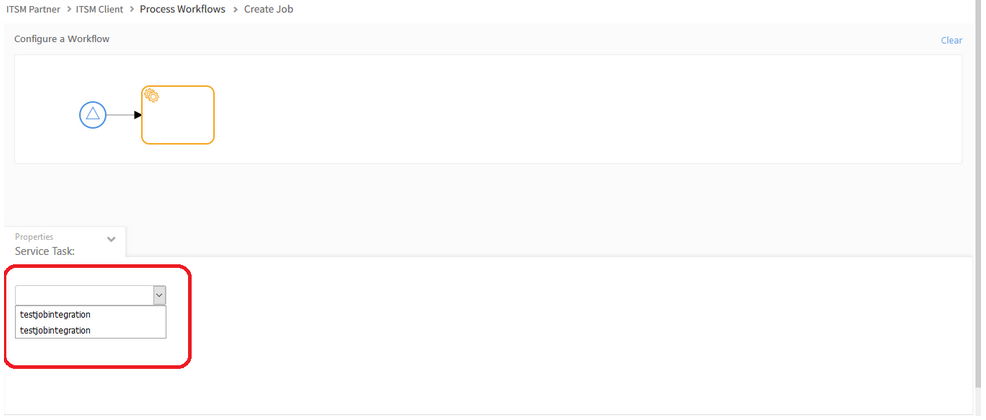
Duplicate Integration names are displayed under Service Task
Issue is fixed. Integration names are displayed properly in the Service Task dropdown.
Gateway
Empty Device Name in Management Profile List page
Connected devices count shows 278, but Gateway device name is displayed as Empty.
Status Text message is also incomplete on the Management Profile List page, says.. “Down for”
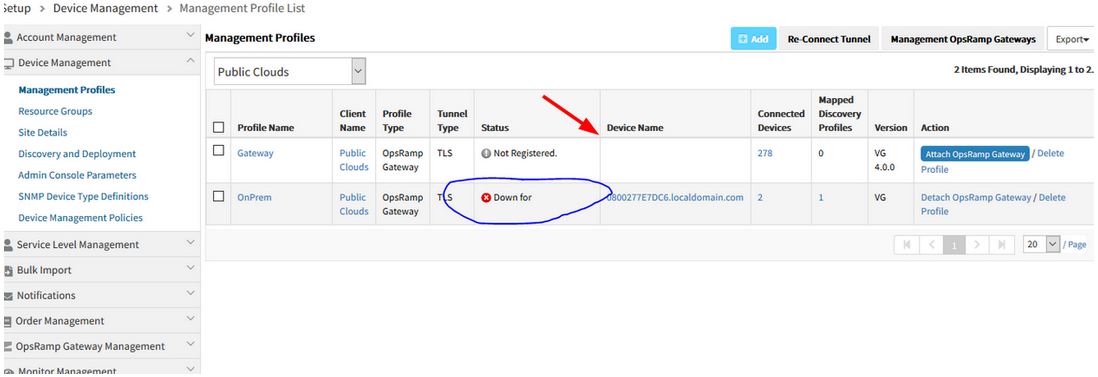
Empty Device Name in Management Profile List page
Issue is fixed. The Gateway device name is displayed properly, and the Status Text message is displaying completely.
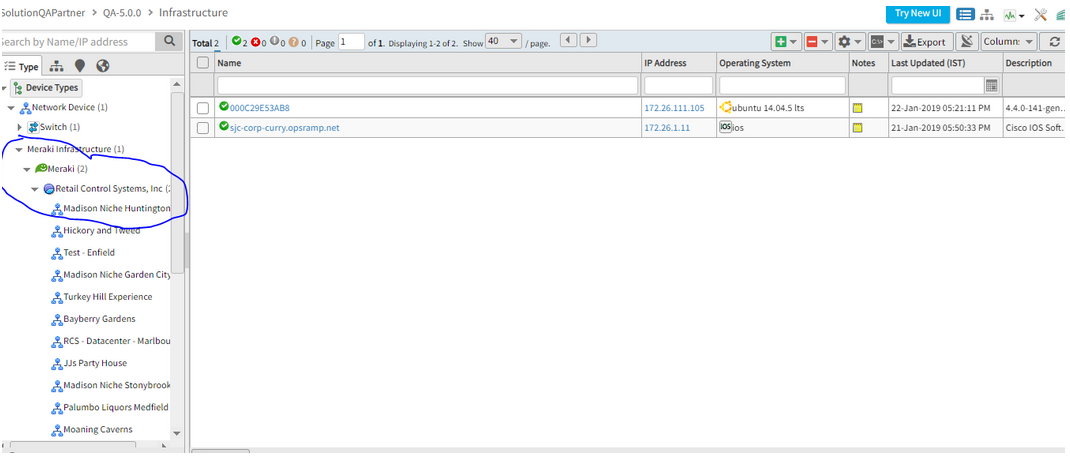
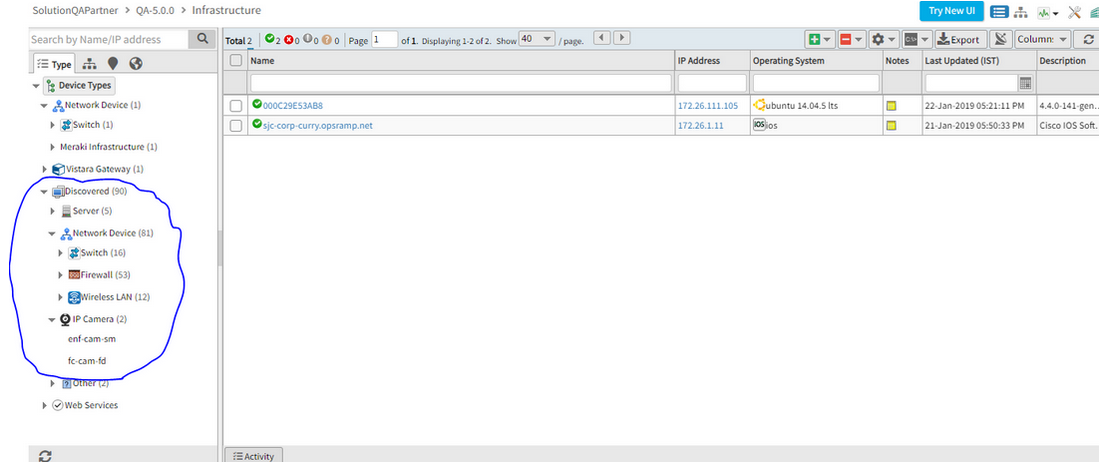
Unmanaged Meraki Devices are showing in Managed Section, in the Infrastructure page
A tree is created under the Managed section for the Meraki devices, even though the devices are not managed.
Unmanaged Meraki Devices are showing in Managed Section
Unmanaged Meraki Devices are showing in Managed Section
Issue is fixed. Meraki devices which are only discovered and not managed, are being displayed under the Discovered tab.
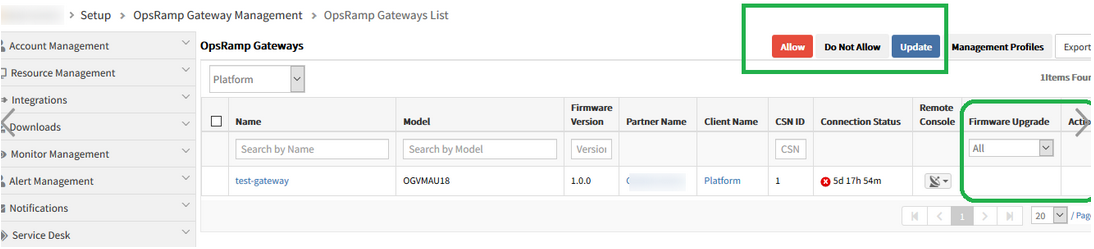
NSGAdmin user will work based on the roles and permissions
NSGAdmin user will also not be able to see Gateway related Admin options, if they do not have Allow Gateway Firmware Upgrade permission. So, NSGAdmin user will work based on the roles and permissions.
Previously, only NSGAdmin user had Gateway Admin related permissions, like Allow, Do Not Allow and Update, so only this user could see the admin options. But users with Service Provider Administrator role were unable to view these options.
So, Allow Gateway Firmware Upgrade permission is introduced. Now the user who has this permission, can view these options.
Need to assign this permission to NSGAdmin user manually.
The new permission set is created using this new permission in all the 3 levels (i.e., SP, Partner and Client).
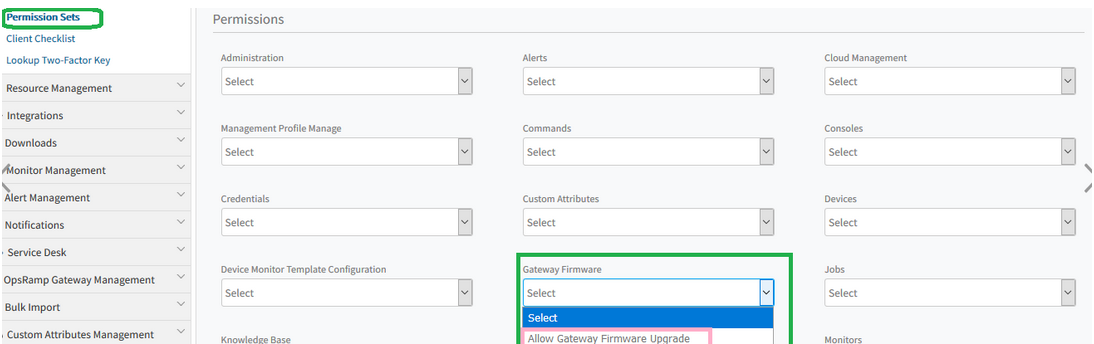
Allow Gateway Firmware Upgrade permission is introduced
Allow Gateway Firmware Upgrade permission is introduced
Tenancy and RBAC
Unable to create user at Client level
While assigning roles for this client, the Roles are not visible, the page is getting stuck and an error message is displayed.
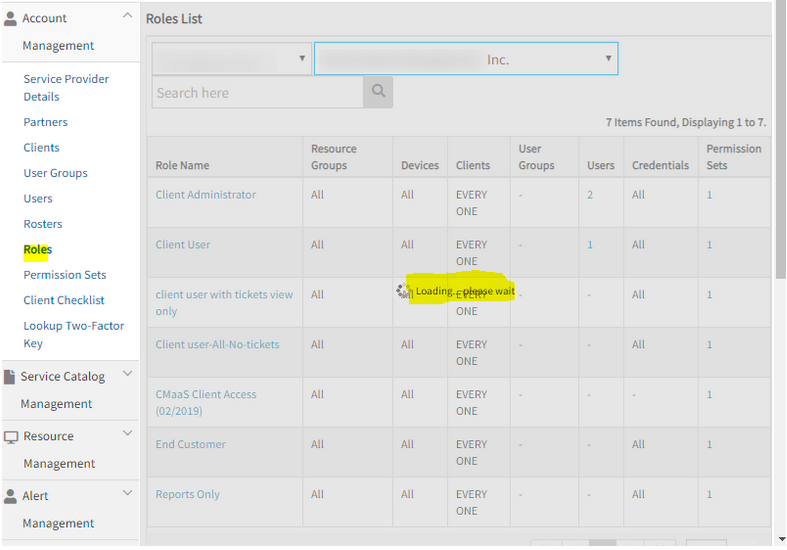
While assigning roles for this client, the Roles are not visible, the page is getting stuck
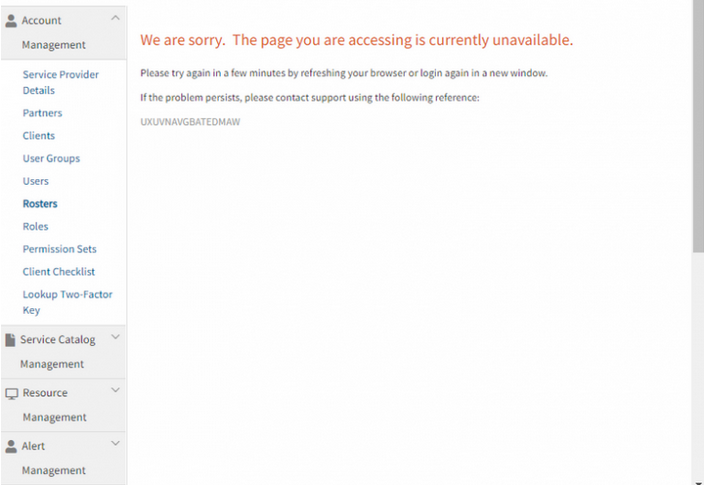
An error message is displayed
Issue is fixed. Roles are visible in the portal, and the client level user can be created successfully.
Monitoring
Agentless custom monitors
Agentless monitoring relies on OpsRamp Gateway that is capable of monitoring remote machines using SSH. This enhancement enables custom monitoring and OpsRamp provides sample code structure. With this structure, you can write own custom monitor using any of the following scripts: BASH, PYTHON or PERL.
APIs
New APIs
The following new APIs are now available:
Data Export
First Response Policy
Inference Model
Knowledge Base
SSO Integration
Updated APIs with Resource identity attributes
As announced earlier, as part of planned resource identification improvements, the following APIs have been updated to include Resource Name, Host Name, and Alias Name:
Alerts
Alerts Escalation Policy
Automation (Patch Management, Patch Compliance, Patch Configuration, Jobs, RBA Scripts APIs updated)
Custom Attribute (Get Assigned Entities by Attribute APIs updated)
Device Management (Device Groups APIs updated)
Resource (Search Resources and Get Minimal Details of Resource updated)
Tenant (Get Role APIs updated)
Ticketing (Task, Get Change Request, Get and Search API for Incident updated)
APIs for the following features are now enhanced.
Alert Management
New API Alert Status History API to get the status history of the alert.
The GetAlertAPI and SearchAlertAPI can now filter based on the status history for alert.
Inference Model API’s: Users can now also create Partner level, inference models.
First Response Policy API’s: New API’s will allow users to create policy for the first response on the alerts.
Integration Management
Integration APIs: Improved search capability and actions based on Integration Types.
SSO Integration API’s: New APIs to configure SSO via available SSO Integrations.