Description
Monitors A10 system CPU utilization, disk utilization, memory utilization, fan status, power supply status, etc. Validated on Thunder Series Unified Application Service Gateway TH1030S, ACOS 4.1.1-P1(SysObjId: enterprises.22610.1.3.23), AX Series Advanced Traffic Manager AX3000-11, ACOS 2.7.1-P6(SysObjId: enterprises.22610.1.3.10), AX Series Advanced Traffic Manager AX3400, Advanced Core OS (ACOS) version 2.7.0-P2-SP3, etc.
Prerequisites
SNMP should be enabled in end device and device should support A10-AX-MIB OIDs and SNMP credentials should be attached against the device in portal.
How to Apply: This template is All instance selection based. It will not ask user to select any instance (s) while assigning it to a device.
Metric Parameters
| Parameter | Description |
|---|---|
| Frequency | Warning Threshold | If the metric value satisfies the condition defined along with Warning Threshold value, then a notification is sent to the user. |
| Critical Threshold | If the metric value satisfies the condition defined along with Critical Threshold value, then a notification is sent to the user. |
| Alert | The alert value can be set to either Yes or No. If it is Yes, then an alert message is sent to the user. |
Metrics
a10.avg.contol.cpu.usage
Metric Details
| Applicable for | Device | SNMP OID | 1.3.6.1.4.1.22610.2.4.1.3.4.0 |
| Expression | NULL |
| Description | Provides the average control CPU usage in last 5 seconds. [OID: 1.3.6.1.4.1.22610.2.4.1.3.4.0] |
| Category | SNMP monitors |
| Collector Type | Gateway |
| Monitor Name | A10 Load Balancer Average Control CPU Usage |
| Unit | % |
Possible Inputs
| Metric | Input Value | Range of Values |
|---|---|---|
| Frequency | 5 | 1 – 1440 (mins) |
| Filter | ||
| Warning Operator | GREATER_THAN_EQUAL | Ends with, ==, !=, >=, <=, >, <, In Range, Out of range, Equals, Not equals, Equals Ignore Case, Not Equals Ignore Case, Contains, Not contains, Regex match, Regex no match, In string list, Not in string list, In List, Not in list, Starts with |
| Warning Threshold | 85 | 0-100 |
| Warning Repeat Count | 3 | 1-12 |
| Critical Operator | GREATER_THAN_EQUAL | Ends with, ==, !=, >=, <=, >, <, In Range, Out of range, Equals, Not equals, Equals Ignore Case, Not Equals Ignore Case, Contains, Not contains, Regex match, Regex no match, In string list, Not in string list, In List, Not in list, Starts with |
| Critical Threshold | 90 | 0-100 |
| Critical Repeat Count | 3 | 1-12 |
| Alert | Yes | Yes/No |
| Graph (Yes/No) | Yes | Yes/No |
Sample Output
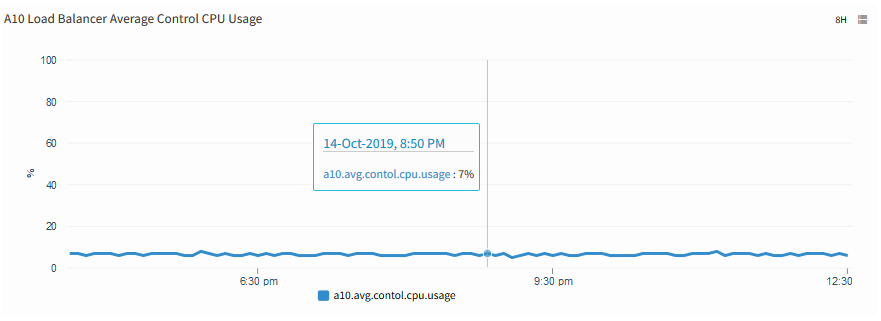
A10 Load Balancer Average Control CPU Usage
a10.avg.data.cpu.usage
Metric Details
| Applicable for | Device |
| SNMP OID | 1.3.6.1.4.1.22610.2.4.1.3.5.0 |
| Expression | NULL |
| Description | Provides the average data CPU usage in last 5 seconds. [OID: 1.3.6.1.4.1.22610.2.4.1.3.5.0] |
| Category | SNMP monitors |
| Collector Type | Gateway |
| Monitor Name | A10 Load Balancer Average Data CPU Usage |
| Unit | % |
Possible Inputs
| Metric | Input Value | Range of Values |
|---|---|---|
| Frequency | 5 | 1 – 1440 (mins) |
| Filter | ||
| Warning Operator | GREATER_THAN_EQUAL | Ends with, ==, !=, >=, <=, >, <, In Range, Out of range, Equals, Not equals, Equals Ignore Case, Not Equals Ignore Case, Contains, Not contains, Regex match, Regex no match, In string list, Not in string list, In List, Not in list, Starts with |
| Warning Threshold | 85 | 0-100 |
| Warning Repeat Count | 3 | 1-12 |
| Critical Operator | GREATER_THAN_EQUAL | Ends with, ==, !=, >=, <=, >, <, In Range, Out of range, Equals, Not equals, Equals Ignore Case, Not Equals Ignore Case, Contains, Not contains, Regex match, Regex no match, In string list, Not in string list, In List, Not in list, Starts with |
| Critical Threshold | 90 | 0-100 |
| Critical Repeat Count | 3 | 1-12 |
| Alert | Yes | Yes/No |
| Graph (Yes/No) | Yes | Yes/No |
Sample Output
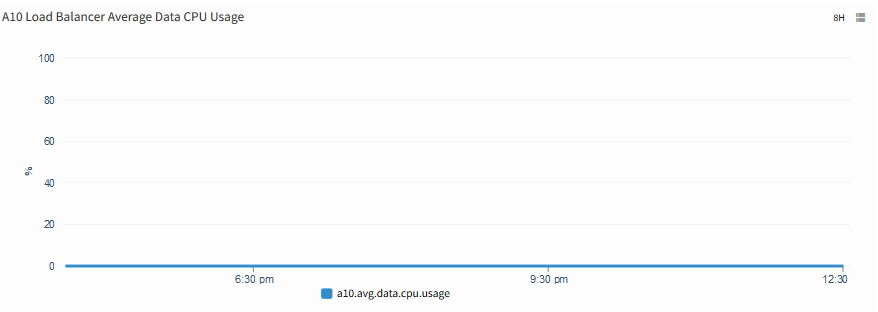
A10 Load Balancer Average Data CPU Usage
a10.cpu.usage
Metric Details
| Applicable for | Device |
| SNMP OID | 1.3.6.1.4.1.22610.2.4.1.3.2.1.3 |
| Expression | NULL |
| Description | Provides the CPU usage of the A10 Load Balancer. [OID: 1.3.6.1.4.1.22610.2.4.1.3.2.1.1 , 1.3.6.1.4.1.22610.2.4.1.3.2.1.3 ] |
| Category | SNMP monitors |
| Collector Type | Gateway |
| Monitor Name | A10 Load Balancer CPU Utilization |
| Unit | % |
Possible Inputs
| Metric | Input Value | Range of Values |
|---|---|---|
| Frequency | 5 | 1 – 1440 (mins) |
| Filter | NULL | Not Applicable |
| Warning Operator | GREATER_THAN_EQUAL | Ends with, ==, !=, >=, <=, >, <, In Range, Out of range, Equals, Not equals, Equals Ignore Case, Not Equals Ignore Case, Contains, Not contains, Regex match, Regex no match, In string list, Not in string list, In List, Not in list, Starts with |
| Warning Threshold | 85 | 0-100 |
| Warning Repeat Count | 3 | 1-12 |
| Critical Operator | GREATER_THAN_EQUAL | Ends with, ==, !=, >=, <=, >, <, In Range, Out of range, Equals, Not equals, Equals Ignore Case, Not Equals Ignore Case, Contains, Not contains, Regex match, Regex no match, In string list, Not in string list, In List, Not in list, Starts with |
| Critical Threshold | 90 | 0-100 |
| Critical Repeat Count | 3 | 1-12 |
| Alert | Yes | Yes/No |
| Graph (Yes/No) | Yes | Yes/No |
Sample Output
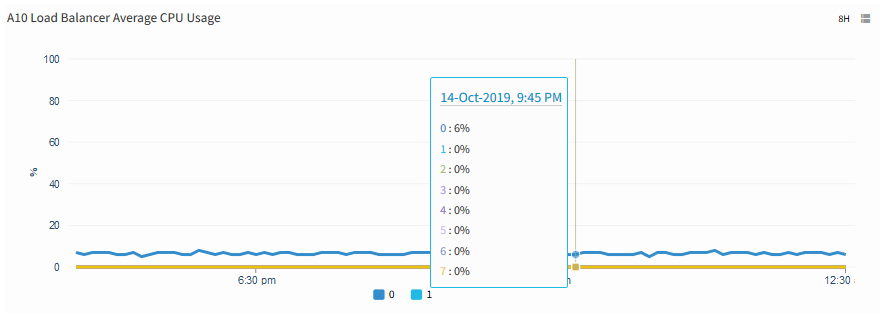
A10 Load Balancer CPU Utilization
a10.disk.usage
Metric Details
| Applicable for | Device |
| SNMP OID | 1.3.6.1.4.1.22610.2.4.1.4.1.0, 1.3.6.1.4.1.22610.2.4.1.4.2.0 |
| Expression | ((axSysDiskTotalSpace - axSysDiskFreeSpace) / axSysDiskTotalSpace) *100 |
| Description | Provides the disk utilization of the A10 Load Balancer. [OID: 1.3.6.1.4.1.22610.2.4.1.4.2.0, 1.3.6.1.4.1.22610.2.4.1.4.1.0] |
| Category | SNMP monitors |
| Collector Type | Gateway |
| Monitor Name | A10 Load Balancer Disk Usage |
| Unit | % |
Possible Inputs
| Metric | Input Value | Range of Values |
|---|---|---|
| Frequency | 5 | 1 – 1440 (mins) |
| Filter | ||
| Warning Operator | GREATER_THAN_EQUAL | Ends with, ==, !=, >=, <=, >, <, In Range, Out of range, Equals, Not equals, Equals Ignore Case, Not Equals Ignore Case, Contains, Not contains, Regex match, Regex no match, In string list, Not in string list, In List, Not in list, Starts with |
| Warning Threshold | 80 | 0-100 |
| Warning Repeat Count | 3 | 1-12 |
| Critical Operator | GREATER_THAN_EQUAL | Ends with, ==, !=, >=, <=, >, <, In Range, Out of range, Equals, Not equals, Equals Ignore Case, Not Equals Ignore Case, Contains, Not contains, Regex match, Regex no match, In string list, Not in string list, In List, Not in list, Starts with |
| Critical Threshold | 90 | 0-100 |
| Critical Repeat Count | 3 | 1-12 |
| Alert | Yes | Yes/No |
| Graph (Yes/No) | Yes | Yes/No |
Sample Output
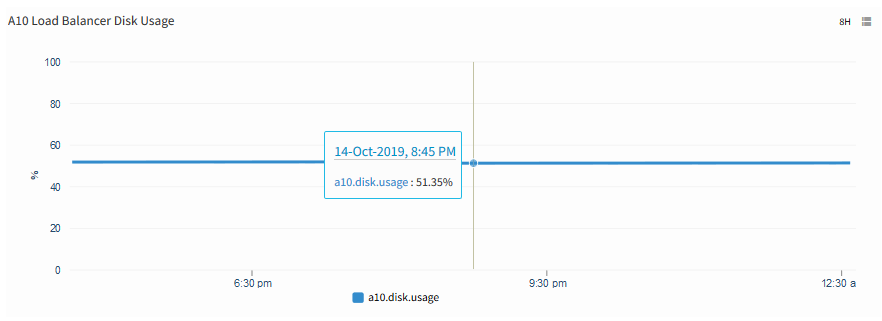
A10 Load Balancer Disk Usage
a10.memory.usage
Metric Details
| Applicable for | Device |
| SNMP OID | 1.3.6.1.4.1.22610.2.4.1.2.1.0, 1.3.6.1.4.1.22610.2.4.1.2.2.0 |
| Expression | (axSysMemoryUsage / axSysMemoryTotal) * 100 |
| Description | Provides the total memory utilization of A10 Load Balancer. [OID: 1.3.6.1.4.1.22610.2.4.1.2.2.0 , 1.3.6.1.4.1.22610.2.4.1.2.1.0] |
| Category | SNMP monitors |
| Collector Type | Gateway |
| Monitor Name | A10 Load Balancer Memory Usage |
| Unit | % |
Possible Inputs
| Metric | Input Value | Range of Values |
|---|---|---|
| Frequency | 5 | 1 – 1440 (mins) |
| Filter | ||
| Warning Operator | GREATER_THAN_EQUAL | Ends with, ==, !=, >=, <=, >, <, In Range, Out of range, Equals, Not equals, Equals Ignore Case, Not Equals Ignore Case, Contains, Not contains, Regex match, Regex no match, In string list, Not in string list, In List, Not in list, Starts with |
| Warning Threshold | 85 | 0-100 |
| Warning Repeat Count | 3 | 1-12 |
| Critical Operator | GREATER_THAN_EQUAL | Ends with, ==, !=, >=, <=, >, <, In Range, Out of range, Equals, Not equals, Equals Ignore Case, Not Equals Ignore Case, Contains, Not contains, Regex match, Regex no match, In string list, Not in string list, In List, Not in list, Starts with |
| Critical Threshold | 90 | 0-100 |
| Critical Repeat Count | 3 | 1-12 |
| Alert | Yes | Yes/No |
| Graph (Yes/No) | Yes | Yes/No |
Sample Output
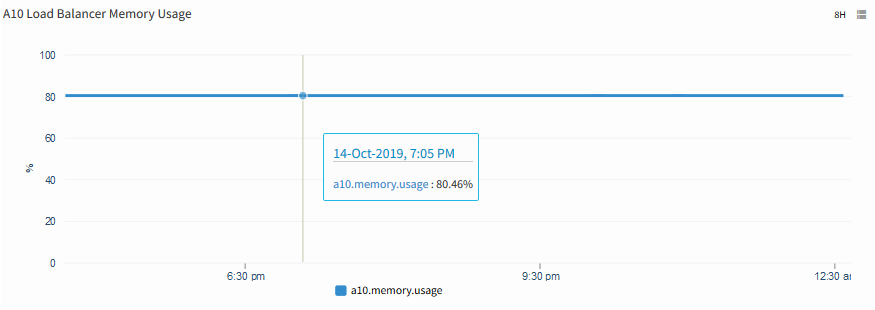
A10 Load Balancer Memory Usage
a10.lb.fan.status
Metric Details
| Applicable for | Device |
| SNMP OID | 1.3.6.1.4.1.22610.2.4.1.5.9.1.3 |
| Expression | NULL |
| Description | Provides the fan status of A10 load balancer. Possible status values are 0- Failed, 4- OK Fixed High, 5- OK Low Med, 6- OK Med Med, 7- OK Med High, -2- Not Ready, -1- Unknown. Alert is generated when the fan status is equal to 0- Failed, -1 - Unknown. [OID: 1.3.6.1.4.1.22610.2.4.1.5.9.1.2, 1.3.6.1.4.1.22610.2.4.1.5.9.1.3] |
| Category | SNMP monitors |
| Collector Type | Gateway |
| Monitor Name | A10 Load Balancer Fan Status |
| Unit |
Possible Inputs
| Metric | Input Value | Range of Values |
|---|---|---|
| Frequency | 5 | 1 – 1440 (mins) |
| Filter | NULL | Not Applicable |
| Warning Operator | ||
| Warning Threshold | ||
| Warning Repeat Count | ||
| Critical Operator | IN_LIST | Ends with, ==, !=, >=, <=, >, <, In Range, Out of range, Equals, Not equals, Equals Ignore Case, Not Equals Ignore Case, Contains, Not contains, Regex match, Regex no match, In string list, Not in string list, In List, Not in list, Starts with |
| Critical Threshold | -1,0 | [{"0":"Failed"},{"4":"OkFixedHigh"},{"5":"OkLowMed"},{"6":"OkMedMed"},{"7":"OkMedHigh"},{"-2":"NotReady"},{"-1":"Unknown"}] |
| Critical Repeat Count | 3 | 1-12 |
| Alert | Yes | Yes/No |
| Graph (Yes/No) | Yes | Yes/No |
Sample Output
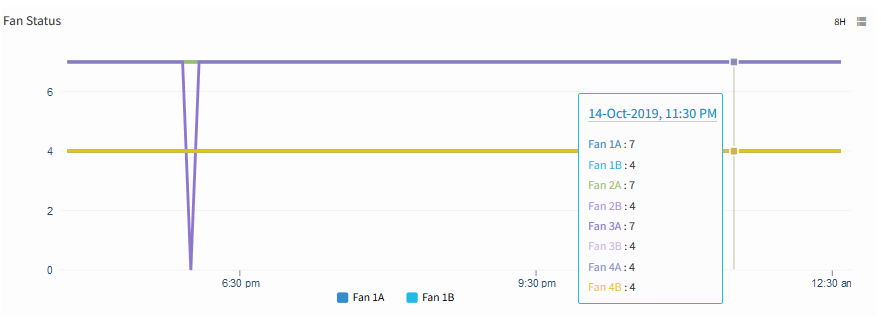
A10 Load Balancer Fan Status
a10.lower.powersupply.status
Metric Details
| Applicable for | Device |
| SNMP OID | 1.3.6.1.4.1.22610.2.4.1.5.7.0 |
| Expression | NULL |
| Description | Provides the lower power supply status of AX. Possible status values are 0- Off, 1- On, -1 - Unknown. Alert is generated when the status is equal to 0- Off, -1 - Unknown. [OID: 1.3.6.1.4.1.22610.2.4.1.5.7.0] |
| Category | SNMP monitors |
| Collector Type | Gateway |
| Monitor Name | A10 Power Supply Status |
| Unit |
Possible Inputs
| Metric | Input Value | Range of Values |
|---|---|---|
| Frequency | 5 | 1 – 1440 (mins) |
| Filter | ||
| Warning Operator | ||
| Warning Threshold | ||
| Warning Repeat Count | ||
| Critical Operator | EQUAL | Ends with, ==, !=, >=, <=, >, <, In Range, Out of range, Equals, Not equals, Equals Ignore Case, Not Equals Ignore Case, Contains, Not contains, Regex match, Regex no match, In string list, Not in string list, In List, Not in list, Starts with |
| Critical Threshold | 0 | [{"0":"Off"},{"1":"On"},{"-1":"Unknown"}] |
| Critical Repeat Count | 3 | 1-12 |
| Alert | Yes | Yes/No |
| Graph (Yes/No) | Yes | Yes/No |
Sample Output
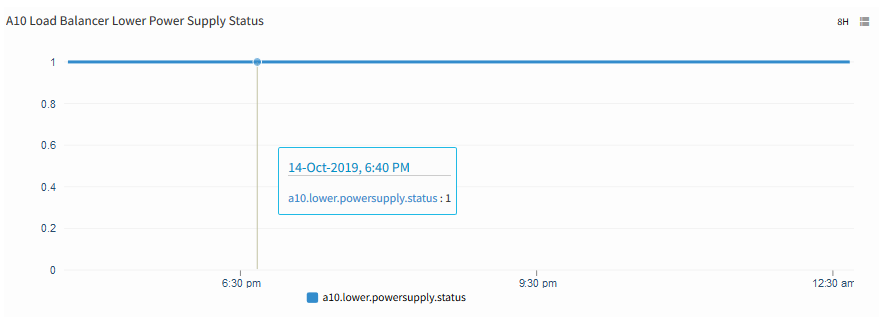
A10 Power Supply Status
a10.upper.powersupply.status
Metric Details
| Applicable for | Device |
| SNMP OID | 1.3.6.1.4.1.22610.2.4.1.5.8.0 |
| Expression | NULL |
| Description | The upper power supply status for AX. Possible status values are 0- Off, 1- On, -1- Unknown. Alert is generated when the status is equal to 0- Off, -1 - Unknown. [OID: 1.3.6.1.4.1.22610.2.4.1.5.8.0] |
| Category | SNMP monitors |
| Collector Type | Gateway |
| Monitor Name | A10 Power Supply Status |
| Unit |
Possible Inputs
| Metric | Input Value | Range of Values |
|---|---|---|
| Frequency | 5 | 1 – 1440 (mins) |
| Filter | ||
| Warning Operator | ||
| Warning Threshold | ||
| Warning Repeat Count | ||
| Critical Operator | EQUAL | Ends with, ==, !=, >=, <=, >, <, In Range, Out of range, Equals, Not equals, Equals Ignore Case, Not Equals Ignore Case, Contains, Not contains, Regex match, Regex no match, In string list, Not in string list, In List, Not in list, Starts with |
| Critical Threshold | 0 | [{"0":"Off"},{"1":"On"},{"-1":"Unknown"}] |
| Critical Repeat Count | 3 | 1-12 |
| Alert | Yes | Yes/No |
| Graph (Yes/No) | Yes | Yes/No |
Sample Output
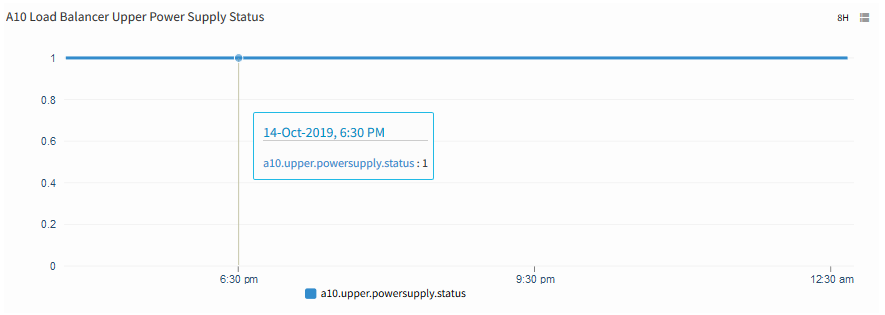
A10 Power Supply Status
a10.powersupply.voltage.status
Metric Details
| Applicable for | Device |
| SNMP OID | 1.3.6.1.4.1.22610.2.4.1.5.11.1.2 |
| Expression | NULL |
| Description | Monitors the power supply voltage status. Possible values are 0- invalid, 1- normal. [OIDs: 1.3.6.1.4.1.22610.2.4.1.5.11.1.2, 1.3.6.1.4.1.22610.2.4.1.5.11.1.3] |
| Category | SNMP monitors |
| Collector Type | Gateway |
| Monitor Name | A10 LB PS Voltage Status |
| Unit |
Possible Inputs
| Metric | Input Value | Range of Values |
|---|---|---|
| Frequency | 5 | 1 – 1440 (mins) |
| Filter | NULL | Not Applicable |
| Warning Operator | ||
| Warning Threshold | ||
| Warning Repeat Count | ||
| Critical Operator | EQUAL | Ends with, ==, !=, >=, <=, >, <, In Range, Out of range, Equals, Not equals, Equals Ignore Case, Not Equals Ignore Case, Contains, Not contains, Regex match, Regex no match, In string list, Not in string list, In List, Not in list, Starts with |
| Critical Threshold | 0 | [{"0":"invalid"},{"1":"normal"}] |
| Critical Repeat Count | 3 | 1-12 |
| Alert | Yes | Yes/No |
| Graph (Yes/No) | Yes | Yes/No |
Sample Output
No graph