Description
Applicable on the ProxySG secure web gateway appliances. Monitors CPU Utilization, Disk Utilization, Disk Status, Sensors (Temperature, Fan, Voltage, etc) status and Uptime. Also it monitors proxy statistics like HTTP-80, HTTPS-management, health check, number of objects, client request rate, etc. Validated on Blue Coat SG810 Series, Version: SGOS 6.2.12.3, Release ID: 111092 Proxy Edition (SysObjID: .1.3.6.1.4.1.3417.1.1.25).
Prerequisites
SNMP should be enabled in end device and device should support BLUECOAT-SG-DISK-MIB, BLUECOAT-SG-SENSOR-MIB, BLUECOAT-SG-USAGE-MIB, BLUECOAT-SG-PROXY-MIB OIDs and SNMP credentials should be attached against the device in portal.
How to Apply: This template is All instance selection based and Automatic select instance based. It will not ask user to select any instance (s) while assigning it to a device.
Metric Parameters
| Parameter | Description |
|---|---|
| Frequency | Warning Threshold | If the metric value satisfies the condition defined along with Warning Threshold value, then a notification is sent to the user. |
| Critical Threshold | If the metric value satisfies the condition defined along with Critical Threshold value, then a notification is sent to the user. |
| Alert | The alert value can be set to either Yes or No. If it is Yes, then an alert message is sent to the user. |
Metrics
system.uptime
Metric Details
| Applicable for | Device |
| SNMP OID | 1.3.6.1.6.3.10.2.1.3.0 |
| Expression | NULL |
| Description | The number of seconds since the value of the snmpEngineBoots object last changed. [OID : 1.3.6.1.6.3.10.2.1.3.0] |
| Category | SNMP monitors |
| Collector Type | Gateway |
| Monitor Name | SNMP Engine Uptime |
| Unit | s |
Possible Inputs
| Metric | Input Value | Range of Values |
|---|---|---|
| Frequency | 5 | 1 – 1440 (mins) |
| Filter | ||
| Warning Operator | ||
| Warning Threshold | ||
| Warning Repeat Count | ||
| Critical Operator | LESS_THAN_EQUAL | Ends with, ==, !=, >=, <=, >, <, In Range, Out of range, Equals, Not equals, Equals Ignore Case, Not Equals Ignore Case, Contains, Not contains, Regex match, Regex no match, In string list, Not in string list, In List, Not in list, Starts with |
| Critical Threshold | 1800 | 0 - 4294967295 |
| Critical Repeat Count | 1 | 1-12 |
| Alert | Yes | Yes/No |
| Graph (Yes/No) | Yes | Yes/No |
Sample Output
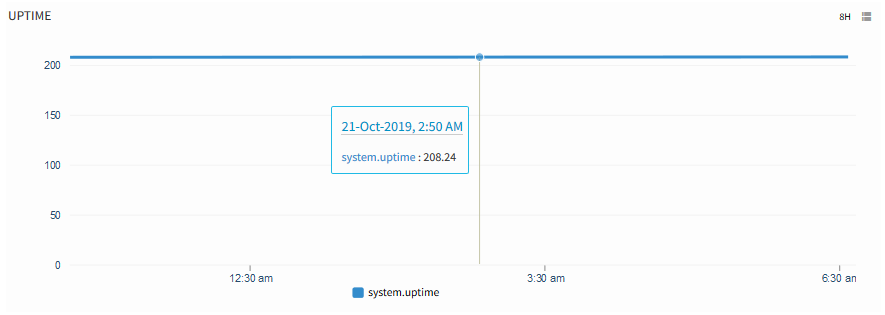
System Uptime
bluecoat.sg.disk.status
Metric Details
| Applicable for | Device |
| SNMP OID | 1.3.6.1.4.1.3417.2.2.1.1.1.1.3, 1.3.6.1.4.1.3417.2.2.1.1.1.1.5, 1.3.6.1.4.1.3417.2.2.1.1.1.1.6, 1.3.6.1.4.1.3417.2.2.1.1.1.1.8 |
| Expression | deviceDiskStatus |
| Description | Indicates the operational status of the disk.present(1) means the agent disk is operational.initializing(2) means the disk is being formatted by the device for use.inserted(3) means the disk has been inserted into the device.offline(4) means the disk has been taken offline by the system.removed(5) means the disk is being removed from the drive slot.notpresent(6) means no disk is present in drive slot.empty(7)means the drive slot is not in use.bad(8) means the drive is in an error state.unknown(9) means cannot determine disk status. [OID: 1.3.6.1.4.1.3417.2.2.1.1.1.1.3 - deviceDiskStatus] |
| Category | SNMP monitors |
| Collector Type | Gateway |
| Monitor Name | BlueCoat SG Disk Status |
| Unit |
Possible Inputs
| Metric | Input Value | Range of Values |
|---|---|---|
| Frequency | 5 | 1 – 1440 (mins) |
| Filter | deviceDiskStatus Not in list 6,7 | |
| Warning Operator | IN_LIST | Ends with, ==, !=, >=, <=, >, <, In Range, Out of range, Equals, Not equals, Equals Ignore Case, Not Equals Ignore Case, Contains, Not contains, Regex match, Regex no match, In string list, Not in string list, In List, Not in list, Starts with |
| Warning Threshold | 4,5,9 | [{"1":"present"},{"2":"initializing"},{"3":"inserted"},{"4":"offline"},{"5":"removed"},{"6":"notpresent"},{"7":"empty"},{"8":"bad"},{"9":"unknown"}] |
| Warning Repeat Count | 1 | 1-12 |
| Critical Operator | EQUAL | Ends with, ==, !=, >=, <=, >, <, In Range, Out of range, Equals, Not equals, Equals Ignore Case, Not Equals Ignore Case, Contains, Not contains, Regex match, Regex no match, In string list, Not in string list, In List, Not in list, Starts with |
| Critical Threshold | 8 | [{"1":"present"},{"2":"initializing"},{"3":"inserted"},{"4":"offline"},{"5":"removed"},{"6":"notpresent"},{"7":"empty"},{"8":"bad"},{"9":"unknown"}] |
| Critical Repeat Count | 1 | 1-12 |
| Alert | Yes | Yes/No |
| Graph (Yes/No) | Yes | Yes/No |
Sample Output
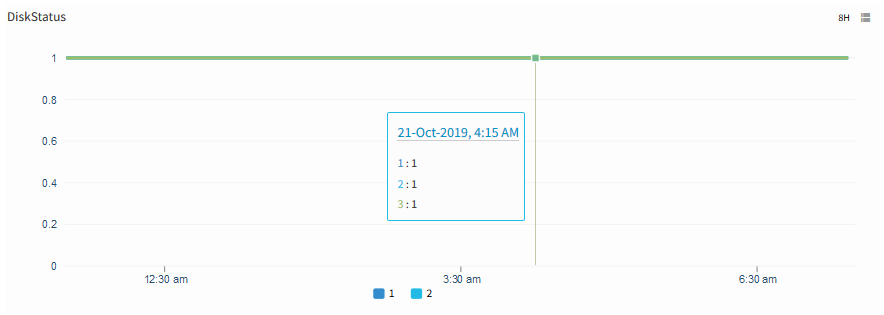
Disk Status
bluecoat.sg.cpu.utilization
Metric Details
| Applicable for | Device |
| SNMP OID | 1.3.6.1.4.1.3417.2.4.1.1.1.4.1 |
| Expression | NULL |
| Description | CPU utilization is a key performance metric. It is the percentage of time the processor spends doing work (as opposed to being idle). It can be used to track CPU performance regressions or improvements and is a useful data point for performance problem investigations [OID: 1.3.6.1.4.1.3417.2.4.1.1.1.4.1 - deviceUsagePercent.1] |
| Category | SNMP monitors |
| Collector Type | Gateway |
| Monitor Name | BlueCoat SG Performance Monitors |
| Unit | % |
Possible Inputs
| Metric | Input Value | Range of Values |
|---|---|---|
| Frequency | 5 | 1 – 1440 (mins) |
| Filter | ||
| Warning Operator | GREATER_THAN | Ends with, ==, !=, >=, <=, >, <, In Range, Out of range, Equals, Not equals, Equals Ignore Case, Not Equals Ignore Case, Contains, Not contains, Regex match, Regex no match, In string list, Not in string list, In List, Not in list, Starts with |
| Warning Threshold | 75 | 0-100 |
| Warning Repeat Count | 3 | 1-12 |
| Critical Operator | GREATER_THAN | Ends with, ==, !=, >=, <=, >, <, In Range, Out of range, Equals, Not equals, Equals Ignore Case, Not Equals Ignore Case, Contains, Not contains, Regex match, Regex no match, In string list, Not in string list, In List, Not in list, Starts with |
| Critical Threshold | 78 | 0-100 |
| Critical Repeat Count | 3 | 1-12 |
| Alert | Yes | Yes/No |
| Graph (Yes/No) | Yes | Yes/No |
Sample Output
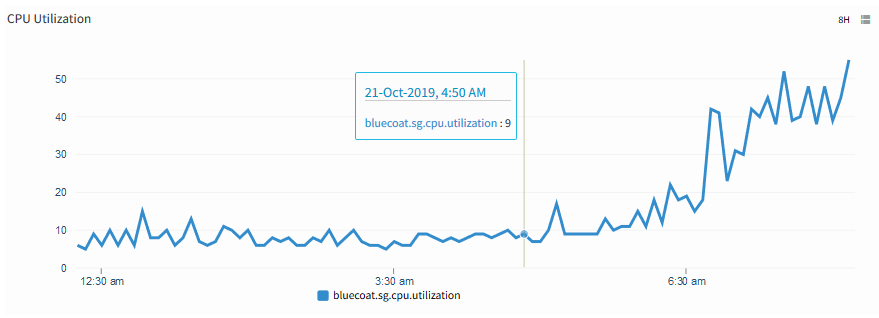
CPU Utilization
bluecoat.sg.disk.utilization
Metric Details
| Applicable for | Device |
| SNMP OID | 1.3.6.1.4.1.3417.2.4.1.1.1.4.2 |
| Expression | NULL |
| Description | Percent of resource in use. When the resource is disk, it is the amount of disk used by the cache sub system. [OID: 1.3.6.1.4.1.3417.2.4.1.1.1.4.2 - deviceUsagePercent.2] |
| Category | SNMP monitors |
| Collector Type | Gateway |
| Monitor Name | BlueCoat SG Performance Monitors |
| Unit | % |
Possible Inputs
| Metric | Input Value | Range of Values |
|---|---|---|
| Frequency | 5 | 1 – 1440 (mins) |
| Filter | ||
| Warning Operator | GREATER_THAN | Ends with, ==, !=, >=, <=, >, <, In Range, Out of range, Equals, Not equals, Equals Ignore Case, Not Equals Ignore Case, Contains, Not contains, Regex match, Regex no match, In string list, Not in string list, In List, Not in list, Starts with |
| Warning Threshold | 80 | 0-100 |
| Warning Repeat Count | 1 | 1-12 |
| Critical Operator | GREATER_THAN | Ends with, ==, !=, >=, <=, >, <, In Range, Out of range, Equals, Not equals, Equals Ignore Case, Not Equals Ignore Case, Contains, Not contains, Regex match, Regex no match, In string list, Not in string list, In List, Not in list, Starts with |
| Critical Threshold | 90 | 0-100 |
| Critical Repeat Count | 1 | 1-12 |
| Alert | Yes | Yes/No |
| Graph (Yes/No) | Yes | Yes/No |
Sample Output
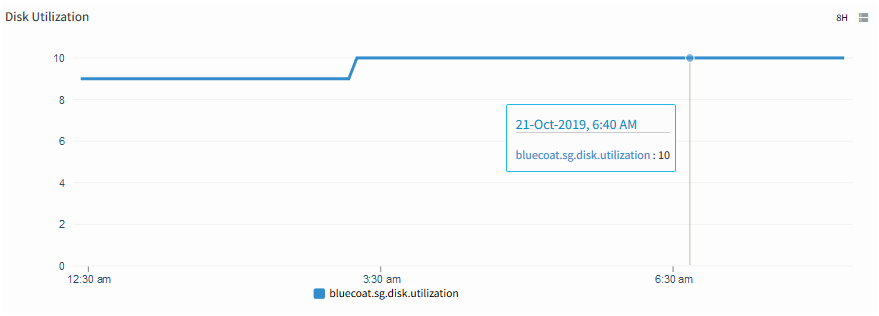
Disk Utilization
bluecoat.sg.proxy.memory.pressure
Metric Details
| Applicable for | Device |
| SNMP OID | 1.3.6.1.4.1.3417.2.11.2.3.4.0 |
| Expression | NULL |
| Description | The proportion of memory used in total by the proxy,as a percentage of the total memory available. [OID: 1.3.6.1.4.1.3417.2.11.2.3.4.0 - sgProxyMemoryPressure] |
| Category | SNMP monitors |
| Collector Type | Gateway |
| Monitor Name | BlueCoat SG Proxy Memory Pressure |
| Unit | % |
Possible Inputs
| Metric | Input Value | Range of Values |
|---|---|---|
| Frequency | 5 | 1 – 1440 (mins) |
| Filter | ||
| Warning Operator | GREATER_THAN | Ends with, ==, !=, >=, <=, >, <, In Range, Out of range, Equals, Not equals, Equals Ignore Case, Not Equals Ignore Case, Contains, Not contains, Regex match, Regex no match, In string list, Not in string list, In List, Not in list, Starts with |
| Warning Threshold | 80 | 0-100 |
| Warning Repeat Count | 3 | 1-12 |
| Critical Operator | GREATER_THAN | Ends with, ==, !=, >=, <=, >, <, In Range, Out of range, Equals, Not equals, Equals Ignore Case, Not Equals Ignore Case, Contains, Not contains, Regex match, Regex no match, In string list, Not in string list, In List, Not in list, Starts with |
| Critical Threshold | 90 | 0-100 |
| Critical Repeat Count | 3 | 1-12 |
| Alert | Yes | Yes/No |
| Graph (Yes/No) | Yes | Yes/No |
Sample Output
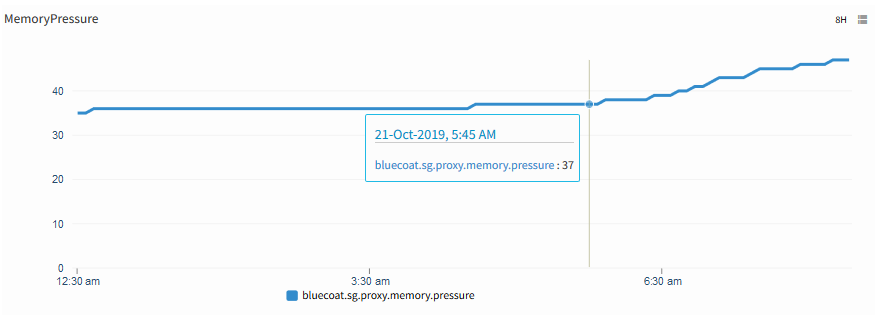
Memory Pressure
bluecoat.sg.proxy.client.hitrate
Metric Details
| Applicable for | Device |
| SNMP OID | 1.3.6.1.4.1.3417.2.11.3.1.1.7.0 |
| Expression | NULL |
| Description | Percentage HTTP hit rate (by objects) [OID: 1.3.6.1.4.1.3417.2.11.3.1.1.7.0] |
| Category | SNMP monitors |
| Collector Type | Gateway |
| Monitor Name | BlueCoat SG Proxy Statistics |
| Unit | % |
Possible Inputs
| Metric | Input Value | Range of Values |
|---|---|---|
| Frequency | 5 | 1 – 1440 (mins) |
| Filter | ||
| Warning Operator | ||
| Warning Threshold | ||
| Warning Repeat Count | ||
| Critical Operator | ||
| Critical Threshold | ||
| Critical Repeat Count | ||
| Alert | No | Yes/No |
| Graph (Yes/No) | Yes | Yes/No |
Sample Output
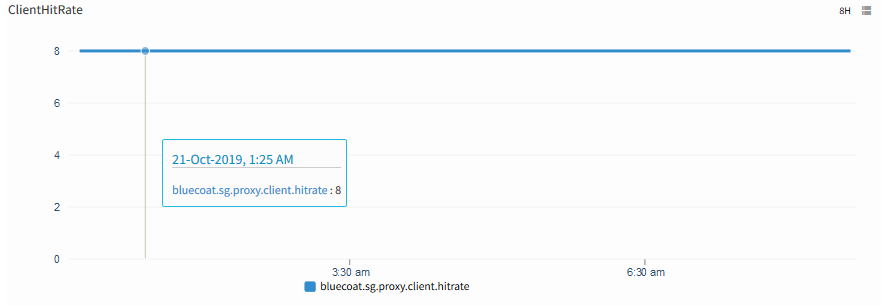
Client Hit Rate
bluecoat.sg.proxy.servicetime.hit
Metric Details
| Applicable for | Device |
| SNMP OID | 1.3.6.1.4.1.3417.2.11.3.2.1.2.0 |
| Expression | NULL |
| Description | The average service time for all HTTP hits,in milliseconds. [OID: 1.3.6.1.4.1.3417.2.11.3.2.1.2.0 - sgProxyHttpServiceTimeHit] |
| Category | SNMP monitors |
| Collector Type | Gateway |
| Monitor Name | BlueCoat SG Proxy Statistics |
| Unit | ms |
Possible Inputs
| Metric | Input Value | Range of Values |
|---|---|---|
| Frequency | 5 | 1 – 1440 (mins) |
| Filter | ||
| Warning Operator | ||
| Warning Threshold | ||
| Warning Repeat Count | ||
| Critical Operator | ||
| Critical Threshold | ||
| Critical Repeat Count | ||
| Alert | No | Yes/No |
| Graph (Yes/No) | Yes | Yes/No |
Sample Output
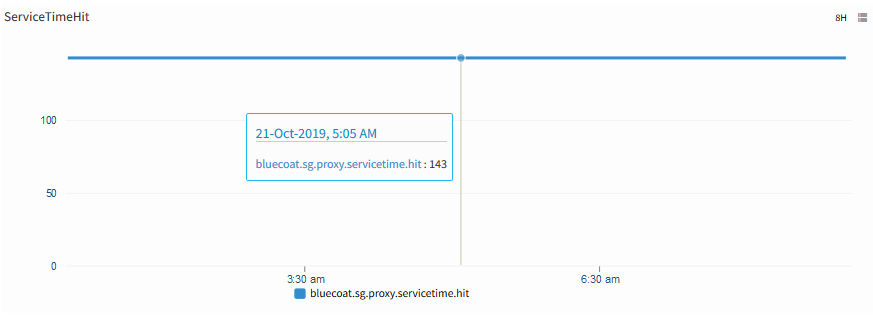
Service Time Hit
bluecoat.sg.proxy.client.connections.active
Metric Details
| Applicable for | Device |
| SNMP OID | 1.3.6.1.4.1.3417.2.11.3.1.3.2.0 |
| Expression | NULL |
| Description | The number of active HTTP connections with the proxy clients. [OID: 1.3.6.1.4.1.3417.2.11.3.1.3.2.0 - sgProxyHttpClientConnectionsActive] |
| Category | SNMP monitors |
| Collector Type | Gateway |
| Monitor Name | BlueCoat SG Proxy Statistics |
| Unit |
Possible Inputs
| Metric | Input Value | Range of Values |
|---|---|---|
| Frequency | 5 | 1 – 1440 (mins) |
| Filter | ||
| Warning Operator | ||
| Warning Threshold | ||
| Warning Repeat Count | ||
| Critical Operator | ||
| Critical Threshold | ||
| Critical Repeat Count | ||
| Alert | No | Yes/No |
| Graph (Yes/No) | Yes | Yes/No |
Sample Output
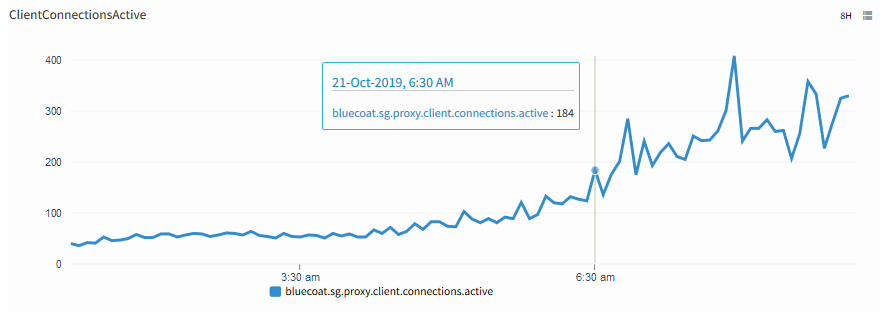
Client Connections Active
bluecoat.sg.proxy.servicetime.all
Metric Details
| Applicable for | Device |
| SNMP OID | 1.3.6.1.4.1.3417.2.11.3.2.1.1.0 |
| Expression | NULL |
| Description | The average service time for all HTTP requests, in milliseconds. [OID: 1.3.6.1.4.1.3417.2.11.3.2.1.1.0 - sgProxyHttpServiceTimeAll] |
| Category | SNMP monitors |
| Collector Type | Gateway |
| Monitor Name | BlueCoat SG Proxy Statistics |
| Unit | ms |
Possible Inputs
| Metric | Input Value | Range of Values |
|---|---|---|
| Frequency | 5 | 1 – 1440 (mins) |
| Filter | ||
| Warning Operator | ||
| Warning Threshold | ||
| Warning Repeat Count | ||
| Critical Operator | ||
| Critical Threshold | ||
| Critical Repeat Count | ||
| Alert | No | Yes/No |
| Graph (Yes/No) | Yes | Yes/No |
Sample Output
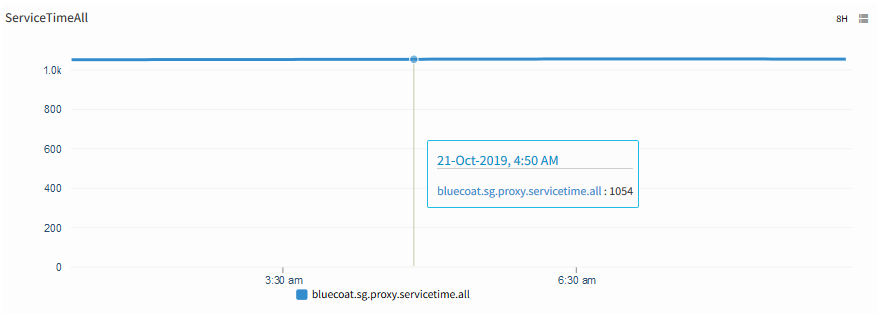
Service Time All
bluecoat.sg.proxy.servicetime.miss
Metric Details
| Applicable for | Device |
| SNMP OID | 1.3.6.1.4.1.3417.2.11.3.2.1.4.0 |
| Expression | NULL |
| Description | The average service time for all HTTP misses, in milliseconds. [OID: 1.3.6.1.4.1.3417.2.11.3.2.1.4.0 - sgProxyHttpServiceTimeMiss] |
| Category | SNMP monitors |
| Collector Type | Gateway |
| Monitor Name | BlueCoat SG Proxy Statistics |
| Unit | ms |
Possible Inputs
| Metric | Input Value | Range of Values |
|---|---|---|
| Frequency | 5 | 1 – 1440 (mins) |
| Filter | ||
| Warning Operator | ||
| Warning Threshold | ||
| Warning Repeat Count | ||
| Critical Operator | ||
| Critical Threshold | ||
| Critical Repeat Count | ||
| Alert | No | Yes/No |
| Graph (Yes/No) | Yes | Yes/No |
Sample Output
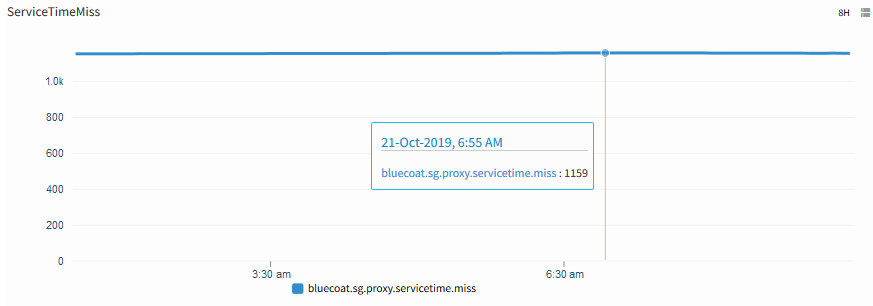
Service Time Miss
bluecoat.sg.proxy.median.servicetime.hit
Metric Details
| Applicable for | Device |
| SNMP OID | 1.3.6.1.4.1.3417.2.11.3.3.1.1.3.5 |
| Expression | NULL |
| Description | The median service time for all HTTP hits, in milliseconds. [OID: 1.3.6.1.4.1.3417.2.11.3.3.1.1.3.5 - sgProxyHttpMedianServiceTimeHit.5] |
| Category | SNMP monitors |
| Collector Type | Gateway |
| Monitor Name | BlueCoat SG Proxy Statistics |
| Unit | ms |
Possible Inputs
| Metric | Input Value | Range of Values |
|---|---|---|
| Frequency | 5 | 1 – 1440 (mins) |
| Filter | ||
| Warning Operator | ||
| Warning Threshold | ||
| Warning Repeat Count | ||
| Critical Operator | ||
| Critical Threshold | ||
| Critical Repeat Count | ||
| Alert | No | Yes/No |
| Graph (Yes/No) | Yes | Yes/No |
Sample Output
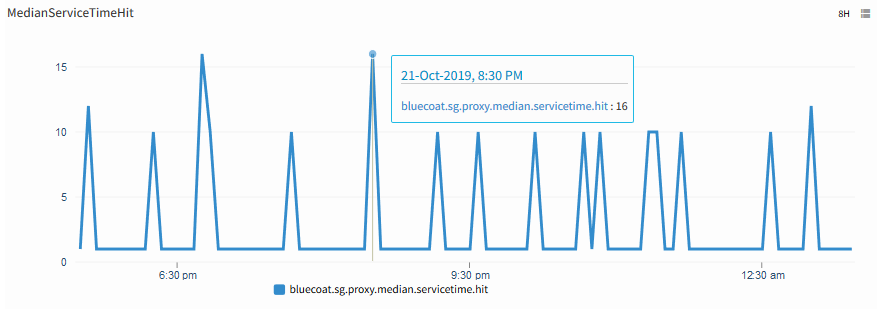
Median Service Time Hit
bluecoat.sg.proxy.median.servicetime.dns
Metric Details
| Applicable for | Device |
| SNMP OID | 1.3.6.1.4.1.3417.2.11.3.3.1.1.6.5 |
| Expression | NULL |
| Description | The median DNS service time, in milliseconds. [OID: 1.3.6.1.4.1.3417.2.11.3.3.1.1.6.5 - sgProxyDnsMedianServiceTime.5] |
| Category | SNMP monitors |
| Collector Type | Gateway |
| Monitor Name | BlueCoat SG Proxy Statistics |
| Unit | ms |
Possible Inputs
| Metric | Input Value | Range of Values |
|---|---|---|
| Frequency | 5 | 1 – 1440 (mins) |
| Filter | ||
| Warning Operator | ||
| Warning Threshold | ||
| Warning Repeat Count | ||
| Critical Operator | ||
| Critical Threshold | ||
| Critical Repeat Count | ||
| Alert | No | Yes/No |
| Graph (Yes/No) | Yes | Yes/No |
Sample Output
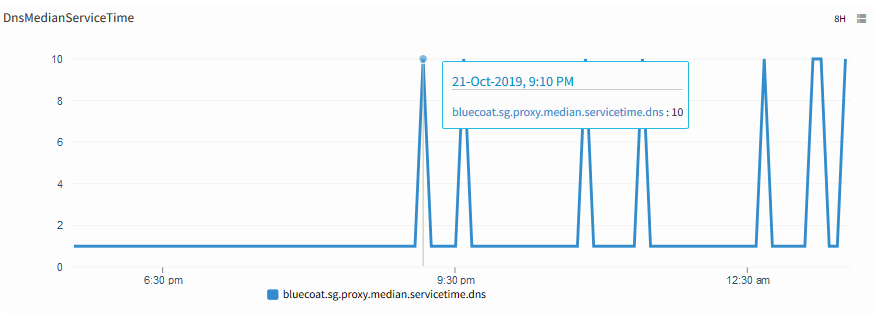
DNS Median Service Time
bluecoat.sg.proxy.server.connections
Metric Details
| Applicable for | Device |
| SNMP OID | 1.3.6.1.4.1.3417.2.11.3.1.3.4.0 |
| Expression | NULL |
| Description | The total number of HTTP connections with remote servers. [OID: 1.3.6.1.4.1.3417.2.11.3.1.3.4.0 - sgProxyHttpServerConnections] |
| Category | SNMP monitors |
| Collector Type | Gateway |
| Monitor Name | BlueCoat SG Proxy Statistics |
| Unit |
Possible Inputs
| Metric | Input Value | Range of Values |
|---|---|---|
| Frequency | 5 | 1 – 1440 (mins) |
| Filter | ||
| Warning Operator | ||
| Warning Threshold | ||
| Warning Repeat Count | ||
| Critical Operator | ||
| Critical Threshold | ||
| Critical Repeat Count | ||
| Alert | No | Yes/No |
| Graph (Yes/No) | Yes | Yes/No |
Sample Output
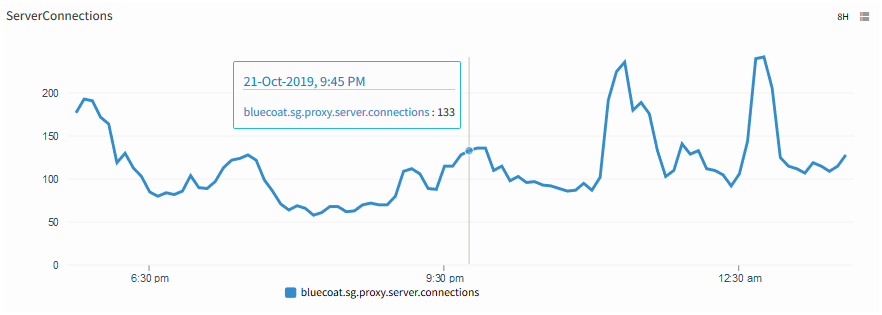
Server Connections
bluecoat.sg.proxy.client.connections.idle
Metric Details
| Applicable for | Device |
| SNMP OID | 1.3.6.1.4.1.3417.2.11.3.1.3.3.0 |
| Expression | NULL |
| Description | The number of idle HTTP connections with the proxy clients. [OID: 1.3.6.1.4.1.3417.2.11.3.1.3.3.0 - sgProxyHttpClientConnectionsIdle] |
| Category | SNMP monitors |
| Collector Type | Gateway |
| Monitor Name | BlueCoat SG Proxy Statistics |
| Unit |
Possible Inputs
| Metric | Input Value | Range of Values |
|---|---|---|
| Frequency | 5 | 1 – 1440 (mins) |
| Filter | ||
| Warning Operator | ||
| Warning Threshold | ||
| Warning Repeat Count | ||
| Critical Operator | ||
| Critical Threshold | ||
| Critical Repeat Count | ||
| Alert | No | Yes/No |
| Graph (Yes/No) | Yes | Yes/No |
Sample Output
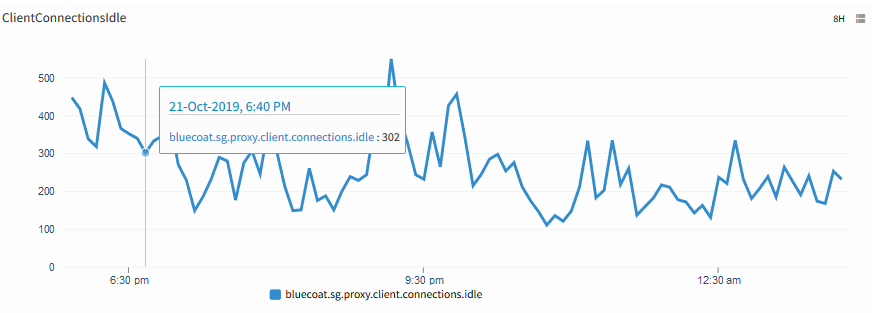
Client Connections Idle
bluecoat.sg.proxy.median.servicetime.all
Metric Details
| Applicable for | Device |
| SNMP OID | 1.3.6.1.4.1.3417.2.11.3.3.1.1.2.5 |
| Expression | NULL |
| Description | The median service time for all HTTP requests, in milliseconds. [OID: 1.3.6.1.4.1.3417.2.11.3.3.1.1.2.5 - sgProxyHttpMedianServiceTimeAll.5] |
| Category | SNMP monitors |
| Collector Type | Gateway |
| Monitor Name | BlueCoat SG Proxy Statistics |
| Unit | ms |
Possible Inputs
| Metric | Input Value | Range of Values |
|---|---|---|
| Frequency | 5 | 1 – 1440 (mins) |
| Filter | ||
| Warning Operator | ||
| Warning Threshold | ||
| Warning Repeat Count | ||
| Critical Operator | ||
| Critical Threshold | ||
| Critical Repeat Count | ||
| Alert | No | Yes/No |
| Graph (Yes/No) | Yes | Yes/No |
Sample Output
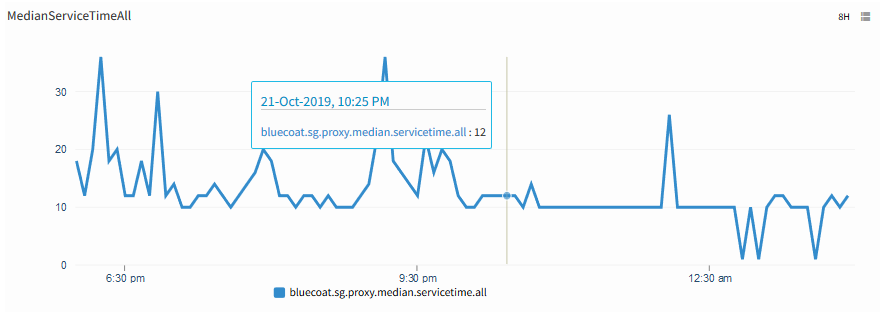
Median Service Time All
bluecoat.sg.proxy.client.byte.hitrate
Metric Details
| Applicable for | Device |
| SNMP OID | 1.3.6.1.4.1.3417.2.11.3.1.1.8.0 |
| Expression | NULL |
| Description | The percentage HTTP hit rate (by requested bytes). This is the number of bytes returned to the client for hits, as a fraction of the total bytes. [OID: 1.3.6.1.4.1.3417.2.11.3.1.1.8.0 - sgProxyHttpClientByteHitRate] |
| Category | SNMP monitors |
| Collector Type | Gateway |
| Monitor Name | BlueCoat SG Proxy Statistics |
| Unit | % |
Possible Inputs
| Metric | Input Value | Range of Values |
|---|---|---|
| Frequency | 5 | 1 – 1440 (mins) |
| Filter | ||
| Warning Operator | ||
| Warning Threshold | ||
| Warning Repeat Count | ||
| Critical Operator | ||
| Critical Threshold | ||
| Critical Repeat Count | ||
| Alert | No | Yes/No |
| Graph (Yes/No) | Yes | Yes/No |
Sample Output
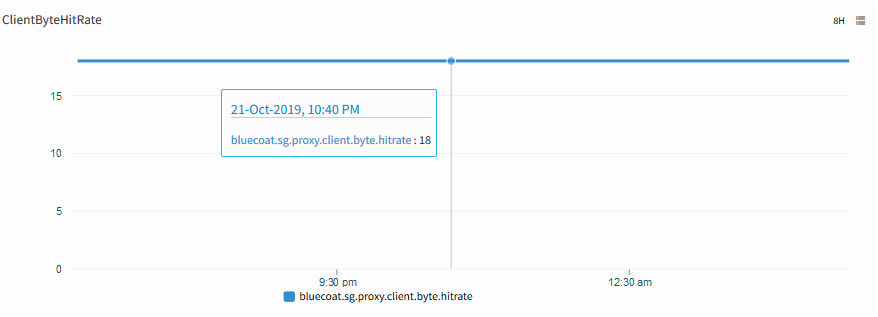
Client Byte Hit Rate
bluecoat.sg.proxy.server.connections.idle
Metric Details
| Applicable for | Device |
| SNMP OID | 1.3.6.1.4.1.3417.2.11.3.1.3.6.0 |
| Expression | NULL |
| Description | The total number of idle HTTP connections with remote servers. [OID: 1.3.6.1.4.1.3417.2.11.3.1.3.6.0 - sgProxyHttpServerConnectionsIdle] |
| Category | SNMP monitors |
| Collector Type | Gateway |
| Monitor Name | BlueCoat SG Proxy Statistics |
| Unit |
Possible Inputs
| Metric | Input Value | Range of Values |
|---|---|---|
| Frequency | 5 | 1 – 1440 (mins) |
| Filter | ||
| Warning Operator | ||
| Warning Threshold | ||
| Warning Repeat Count | ||
| Critical Operator | ||
| Critical Threshold | ||
| Critical Repeat Count | ||
| Alert | No | Yes/No |
| Graph (Yes/No) | Yes | Yes/No |
Sample Output
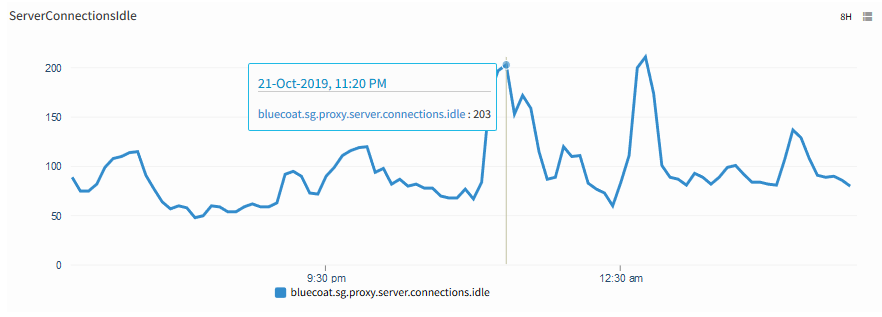
Server Connections Idle
bluecoat.sg.proxy.client.request.rate
Metric Details
| Applicable for | Device |
| SNMP OID | 1.3.6.1.4.1.3417.2.11.3.1.1.6.0 |
| Expression | NULL |
| Description | Describes the average rate per second of HTTP requests. [OID: 1.3.6.1.4.1.3417.2.11.3.1.1.6.0 - sgProxyHttpClientRequestRate] |
| Category | SNMP monitors |
| Collector Type | Gateway |
| Monitor Name | BlueCoat SG Proxy Statistics |
| Unit | Req per Sec |
Possible Inputs
| Metric | Input Value | Range of Values |
|---|---|---|
| Frequency | 5 | 1 – 1440 (mins) |
| Filter | ||
| Warning Operator | ||
| Warning Threshold | ||
| Warning Repeat Count | ||
| Critical Operator | ||
| Critical Threshold | ||
| Critical Repeat Count | ||
| Alert | No | Yes/No |
| Graph (Yes/No) | Yes | Yes/No |
Sample Output
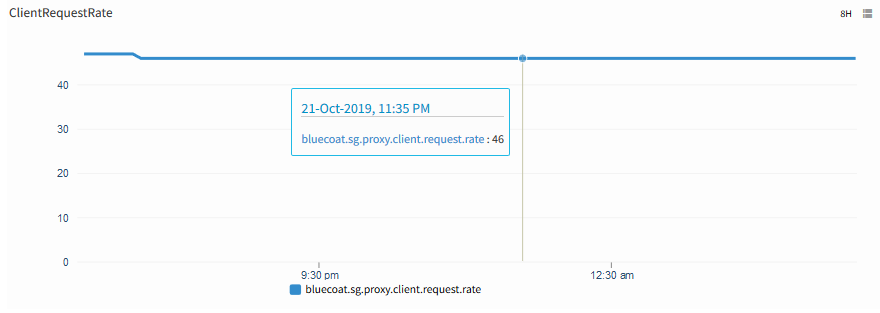
Client Request Rate
bluecoat.sg.proxy.objects.count
Metric Details
| Applicable for | Device |
| SNMP OID | 1.3.6.1.4.1.3417.2.11.2.2.2.0 |
| Expression | NULL |
| Description | The number of objects currently held by the proxy. [OID: 1.3.6.1.4.1.3417.2.11.2.2.2.0 - sgProxyNumObjects] |
| Category | SNMP monitors |
| Collector Type | Gateway |
| Monitor Name | BlueCoat SG Proxy Statistics |
| Unit |
Possible Inputs
| Metric | Input Value | Range of Values |
|---|---|---|
| Frequency | 5 | 1 – 1440 (mins) |
| Filter | ||
| Warning Operator | ||
| Warning Threshold | ||
| Warning Repeat Count | ||
| Critical Operator | ||
| Critical Threshold | ||
| Critical Repeat Count | ||
| Alert | No | Yes/No |
| Graph (Yes/No) | Yes | Yes/No |
Sample Output
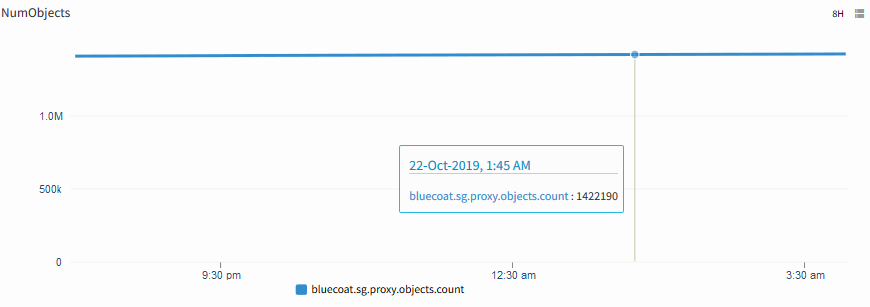
Number of Objects
bluecoat.sg.proxy.servicetime.partialhit
Metric Details
| Applicable for | Device |
| SNMP OID | 1.3.6.1.4.1.3417.2.11.3.2.1.3.0 |
| Expression | NULL |
| Description | The average service time for all HTTP partial (near) requests, in milliseconds. [OID: 1.3.6.1.4.1.3417.2.11.3.2.1.3.0 - sgProxyHttpServiceTimePartialHit] |
| Category | SNMP monitors |
| Collector Type | Gateway |
| Monitor Name | BlueCoat SG Proxy Statistics |
| Unit | ms |
Possible Inputs
| Metric | Input Value | Range of Values |
|---|---|---|
| Frequency | 5 | 1 – 1440 (mins) |
| Filter | ||
| Warning Operator | ||
| Warning Threshold | ||
| Warning Repeat Count | ||
| Critical Operator | ||
| Critical Threshold | ||
| Critical Repeat Count | ||
| No | Yes/No | |
| Graph (Yes/No) | Yes | Yes/No |
Sample Output
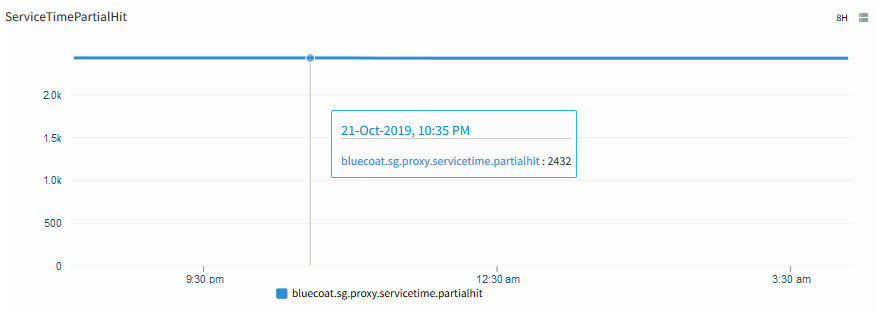
Service Time Partial Hit
bluecoat.sg.proxy.median.servicetime.miss
Metric Details
| Applicable for | Device |
| SNMP OID | 1.3.6.1.4.1.3417.2.11.3.3.1.1.5.5 |
| Expression | NULL |
| Description | The median service time for all HTTP misses, in milliseconds. [OID: 1.3.6.1.4.1.3417.2.11.3.3.1.1.5.5 - sgProxyHttpMedianServiceTimeMiss.5] |
| Category | SNMP monitors |
| Collector Type | Gateway |
| Monitor Name | BlueCoat SG Proxy Statistics |
| Unit | ms |
Possible Inputs
| Metric | Input Value | Range of Values |
|---|---|---|
| Frequency | 5 | 1 – 1440 (mins) |
| Filter | ||
| Warning Operator | ||
| Warning Threshold | ||
| Warning Repeat Count | ||
| Critical Operator | ||
| Critical Threshold | ||
| Critical Repeat Count | ||
| Alert | No | Yes/No |
| Graph (Yes/No) | Yes | Yes/No |
Sample Output
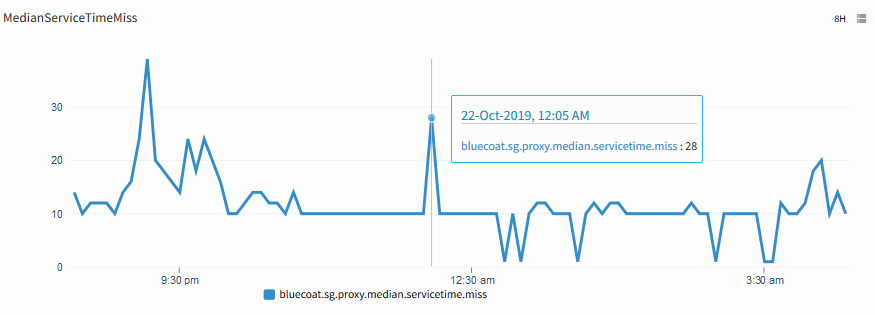
Median Service Time Miss
bluecoat.sg.proxy.client.connections
Metric Details
| Applicable for | Device |
| SNMP OID | 1.3.6.1.4.1.3417.2.11.3.1.3.1.0 |
| Expression | NULL |
| Description | The total number of HTTP connections with the proxy clients. [OID: 1.3.6.1.4.1.3417.2.11.3.1.3.1.0 - sgProxyHttpClientConnections] |
| Category | SNMP monitors |
| Collector Type | Gateway |
| Monitor Name | BlueCoat SG Proxy Statistics |
| Unit |
Possible Inputs
| Metric | Input Value | Range of Values |
|---|---|---|
| Frequency | 5 | 1 – 1440 (mins) |
| Filter | ||
| Warning Operator | ||
| Warning Threshold | ||
| Warning Repeat Count | ||
| Critical Operator | ||
| Critical Threshold | ||
| Critical Repeat Count | ||
| Alert | No | Yes/No |
| Graph (Yes/No) | Yes | Yes/No |
Sample Output
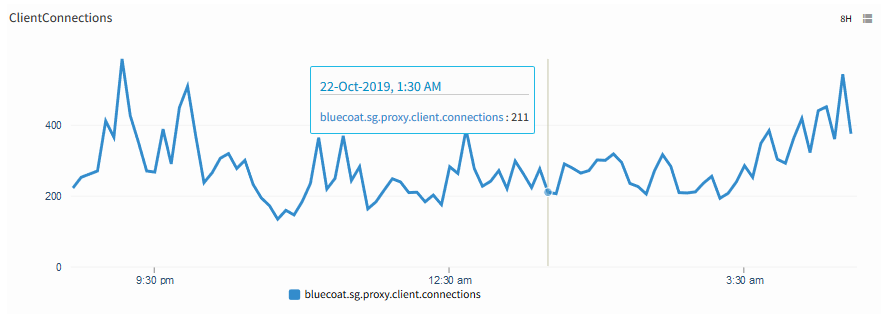
Client Connections
bluecoat.sg.proxy.server.connections.active
Metric Details
| Applicable for | Device |
| SNMP OID | 1.3.6.1.4.1.3417.2.11.3.1.3.5.0 |
| Expression | NULL |
| Description | The total number of active HTTP connections with remote servers. [OID: 1.3.6.1.4.1.3417.2.11.3.1.3.5.0 - sgProxyHttpServerConnectionsActive] |
| Category | SNMP monitors |
| Collector Type | Gateway |
| Monitor Name | BlueCoat SG Proxy Statistics |
| Unit |
Possible Inputs
| Metric | Input Value | Range of Values |
|---|---|---|
| Frequency | 5 | 1 – 1440 (mins) |
| Filter | ||
| Warning Operator | ||
| Warning Threshold | ||
| Warning Repeat Count | ||
| Critical Operator | ||
| Critical Threshold | ||
| Critical Repeat Count | ||
| Alert | No | Yes/No |
| Graph (Yes/No) | Yes | Yes/No |
Sample Output
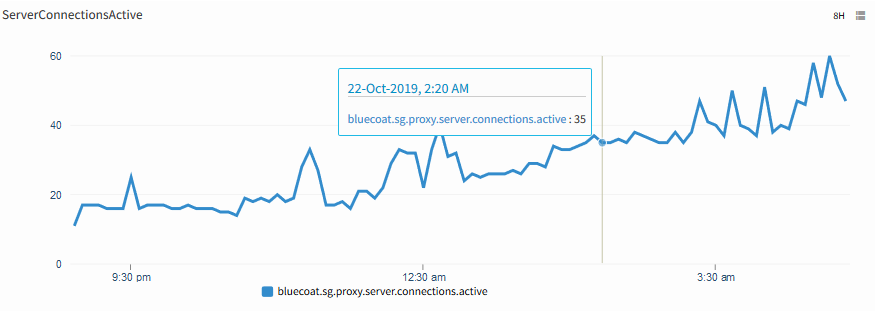
Server Connections Active
bluecoat.sg.proxy.median.servicetime.partialhit
Metric Details
| Applicable for | Device |
| SNMP OID | 1.3.6.1.4.1.3417.2.11.3.3.1.1.4.5 |
| Expression | NULL |
| Description | The median service time for all HTTP partial (near) hits, in milliseconds. [OID: 1.3.6.1.4.1.3417.2.11.3.3.1.1.4.5 - sgProxyHttpMedianServiceTimePartialHit.5] |
| Category | SNMP monitors |
| Collector Type | Gateway |
| Monitor Name | BlueCoat SG Proxy Statistics |
| Unit | ms |
Possible Inputs
| Metric | Input Value | Range of Values |
|---|---|---|
| Frequency | 5 | 1 – 1440 (mins) |
| Filter | ||
| Warning Operator | ||
| Warning Threshold | ||
| Warning Repeat Count | ||
| Critical Operator | ||
| Critical Threshold | ||
| Critical Repeat Count | ||
| Alert | No | Yes/No |
| Graph (Yes/No) | Yes | Yes/No |
Sample Output
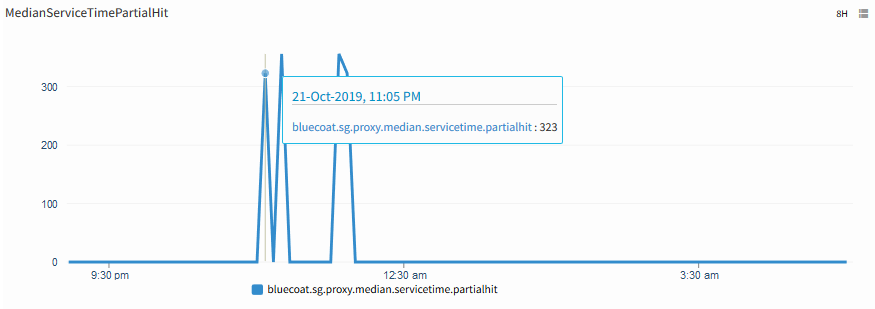
Median Service Time Partial Hit
bluecoat.sg.sensor.status
Metric Details
| Applicable for | Device |
| SNMP OID | 1.3.6.1.4.1.3417.2.1.1.1.1.1.7 |
| Expression | NULL |
| Description | Indicates the operational status of the sensor. Possible values are - ok(1) means the agent can read the sensor value. unavailable(2) means that the agent presently cannot report the sensor value. nonoperational(3) means that the sensor is broken. [OIDs: 1.3.6.1.4.1.3417.2.1.1.1.1.1.7, 1.3.6.1.4.1.3417.2.1.1.1.1.1.9] |
| Category | SNMP monitors |
| Collector Type | Gateway |
| Monitor Name | BlueCoat SG Sensor Status |
| Unit |
Possible Inputs
| Metric | Input Value | Range of Values |
|---|---|---|
| Frequency | 5 | 1 – 1440 (mins) |
| Filter | NULL | Not Applicable |
| Warning Operator | ||
| Warning Threshold | ||
| Warning Repeat Count | ||
| Critical Operator | EQUAL | Ends with, ==, !=, >=, <=, >, <, In Range, Out of range, Equals, Not equals, Equals Ignore Case, Not Equals Ignore Case, Contains, Not contains, Regex match, Regex no match, In string list, Not in string list, In List, Not in list, Starts with |
| Critical Threshold | 3 | [{"1":"ok"},{"2":"unavailable"},{"3":"nonoperational"}] |
| Critical Repeat Count | 1 | 1-12 |
| Alert | Yes | Yes/No |
| Graph (Yes/No) | Yes | Yes/No |
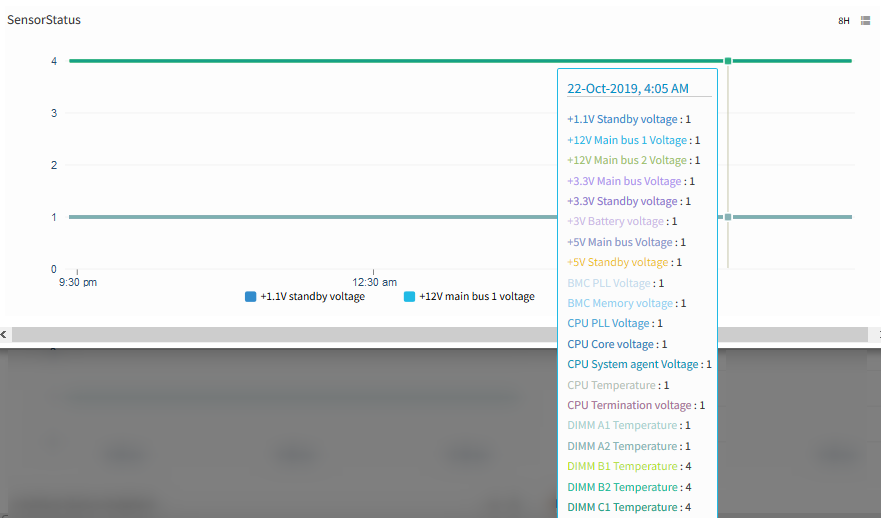
Sample Output