Description
Template for Cisco Firewalls like ASA and PIX. Monitors both connections and URL processing parameters like connection set up rate, url drop rate, url processing rate, UDP connections rate, TCP connections rate and URL requests denied rate.
Prerequisites
SNMP should be enabled in end device and device should support CISCO-UNIFIED-FIREWALL-MIB OIDs and SNMP credentials should be attached against the device in portal.
Metric Parameters
| Parameter | Description |
|---|---|
| Frequency | |
| Warning Threshold | If the metric value satisfies the condition defined along with Warning Threshold value, then a notification is sent to the user. |
| Critical Threshold | If the metric value satisfies the condition defined along with Critical Threshold value, then a notification is sent to the user. |
| Alert | The alert value can be set to either Yes or No. If it is Yes, then an alert message is sent to the user. |
Metrics
fw.udp.conn.rate
Metric Details
| Applicable for | Device |
| SNMP OID | 1.3.6.1.4.1.9.9.491.1.1.4.1.1.10.6 |
| Expression | NULL |
| Description | The connection setup rate averaged over the last 300 seconds. [OID: 1.3.6.1.4.1.9.9.491.1.1.4.1.1.10.6] |
| Category | SNMP monitors |
| Collector Type | Gateway |
| Monitor Name | Cisco Firewall Connection Statistics |
| Unit | psec |
Possible Inputs
| Metric | Input Value | Range of Values |
|---|---|---|
| Frequency | 5 | 1 – 1440 (mins) |
| Filter | ||
| Warning Operator | ||
| Warning Threshold | ||
| Warning Repeat Count | ||
| Critical Operator | ||
| Critical Threshold | ||
| Critical Repeat Count | ||
| Alert | No | Yes/No |
| Graph (Yes/No) | Yes | Yes/No |
Note: As Alert is not enabled on the above metric, the fields are left blank.
Sample Output
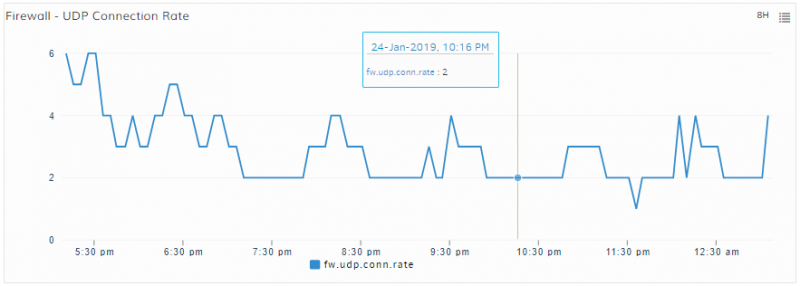
Firewall - UDP Connection Rate
fw.tcp.conn.rate
Metric Details
| Applicable for | Device |
| SNMP OID | 1.3.6.1.4.1.9.9.491.1.1.4.1.1.10.7 |
| Expression | NULL |
| Description | The connection setup rate averaged over the last 300 seconds. [OID: 1.3.6.1.4.1.9.9.491.1.1.4.1.1.10.7] |
| Category | SNMP monitors |
| Collector Type | Gateway |
| Monitor Name | Cisco Firewall Connection Statistics |
| Unit | psec |
Possible Inputs
| Metric | Input Value | Range of Values |
|---|---|---|
| Frequency | 5 | 1 – 1440 (mins) |
| Filter | ||
| Warning Operator | ||
| Warning Threshold | ||
| Warning Repeat Count | ||
| Critical Operator | ||
| Critical Threshold | ||
| Critical Repeat Count | ||
| Alert | No | Yes/No |
| Graph (Yes/No) | Yes | Yes/No |
Note: As Alert is not enabled on the above metric, the fields are left blank.
Sample Output
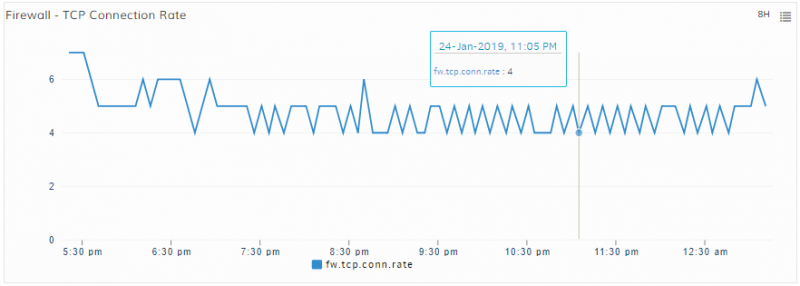
Firewall - TCP Connection Rate
fw.conn.setup.rate
Metric Details
| Applicable for | Device |
| SNMP OID | 1.3.6.1.4.1.9.9.491.1.1.1.11.0 |
| Expression | NULL |
| Description | The averaged number of connections which the firewall establishing per second, averaged over the last 300 seconds. [OID: 1.3.6.1.4.1.9.9.491.1.1.1.11.0] |
| Category | SNMP monitors |
| Collector Type | Gateway |
| Monitor Name | Cisco Firewall Connection Statistics |
| Unit | psec |
Possible Inputs
| Metric | Input Value | Range of Values |
|---|---|---|
| Frequency | 5 | 1 – 1440 (mins) |
| Filter | ||
| Warning Operator | ||
| Warning Threshold | ||
| Warning Repeat Count | ||
| Critical Operator | ||
| Critical Threshold | ||
| Critical Repeat Count | ||
| Alert | No | Yes/No |
| Graph (Yes/No) | Yes | Yes/No |
Note: As Alert is not enabled on the above metric, the fields are left blank.
Sample Output
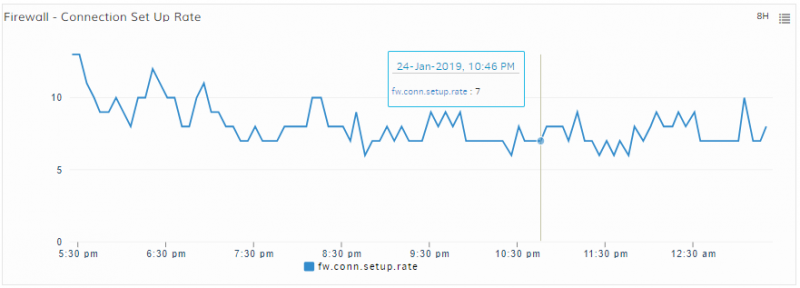
Firewall - Connection Set Up Rate
fw.url.drop.rate
Metric Details
| Applicable for | Device |
| SNMP OID | 1.3.6.1.4.1.9.9.491.1.3.1.15.0 |
| Expression | NULL |
| Description | The rate at which incoming URL access requests were dropped by the firewall because of resource constraints, averaged over the last 300 seconds. [OID: 1.3.6.1.4.1.9.9.491.1.3.1.15.0] |
| Category | SNMP monitors |
| Collector Type | Gateway |
| Monitor Name | Cisco Firewall Connection Statistics |
| Unit | psec |
Possible Inputs
| Metric | Input Value | Range of Values |
|---|---|---|
| Frequency | 5 | 1 – 1440 (mins) |
| Filter | ||
| Warning Operator | ||
| Warning Threshold | ||
| Warning Repeat Count | ||
| Critical Operator | ||
| Critical Threshold | ||
| Critical Repeat Count | ||
| Alert | No | Yes/No |
| Graph (Yes/No) | Yes | Yes/No |
Note: As Alert is not enabled on the above metric, the fields are left blank.
Sample Output
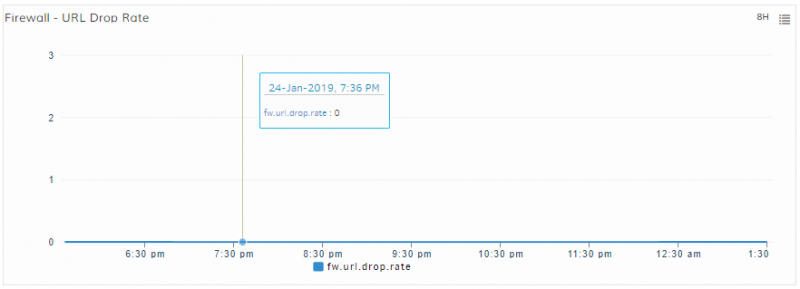
Firewall - URL Drop Rate
fw.url.processing.rate
Metric Details
| Applicable for | Device |
| SNMP OID | 1.3.6.1.4.1.9.9.491.1.3.1.4.0 |
| Expression | NULL |
| Description | The number of URL access requests processed per second by this firewall. [OID: 1.3.6.1.4.1.9.9.491.1.3.1.4.0] |
| Category | SNMP monitors |
| Collector Type | Gateway |
| Monitor Name | Cisco Firewall Connection Statistics |
| Unit | psec |
Possible Inputs
| Metric | Input Value | Range of Values |
|---|---|---|
| Frequency | 5 | 1 – 1440 (mins) |
| Filter | ||
| Warning Operator | ||
| Warning Threshold | ||
| Warning Repeat Count | ||
| Critical Operator | ||
| Critical Threshold | ||
| Critical Repeat Count | ||
| Alert | No | Yes/No |
| Graph (Yes/No) | Yes | Yes/No |
Note: As Alert is not enabled on the above metric, the fields are left blank.
Sample Output
Firewall - URL Processing Rate
fw.url.requests.denied.rate
Metric Details
| Applicable for | Device |
| SNMP OID | 1.3.6.1.4.1.9.9.491.1.3.1.8 |
| Expression | NULL |
| Description | The rate at which URL access requests were denied by this firewall, due to a directive from a URL filtering server, a static policy configured on the firewall, due to resource constraints or any other reason, averaged over the last 300 seconds. [OID: 1.3.6.1.4.1.9.9.491.1.3.1.8] |
| Category | SNMP monitors |
| Collector Type | Gateway |
| Monitor Name | Cisco Firewall Connection Statistics |
| Unit | psec |
Possible Inputs
| Metric | Input Value | Range of Values |
|---|---|---|
| Frequency | 5 | 1 – 1440 (mins) |
| Filter | ||
| Warning Operator | ||
| Warning Threshold | ||
| Warning Repeat Count | ||
| Critical Operator | ||
| Critical Threshold | ||
| Critical Repeat Count | ||
| Alert | No | Yes/No |
| Graph (Yes/No) | Yes | Yes/No |
Note: As Alert is not enabled on the above metric, the fields are left blank.
Sample Output
Firewall - Requests Denied Rate
fw.conn.active
Metric Details
| Applicable for | Device |
| SNMP OID | 1.3.6.1.4.1.9.9.491.1.1.1.6.0 |
| Expression | NULL |
| Description | Monitors the number of connections which are currently active. [OID: 1.3.6.1.4.1.9.9.491.1.1.1.6.0] |
| Category | SNMP monitors |
| Collector Type | Gateway |
| Monitor Name | Cisco Firewall Active Connections |
| Unit | psec |
Possible Inputs
| Metric | Input Value | Range of Values |
|---|---|---|
| Frequency | 5 | 1 – 1440 (mins) |
| Filter | ||
| Warning Operator | ||
| Warning Threshold | ||
| Warning Repeat Count | ||
| Critical Operator | ||
| Critical Threshold | ||
| Critical Repeat Count | ||
| Alert | No | Yes/No |
| Graph (Yes/No) | Yes | Yes/No |
Note: As Alert is not enabled on the above metric, the fields are left blank.
Sample Output
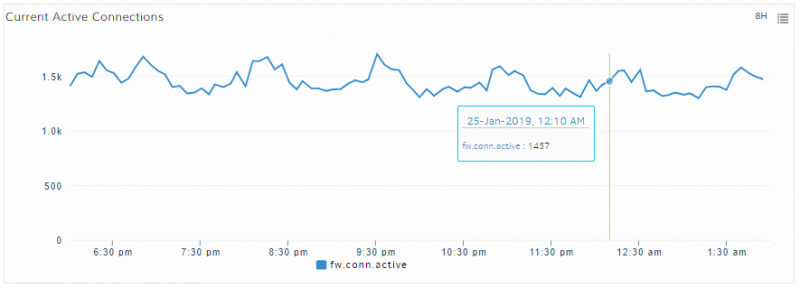
Current Active Connections
fw.conn.attempted
Metric Details
| Applicable for | Device |
| SNMP OID | 1.3.6.1.4.1.9.9.491.1.1.1.1.0 |
| Expression | NULL |
| Description | Monitors the the number of connections which are attempted to be set up through the firewall. [OID: 1.3.6.1.4.1.9.9.491.1.1.1.1.0] |
| Category | SNMP monitors |
| Collector Type | Gateway |
| Monitor Name | Cisco Firewall Additional Connection Stats |
| Unit | psec |
Possible Inputs
| Metric | Input Value | Range of Values |
|---|---|---|
| Frequency | 5 | 1 – 1440 (mins) |
| Filter | ||
| Warning Operator | ||
| Warning Threshold | ||
| Warning Repeat Count | ||
| Critical Operator | ||
| Critical Threshold | ||
| Critical Repeat Count | ||
| Alert | No | Yes/No |
| Graph (Yes/No) | Yes | Yes/No |
Note: As Alert is not enabled on the above metric, the fields are left blank.
Sample Output
No graph
fw.conn.setups.aborted
Metric Details
| Applicable for | Device |
| SNMP OID | 1.3.6.1.4.1.9.9.491.1.1.1.2.0 |
| Expression | NULL |
| Description | Monitors the number of connection setup attempts that were aborted before the connection could proceed to completion. The counter includes setup attempts aborted by the firewall as well as those aborted by the initiator and/or the responder(s) of/to the connection setup attempt. [OID: 1.3.6.1.4.1.9.9.491.1.1.1.2.0] |
| Category | SNMP monitors |
| Collector Type | Gateway |
| Monitor Name | Cisco Firewall Additional Connection Stats |
| Unit | psec |
Possible Inputs
| Metric | Input Value | Range of Values |
|---|---|---|
| Frequency | 5 | 1 – 1440 (mins) |
| Filter | ||
| Warning Operator | ||
| Warning Threshold | ||
| Warning Repeat Count | ||
| Critical Operator | ||
| Critical Threshold | ||
| Critical Repeat Count | ||
| Alert | No | Yes/No |
| Graph (Yes/No) | Yes | Yes/No |
Note: As Alert is not enabled on the above metric, the fields are left blank.
Sample Output
No graph
fw.conn.policy.declined
Metric Details
| Applicable for | Device |
| SNMP OID | 1.3.6.1.4.1.9.9.491.1.1.1.3.0 |
| Expression | NULL |
| Description | Monitors the The number of connections which were attempted to be setup but which were declined due to reasons of security policy. This includes the connections that failed authentication. [OID: 1.3.6.1.4.1.9.9.491.1.1.1.3.0] |
| Category | SNMP monitors |
| Collector Type | Gateway |
| Monitor Name | Cisco Firewall Additional Connection Stats |
| Unit | psec |
Possible Inputs
| Metric | Input Value | Range of Values |
|---|---|---|
| Frequency | 5 | 1 – 1440 (mins) |
| Filter | ||
| Warning Operator | ||
| Warning Threshold | ||
| Warning Repeat Count | ||
| Critical Operator | ||
| Critical Threshold | ||
| Critical Repeat Count | ||
| Alert | No | Yes/No |
| Graph (Yes/No) | Yes | Yes/No |
Note: As Alert is not enabled on the above metric, the fields are left blank.
Sample Output
No graph
fw.conn.res.declined
Metric Details
| Applicable for | Device |
| SNMP OID | 1.3.6.1.4.1.9.9.491.1.1.1.4.0 |
| Expression | NULL |
| Description | Monitors the number of connections which were attempted to be setup but which were declined due to non-availability of required resources. [OID: 1.3.6.1.4.1.9.9.491.1.1.1.4.0] |
| Category | SNMP monitors |
| Collector Type | Gateway |
| Monitor Name | Cisco Firewall Additional Connection Stats |
| Unit | psec |
Possible Inputs
| Metric | Input Value | Range of Values |
|---|---|---|
| Frequency | 5 | 1 – 1440 (mins) |
| Filter | ||
| Warning Operator | ||
| Warning Threshold | ||
| Warning Repeat Count | ||
| Critical Operator | ||
| Critical Threshold | ||
| Critical Repeat Count | ||
| Alert | No | Yes/No |
| Graph (Yes/No) | Yes | Yes/No |
Note: As Alert is not enabled on the above metric, the fields are left blank.
Sample Output
Resources Unavailability Declined Connections
fw.conn.halfopen
Metric Details
| Applicable for | Device |
| SNMP OID | 1.3.6.1.4.1.9.9.491.1.1.1.5.0 |
| Expression | NULL |
| Description | Monitors the number of connections which are in the process of being setup but which have not yet reached the established state in the connection table. [OID: 1.3.6.1.4.1.9.9.491.1.1.1.5.0] |
| Category | SNMP monitors |
| Collector Type | Gateway |
| Monitor Name | Cisco Firewall Additional Connection Stats |
| Unit |
Possible Inputs
| Metric | Input Value | Range of Values |
|---|---|---|
| Frequency | 5 | 1 – 1440 (mins) |
| Filter | ||
| Warning Operator | ||
| Warning Threshold | ||
| Warning Repeat Count | ||
| Critical Operator | ||
| Critical Threshold | ||
| Critical Repeat Count | ||
| Alert | No | Yes/No |
| Graph (Yes/No) | Yes | Yes/No |
Note: As Alert is not enabled on the above metric, the fields are left blank.
Sample Output
No graph
fw.conn.expired
Metric Details
| Applicable for | Device |
| SNMP OID | 1.3.6.1.4.1.9.9.491.1.1.1.7.0 |
| Expression | NULL |
| Description | Monitors the number of connections which were active but which were since normally terminated. [OID: 1.3.6.1.4.1.9.9.491.1.1.1.7.0] |
| Category | SNMP monitors |
| Collector Type | Gateway |
| Monitor Name | Cisco Firewall Additional Connection Stats |
| Unit | psec |
Possible Inputs
| Metric | Input Value | Range of Values |
|---|---|---|
| Frequency | 5 | 1 – 1440 (mins) |
| Filter | ||
| Warning Operator | ||
| Warning Threshold | ||
| Warning Repeat Count | ||
| Critical Operator | ||
| Critical Threshold | ||
| Critical Repeat Count | ||
| Alert | No | Yes/No |
| Graph (Yes/No) | Yes | Yes/No |
Note: As Alert is not enabled on the above metric, the fields are left blank.
Sample Output
No graph
fw.conn.aborted
Metric Details
| Applicable for | Device |
| SNMP OID | 1.3.6.1.4.1.9.9.491.1.1.1.8.0 |
| Expression | NULL |
| Description | Monitors the number of connections which were active but which were aborted by the firewall due to reasons of policy or resource rationing. [OID: 1.3.6.1.4.1.9.9.491.1.1.1.8.0] |
| Category | SNMP monitors |
| Collector Type | Gateway |
| Monitor Name | Cisco Firewall Additional Connection Stats |
| Unit | psec |
Possible Inputs
| Metric | Input Value | Range of Values |
|---|---|---|
| Frequency | 5 | 1 – 1440 (mins) |
| Filter | ||
| Warning Operator | ||
| Warning Threshold | ||
| Warning Repeat Count | ||
| Critical Operator | ||
| Critical Threshold | ||
| Critical Repeat Count | ||
| Alert | No | Yes/No |
| Graph (Yes/No) | Yes | Yes/No |
Note: As Alert is not enabled on the above metric, the fields are left blank.
Sample Output
No graph
fw.conn.embryonic
Metric Details
| Applicable for | Device |
| SNMP OID | 1.3.6.1.4.1.9.9.491.1.1.1.9.0 |
| Expression | NULL |
| Description | Monitors the number of embryonic application layer connections (that is, connections in which the signaling channel has been established while the data channel is awaiting setup). [OID: 1.3.6.1.4.1.9.9.491.1.1.1.9.0] |
| Category | SNMP monitors |
| Collector Type | Gateway |
| Monitor Name | Cisco Firewall Additional Connection Stats |
| Unit |
Possible Inputs
| Metric | Input Value | Range of Values |
|---|---|---|
| Frequency | 5 | 1 – 1440 (mins) |
| Filter | ||
| Warning Operator | ||
| Warning Threshold | ||
| Warning Repeat Count | ||
| Critical Operator | ||
| Critical Threshold | ||
| Critical Repeat Count | ||
| Alert | No | Yes/No |
| Graph (Yes/No) | Yes | Yes/No |
Note: As Alert is not enabled on the above metric, the fields are left blank.
Sample Output
No graph
fw.conn.mem.usage
Metric Details
| Applicable for | Device |
| SNMP OID | 1.3.6.1.4.1.9.9.491.1.1.2.1.0 |
| Expression | NULL |
| Description | Monitors the amount of memory occupied by all structures required to maintain the state of all connections which are either being established or are active. [OID: 1.3.6.1.4.1.9.9.491.1.1.2.1.0] |
| Category | SNMP monitors |
| Collector Type | Gateway |
| Monitor Name | Cisco Firewall Additional Connection Stats |
| Unit | KB |
Possible Inputs
| Metric | Input Value | Range of Values |
|---|---|---|
| Frequency | 5 | 1 – 1440 (mins) |
| Filter | ||
| Warning Operator | ||
| Warning Threshold | ||
| Warning Repeat Count | ||
| Critical Operator | ||
| Critical Threshold | ||
| Critical Repeat Count | ||
| Alert | No | Yes/No |
| Graph (Yes/No) | Yes | Yes/No |
Note: As Alert is not enabled on the above metric, the fields are left blank.
Sample Output
No graph