Description
Applicable on Cisco Nexus 7000 and 5000 series devices. Monitors the basic parameters like CPU utilization, Memory utilization, uptime and also monitors the FRU status parameters like fan, module and power status and also it monitors the VDC status.
Prerequisites
SNMP should be enabled in end device and device should support CISCO-ENTITY-FRU-CONTROL-MIB, CISCO-VDC-MIB, CISCO-SYSTEM-EXT-MIB OIDs and SNMP credentials should be attached against the device in portal.
How to Apply: This template is All instance selection based. It will not ask user to select any instance (s) while assigning it to a device.
Metric Parameters
| Parameter | Description |
|---|---|
| Frequency | |
| Warning Threshold | If the metric value satisfies the condition defined along with Warning Threshold value, then a notification is sent to the user. |
| Critical Threshold | If the metric value satisfies the condition defined along with Critical Threshold value, then a notification is sent to the user. |
| Alert | The alert value can be set to either Yes or No. If it is Yes, then an alert message is sent to the user. |
Metrics
cisco.fru.module.status
Metric Details
| Applicable for | Device |
| SNMP OID | 1.3.6.1.4.1.9.9.117.1.2.1.1.2 |
| Expression | NULL |
| Description | FRU Module Status. Possible status values are 1 -Unknown, 2 -OK, 3 -Disabled, 4 -OK, but diagnostics failed, 5 -Boot, 6 -Selftest, 7 -Failed, 8 -Missing, 9 -Mismatch with parent, 10 -Mismatch config, 11 -Diagnostics failed, 12 -Dormant, 13 -Out of service admin, 14 -Out of service env temp, 15 -Powered down, 16 -Powered up, 17 -Power denied, 18 -Power cycled, 19 -OK, but power over warning, 20 -OK, but power over critical, 21 -Sync in progress, 22 -Upgrading, 23 -OK, but authfailed. [OIDs: 1.3.6.1.4.1.9.9.117.1.2.1.1.2, 1.3.6.1.2.1.47.1.1.1.1.2] |
| Category | SNMP monitors |
| Collector Type | Gateway |
| Monitor Name | FRU Module Status |
| Unit |
Possible Inputs
| Metric | Input Value | Range of Values |
|---|---|---|
| Frequency | 5 | 1 – 1440 (mins) |
| Filter | NULL | Not Applicable |
| Warning Operator | IN_LIST | Ends with, ==, !=, >=, <=, >, <, In Range, Out of range, Equals, Not equals, Equals Ignore Case, Not Equals Ignore Case, Contains, Not contains, Regex match, Regex no match, In string list, Not in string list, In List, Not in list, Starts with |
| Warning Threshold | 4,5,10,11,13,14,17,19,23,27 | 1-27 |
| Warning Repeat Count | 1 | 1-12 |
| Critical Operator | IN_LIST | Ends with, ==, !=, >=, <=, >, <, In Range, Out of range, Equals, Not equals, Equals Ignore Case, Not Equals Ignore Case, Contains, Not contains, Regex match, Regex no match, In string list, Not in string list, In List, Not in list, Starts with |
| Critical Threshold | 7,8,9,20 | 1-27 |
| Critical Repeat Count | 1 | 1-12 |
| Alert | Yes | Yes/No |
| Graph (Yes/No) | Yes | Yes/No |
Sample Output
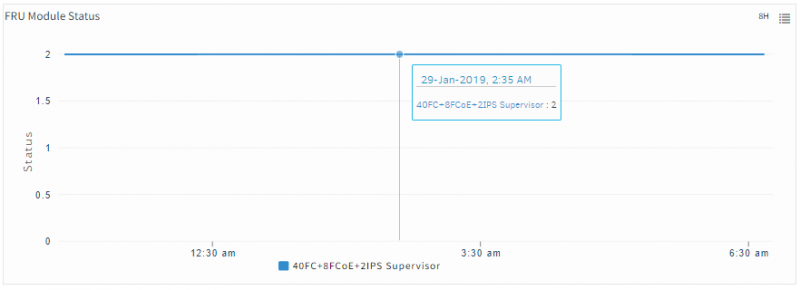
FRU Module Status
cisco.fru.power.status
Metric Details
| Applicable for | Device |
| SNMP OID | 1.3.6.1.4.1.9.9.117.1.1.2.1.2 |
| Expression | NULL |
| Description | FRU Power Status. 1 -FRU powered off, 2 -FRU powered on, 3 -FRU power off by admin, 4 -FRU powered off-denied, 5 -FRU powered off-environment issue, 6 -FRU powered off temperature problem, 7 -FRU powered off - fan problem, 8 -FRU powered off - failed, 9 - |
| Category | SNMP monitors |
| Collector Type | Gateway |
| Monitor Name | FRU Power Status |
| Unit |
Possible Inputs
| Metric | Input Value | Range of Values |
|---|---|---|
| Frequency | 5 | 1 – 1440 (mins) |
| Filter | NULL | Not Applicable |
| Warning Operator | ||
| Warning Threshold | ||
| Warning Repeat Count | ||
| Critical Operator | NOT_IN_LIST | Ends with, ==, !=, >=, <=, >, <, In Range, Out of range, Equals, Not equals, Equals Ignore Case, Not Equals Ignore Case, Contains, Not contains, Regex match, Regex no match, In string list, Not in string list, In List, Not in list, Starts with |
| Critical Threshold | 2,3 | 1-12 |
| Critical Repeat Count | 1 | 1-12 |
| Alert | Yes | Yes/No |
| Graph (Yes/No) | Yes | Yes/No |
Sample Output
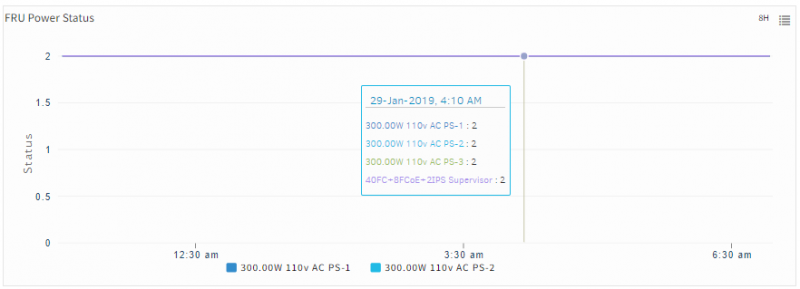
FRU Power Status
cisco.fru.fan.status
Metric Details
| Applicable for | Device |
| SNMP OID | 1.3.6.1.4.1.9.9.117.1.4.1.1.1 |
| Expression | NULL |
| Description | FRU Fan Status. Possible status values are 1 -Unknown, 2 -Up, 3 -Down, 4 -Warning. Alerts if fan status in 3(Down) or 4(Warning) [OIDs: 1.3.6.1.4.1.9.9.117.1.4.1.1.1, 1.3.6.1.2.1.47.1.1.1.1.2] |
| Category | SNMP monitors |
| Collector Type | Gateway |
| Monitor Name | FRU Fan Status |
| Unit |
Possible Inputs
| Metric | Input Value | Range of Values |
|---|---|---|
| Frequency | 5 | 1 – 1440 (mins) |
| Filter | NULL | Not Applicable |
| Warning Operator | EQUAL | Ends with, ==, !=, >=, <=, >, <, In Range, Out of range, Equals, Not equals, Equals Ignore Case, Not Equals Ignore Case, Contains, Not contains, Regex match, Regex no match, In string list, Not in string list, In List, Not in list, Starts with |
| Warning Threshold | 4 | 1-4 |
| Warning Repeat Count | 1 | 1-12 |
| Critical Operator | EQUAL | Ends with, ==, !=, >=, <=, >, <, In Range, Out of range, Equals, Not equals, Equals Ignore Case, Not Equals Ignore Case, Contains, Not contains, Regex match, Regex no match, In string list, Not in string list, In List, Not in list, Starts with |
| Critical Threshold | 3 | 1-4 |
| Critical Repeat Count | 1 | 1-12 |
| Alert | Yes | Yes/No |
| Graph (Yes/No) | Yes | Yes/No |
Sample Output
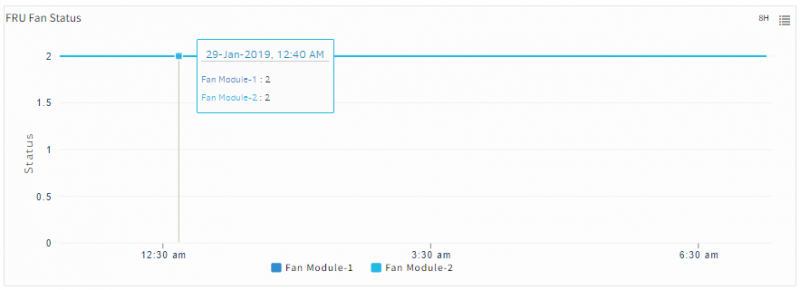
FRU Fan Status
nexus.vdc
Metric Details
| Applicable for | Device |
| SNMP OID | 1.3.6.1.4.1.9.9.774.1.1.1.3, 1.3.6.1.4.1.9.9.774.1.1.1.5, 1.3.6.1.4.1.9.9.774.1.1.1.6 |
| Expression | ciscoVdcState |
| Description | Current operational state of the virtual device. Possible values are 1=Active, 2=Suspended, 3=NonConfigured, 4=Configured, 5=Creating, 6=Deleting, 7=Failed, 8=Pending, 9=Updating, 10=Restarting, 11=Suspending, 12=Resuming, 13=Failing. [OIDs: 1.3.6.1.4.1.9.9.774.1.1.1.2, 1.3.6.1.4.1.9.9.774.1.1.1.3] |
| Category | SNMP monitors |
| Collector Type | Gateway |
| Monitor Name | Virtual Device Context(VDC) status |
| Unit |
Possible Inputs
| Metric | Input Value | Range of Values |
|---|---|---|
| Frequency | 5 | 1 – 1440 (mins) |
| Filter | NULL | Not Applicable |
| Warning Operator | IN_LIST | Ends with, ==, !=, >=, <=, >, <, In Range, Out of range, Equals, Not equals, Equals Ignore Case, Not Equals Ignore Case, Contains, Not contains, Regex match, Regex no match, In string list, Not in string list, In List, Not in list, Starts with |
| Warning Threshold | 2,3 | 1-13 |
| Warning Repeat Count | 1 | 1-12 |
| Critical Operator | GREATER_THAN_EQUAL | Ends with, ==, !=, >=, <=, >, <, In Range, Out of range, Equals, Not equals, Equals Ignore Case, Not Equals Ignore Case, Contains, Not contains, Regex match, Regex no match, In string list, Not in string list, In List, Not in list, Starts with |
| Critical Threshold | 5 | 1-13 |
| Critical Repeat Count | 1 | 1-12 |
| Alert | Yes | Yes/No |
| Graph (Yes/No) | Yes | Yes/No |
Sample Output
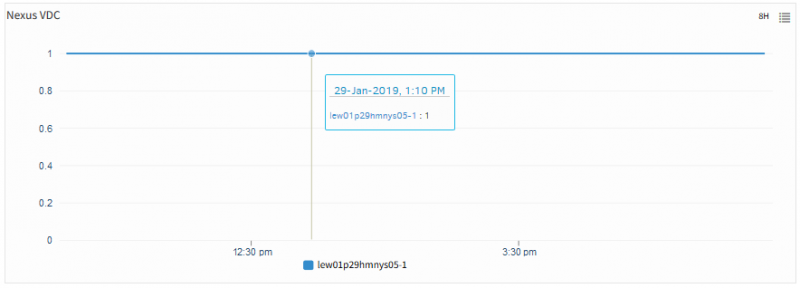
Nexus VDC
nexus.cpu.utilization
Metric Details
| Applicable for | Device |
| SNMP OID | 1.3.6.1.4.1.9.9.305.1.1.1.0 |
| Expression | NULL |
| Description | The average utilization of CPU on the active supervisor. [OID - 1.3.6.1.4.1.9.9.305.1.1.1] |
| Category | SNMP monitors |
| Collector Type | Gateway |
| Monitor Name | Cisco System Performance - CISCO-SYSTEM-EXT-MIB |
| Unit | % |
Possible Inputs
| Metric | Input Value | Range of Values |
|---|---|---|
| Frequency | 5 | 1 – 1440 (mins) |
| Filter | ||
| Warning Operator | GREATER_THAN_EQUAL | Ends with, ==, !=, >=, <=, >, <, In Range, Out of range, Equals, Not equals, Equals Ignore Case, Not Equals Ignore Case, Contains, Not contains, Regex match, Regex no match, In string list, Not in string list, In List, Not in list, Starts with |
| Warning Threshold | 85 | 0-100 |
| Warning Repeat Count | 2 | 1-12 |
| Critical Operator | GREATER_THAN_EQUAL | Ends with, ==, !=, >=, <=, >, <, In Range, Out of range, Equals, Not equals, Equals Ignore Case, Not Equals Ignore Case, Contains, Not contains, Regex match, Regex no match, In string list, Not in string list, In List, Not in list, Starts with |
| Critical Threshold | 90 | 0-100 |
| Critical Repeat Count | 2 | 1-12 |
| Alert | Yes | Yes/No |
| Graph (Yes/No) | Yes | Yes/No |
Sample Output
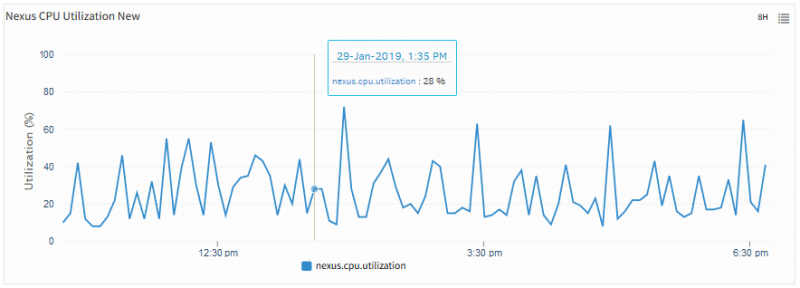
Nexus CPU Utilization New
nexus.memory.utilization
Metric Details
| Applicable for | Device |
| SNMP OID | 1.3.6.1.4.1.9.9.305.1.1.2.0 |
| Expression | NULL |
| Description | The average utilization of memory on the active supervisor. [OID - 1.3.6.1.4.1.9.9.305.1.1.2.0] |
| Category | SNMP monitors |
| Collector Type | Gateway |
| Monitor Name | Cisco System Performance - CISCO-SYSTEM-EXT-MIB |
| Unit | % |
Possible Inputs
| Metric | Input Value | Range of Values |
|---|---|---|
| Frequency | 5 | 1 – 1440 (mins) |
| Filter | ||
| Warning Operator | GREATER_THAN_EQUAL | Ends with, ==, !=, >=, <=, >, <, In Range, Out of range, Equals, Not equals, Equals Ignore Case, Not Equals Ignore Case, Contains, Not contains, Regex match, Regex no match, In string list, Not in string list, In List, Not in list, Starts with |
| Warning Threshold | 85 | 0-100 |
| Warning Repeat Count | 2 | 1-12 |
| Critical Operator | GREATER_THAN_EQUAL | Ends with, ==, !=, >=, <=, >, <, In Range, Out of range, Equals, Not equals, Equals Ignore Case, Not Equals Ignore Case, Contains, Not contains, Regex match, Regex no match, In string list, Not in string list, In List, Not in list, Starts with |
| Critical Threshold | 90 | 0-100 |
| Critical Repeat Count | 2 | 1-12 |
| Alert | Yes | Yes/No |
| Graph (Yes/No) | Yes | Yes/No |
Sample Output
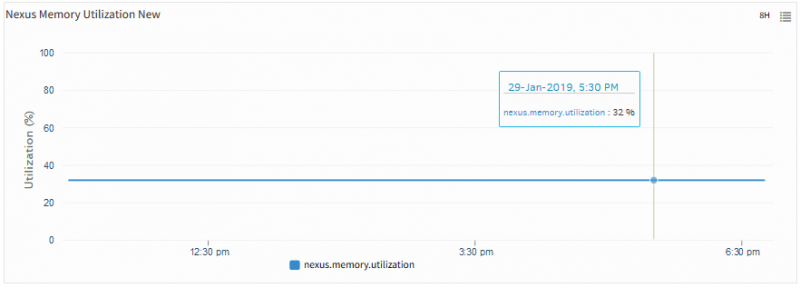
Nexus Memory Utilization New
system.uptime
Metric Details
| Applicable for | Device |
| SNMP OID | 1.3.6.1.4.1.9.9.305.1.1.10.0 |
| Expression | NULL |
| Description | The time (in seconds) since the entire system was last re-initialized as a result of reload. [CISCO-SYSTEM-EXT-MIB] - cseSysUpTime(1.3.6.1.4.1.9.9.305.1.1.10) |
| Category | SNMP monitors |
| Collector Type | Gateway |
| Monitor Name | Cisco System Performance - CISCO-SYSTEM-EXT-MIB |
| Unit | s |
Possible Inputs
| Metric | Input Value | Range of Values |
|---|---|---|
| Frequency | 5 | 1 – 1440 (mins) |
| Filter | ||
| Warning Operator | ||
| Warning Threshold | ||
| Warning Repeat Count | ||
| Critical Operator | LESS_THAN_EQUAL | Ends with, ==, !=, >=, <=, >, <, In Range, Out of range, Equals, Not equals, Equals Ignore Case, Not Equals Ignore Case, Contains, Not contains, Regex match, Regex no match, In string list, Not in string list, In List, Not in list, Starts with |
| Critical Threshold | 1800 | 0-4294967295 |
| Critical Repeat Count | 1 | 1-12 |
| Alert | Yes | Yes/No |
| Graph (Yes/No) | Yes | Yes/No |
Sample Output
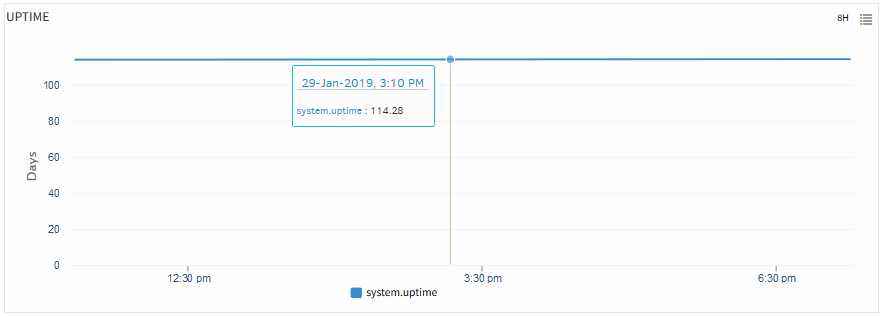
Uptime
nexus.vdc.resource.usage
Metric Details
| Applicable for | Device |
| SNMP OID | 1.3.6.1.4.1.9.9.774.1.4.1.1.7, 1.3.6.1.4.1.9.9.774.1.4.1.1.3, 1.3.6.1.4.1.9.9.774.1.4.1.1.5 |
| Expression | (ciscoVdcGlobalResUsed / ciscoVdcGlobalResTotal) * 100 |
| Description | Monitors the utilization of VDC resource. [1.3.6.1.4.1.9.9.774.1.4.1.1.3, 1.3.6.1.4.1.9.9.774.1.4.1.1.7] |
| Category | SNMP monitors |
| Collector Type | Gateway |
| Monitor Name | Virtual Device Context(VDC) Resource Usage - Across all VDCs |
| Unit | % |
Possible Inputs
| Metric | Input Value | Range of Values |
|---|---|---|
| Frequency | 5 | 1 – 1440 (mins) |
| Filter | NULL | Not Applicable |
| Warning Operator | GREATER_THAN_EQUAL | Ends with, ==, !=, >=, <=, >, <, In Range, Out of range, Equals, Not equals, Equals Ignore Case, Not Equals Ignore Case, Contains, Not contains, Regex match, Regex no match, In string list, Not in string list, In List, Not in list, Starts with |
| Warning Threshold | 70 | 0-100 |
| Warning Repeat Count | 1 | 1-12 |
| Critical Operator | GREATER_THAN_EQUAL | Ends with, ==, !=, >=, <=, >, <, In Range, Out of range, Equals, Not equals, Equals Ignore Case, Not Equals Ignore Case, Contains, Not contains, Regex match, Regex no match, In string list, Not in string list, In List, Not in list, Starts with |
| Critical Threshold | 80 | 0-100 |
| Critical Repeat Count | 1 | 1-12 |
| Alert | Yes | Yes/No |
| Graph (Yes/No) | Yes | Yes/No |
Sample Output
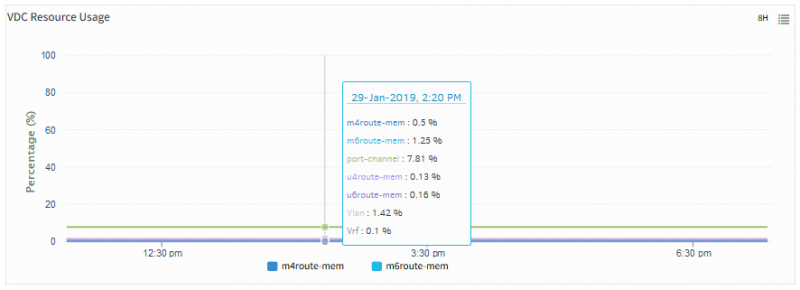
VDC Resource Usage
cisco.fru.total.availablecurrent
Metric Details
| Applicable for | Device |
| SNMP OID | 1.3.6.1.4.1.9.9.117.1.1.1.1.3 |
| Expression | NULL |
| Description | Total current available for FRU usage. [OID: 1.3.6.1.4.1.9.9.117.1.1.1.1.3] |
| Category | SNMP monitors |
| Collector Type | Gateway |
| Monitor Name | Cisco FRU Power Supply Group |
| Unit | amps |
Possible Inputs
| Metric | Input Value | Range of Values |
|---|---|---|
| Frequency | 5 | 1 – 1440 (mins) |
| Filter | NULL | Not Applicable |
| Warning Operator | ||
| Warning Threshold | ||
| Warning Repeat Count | ||
| Critical Operator | ||
| Critical Threshold | ||
| Critical Repeat Count | ||
| Alert | No | Yes/No |
| Graph (Yes/No) | Yes | Yes/No |
Note: As Alert is not enabled on the above metric, the fields are left blank.
Sample Output
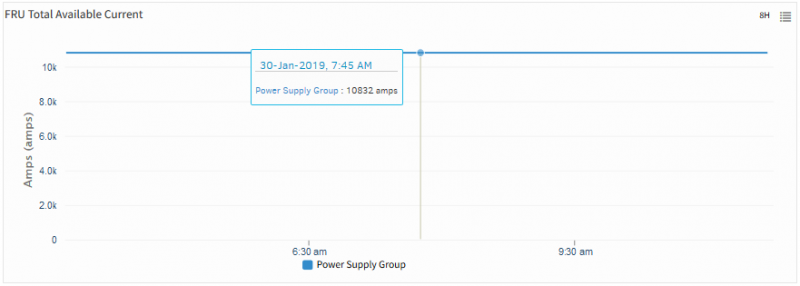
FRU Total Available Current
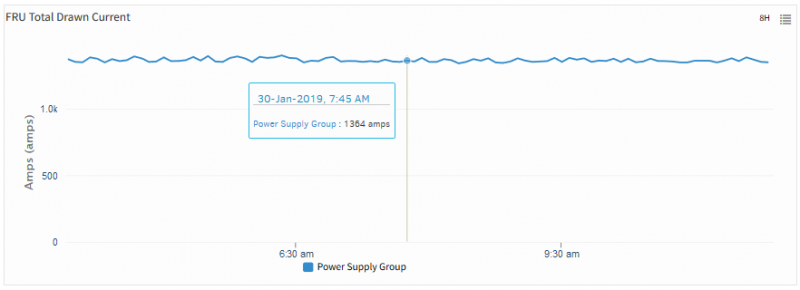
cisco.fru.total.drawncurrent
Metric Details
| Applicable for | Device |
| SNMP OID | 1.3.6.1.4.1.9.9.117.1.1.1.1.4 |
| Expression | NULL |
| Description | Total current drawn by powered-on FRUs. [OID: 1.3.6.1.4.1.9.9.117.1.1.1.1.4] |
| Category | SNMP monitors |
| Collector Type | Gateway |
| Monitor Name | Cisco FRU Power Supply Group |
| Unit | amps |
Possible Inputs
| Metric | Input Value | Range of Values |
|---|---|---|
| Frequency | 5 | 1 – 1440 (mins) |
| Filter | NULL | Not Applicable |
| Warning Operator | ||
| Warning Threshold | ||
| Warning Repeat Count | ||
| Critical Operator | ||
| Critical Threshold | ||
| Critical Repeat Count | ||
| Alert | No | Yes/No |
| Graph (Yes/No) | Yes | Yes/No |
Note: As Alert is not enabled on the above metric, the fields are left blank.
Sample Output