Description
Monitors CUBE SIP retries statistics, RTP Jitter, UDP Jitter, ICMP Jitter, Dail Peer Statistics, PRI Number of Active Calls, Cisco Voice Gateway Active Calls Total, Cisco Dail Peers Calls Usage, Cisco IP Interface Active Media Calls, Cisco Call Arrival Rate, Cisco Transcoding Sessions Statistics, Cisco Transcoding Session Statistics Per-Profile, Cisco MTP Session Statistics, Cisco MTP Session Statistics Per-Profile.
Prerequisites
SNMP should be enabled in end device and device should support CISCO-DIAL-CONTROL-MIB, CISCO-VOICE-DIAL-CONTROL-MIB, CISCO-VOICE-COMMON-DIAL-CONTROL-MIB OIDs and SNMP credentials should be attached against the device in portal.
How to Apply: This template is All instance selection based. It will not ask user to select any instance (s) while assigning it to a device.
Metric Parameters
| Parameter | Description |
|---|---|
| Frequency | Warning Threshold | If the metric value satisfies the condition defined along with Warning Threshold value, then a notification is sent to the user. |
| Critical Threshold | If the metric value satisfies the condition defined along with Critical Threshold value, then a notification is sent to the user. |
| Alert | The alert value can be set to either Yes or No. If it is Yes, then an alert message is sent to the user. |
Metrics
pri.numberof.active.calls
Metric Details
| Applicable for | Device |
| SNMP OID | 1.3.6.1.4.1.9.9.63.1.3.8.1.1.2.7 |
| Expression | NULL |
| Description | Provides the details of the number of active calls |
| Category | SNMP monitors |
| Collector Type | Gateway |
| Monitor Name | PRI Number of Active Calls |
| Unit |
Possible Inputs
| Metric | Input Value | Range of Values |
|---|---|---|
| Frequency | 10 | 1 – 1440 (mins) |
| Filter | ||
| Warning Operator | EQUAL | Ends with, ==, !=, >=, <=, >, <, In Range, Out of range, Equals, Not equals, Equals Ignore Case, Not Equals Ignore Case, Contains, Not contains, Regex match, Regex no match, In string list, Not in string list, In List, Not in list, Starts with |
| Warning Threshold | 22 | 0 - 4294967295 |
| Warning Repeat Count | 1 | 1-12 |
| Critical Operator | EQUAL | Ends with, ==, !=, >=, <=, >, <, In Range, Out of range, Equals, Not equals, Equals Ignore Case, Not Equals Ignore Case, Contains, Not contains, Regex match, Regex no match, In string list, Not in string list, In List, Not in list, Starts with |
| Critical Threshold | 23 | 0 - 4294967295 |
| Critical Repeat Count | 1 | 1-12 |
| Alert | Yes | Yes/No |
| Graph (Yes/No) | Yes | Yes/No |
Sample Output
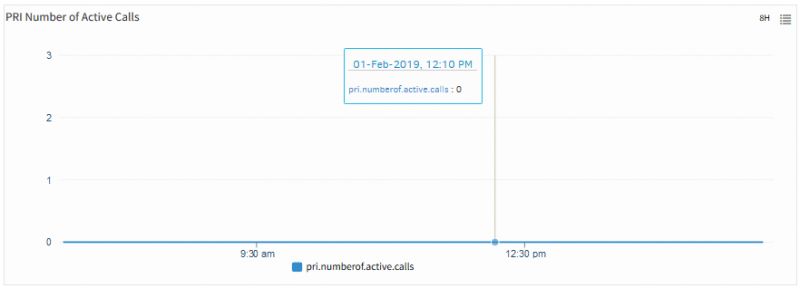
PRI Number of Active Calls
cisco.rttmon.jitter.icmp.avgjitter
Metric Details
| Applicable for | Device |
| SNMP OID | 1.3.6.1.4.1.9.9.42.1.5.4.1.44 |
| Expression | NULL |
| Description | The average of positive and negative jitter values in Source-to-Destination and Destination-to-Source direction. [OID: 1.3.6.1.4.1.9.9.42.1.5.4.1.44] |
| Category | SNMP monitors |
| Collector Type | Gateway |
| Monitor Name | Cisco IP SLA ICMP Jitter Operation Stats - SNMP |
| Unit | ms |
Possible Inputs
| Metric | Input Value | Range of Values |
|---|---|---|
| Frequency | 10 | 1 – 1440 (mins) |
| Filter | NULL | Not Applicable |
| Warning Operator | ||
| Warning Threshold | ||
| Warning Repeat Count | ||
| Critical Operator | ||
| Critical Threshold | ||
| Critical Repeat Count | ||
| Alert | No | Yes/No |
| Graph (Yes/No) | Yes | Yes/No |
Note: As Alert is not enabled on the above metric, the fields are left blank.
Sample Output
No graph
cisco.voice.gateway.call.rate
Metric Details
| Applicable for | Device |
| SNMP OID | 1.3.6.1.4.1.9.9.63.1.3.11.3.0 |
| Expression | NULL |
| Description | It represents the number of calls connected during the last monitoring period duration(cvCallRateMonitorTime). [OID: 1.3.6.1.4.1.9.9.63.1.3.11.3.0] |
| Category | SNMP monitors |
| Collector Type | Gateway |
| Monitor Name | Cisco Call Arrival Rate |
| Unit |
Possible Inputs
| Metric | Input Value | Range of Values |
|---|---|---|
| Frequency | 10 | 1 – 1440 (mins) |
| Filter | ||
| Warning Operator | ||
| Warning Threshold | ||
| Warning Repeat Count | ||
| Critical Operator | ||
| Critical Threshold | ||
| Critical Repeat Count | ||
| Alert | No | Yes/No |
| Graph (Yes/No) | Yes | Yes/No |
Note: As Alert is not enabled on the above metric, the fields are left blank.
Sample Output
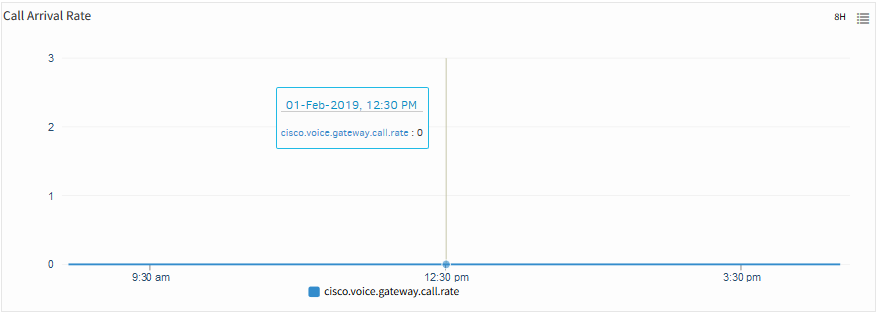
Call Arrival Rate
interface.incoming.active.media.calls
Metric Details
| Applicable for | Device |
| SNMP OID | 1.3.6.1.4.1.9.9.63.1.3.8.5.1.1 |
| Expression | NULL |
| Description | It represents the total number of inbound active media calls through this IP interface. [OIDs: 1.3.6.1.4.1.9.9.63.1.3.8.5.1.1] |
| Category | SNMP monitors |
| Collector Type | Gateway |
| Monitor Name | Cisco IP Interface Active Media Calls |
| Unit |
Possible Inputs
| Metric | Input Value | Range of Values |
|---|---|---|
| Frequency | 10 | 1 – 1440 (mins) |
| Filter | NULL | Not Applicable |
| Warning Operator | ||
| Warning Threshold | ||
| Warning Repeat Count | ||
| Critical Operator | ||
| Critical Threshold | ||
| Critical Repeat Count | ||
| Alert | No | Yes/No |
| Graph (Yes/No) | Yes | Yes/No |
Note: As Alert is not enabled on the above metric, the fields are left blank.
Sample Output
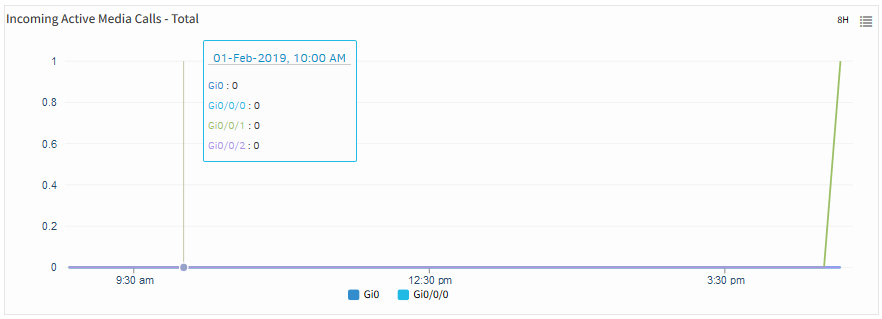
Incoming Active Media Calls-Total
Interface.outgoing.active.media.calls
Metric Details
| Applicable for | Device |
| SNMP OID | 1.3.6.1.4.1.9.9.63.1.3.8.5.1.2 |
| Expression | NULL |
| Description | It represents the total number of outbound active media calls through this IP interface. [OIDs: 1.3.6.1.4.1.9.9.63.1.3.8.5.1.2] |
| Category | SNMP monitors |
| Collector Type | Gateway |
| Monitor Name | Cisco IP Interface Active Media Calls |
| Unit |
Possible Inputs
| Metric | Input Value | Range of Values |
|---|---|---|
| Frequency | 10 | 1 – 1440 (mins) |
| Filter | NULL | Not Applicable |
| Warning Operator | ||
| Warning Threshold | ||
| Warning Repeat Count | ||
| Critical Operator | ||
| Critical Threshold | ||
| Critical Repeat Count | ||
| Alert | No | Yes/No |
| Graph (Yes/No) | Yes | Yes/No |
Note: As Alert is not enabled on the above metric, the fields are left blank.
Sample Output
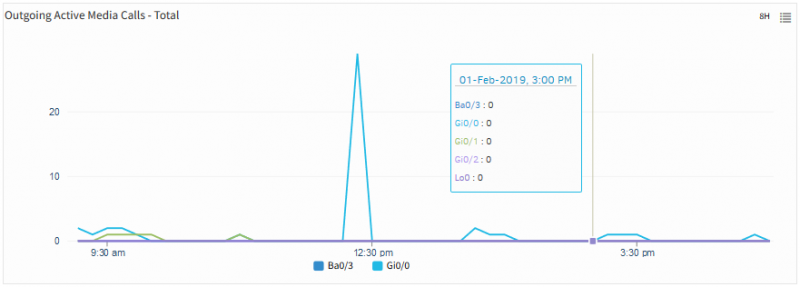
Outing Active Media Calls-Total
cdsp.mtp.sess.avail
Metric Details
| Applicable for | Device |
| SNMP OID | 1.3.6.1.4.1.9.9.86.1.7.3.0 |
| Expression | NULL |
| Description | It represents the total number of MTP sessionsnavailable for the voice gateway. The value is equal to summation of all the values returned by MTP profile object cdspMtpProfileMaxAvailHardSess. [OID: 1.3.6.1.4.1.9.9.86.1.7.3.0] |
| Category | SNMP monitors |
| Collector Type | Gateway |
| Monitor Name | Cisco MTP Session Statistics |
| Unit |
Possible Inputs
| Metric | Input Value | Range of Values |
|---|---|---|
| Frequency | 10 | 1 – 1440 (mins) |
| Filter | ||
| Warning Operator | ||
| Warning Threshold | ||
| Warning Repeat Count | ||
| Critical Operator | ||
| Critical Threshold | ||
| Critical Repeat Count | ||
| Alert | No | Yes/No |
| Graph (Yes/No) | Yes | Yes/No |
Note: As Alert is not enabled on the above metric, the fields are left blank.
Sample Output
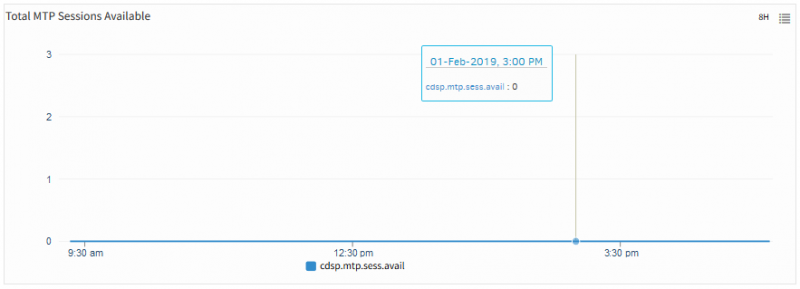
Total MTP Sessions Available
cdsp.mtp.sess.unused
Metric Details
| Applicable for | Device |
| SNMP OID | 1.3.6.1.4.1.9.9.86.1.7.4.0 |
| Expression | NULL |
| Description | It represents the Total of all unused HW MTP sessions across all configured profiles. [OID: 1.3.6.1.4.1.9.9.86.1.7.4.0] |
| Category | SNMP monitors |
| Collector Type | Gateway |
| Monitor Name | Cisco MTP Session Statistics |
| Unit |
Possible Inputs
| Metric | Input Value | Range of Values |
|---|---|---|
| Frequency | 10 | 1 – 1440 (mins) |
| Filter | ||
| Warning Operator | ||
| Warning Threshold | ||
| Warning Repeat Count | ||
| Critical Operator | ||
| Critical Threshold | ||
| Critical Repeat Count | ||
| Alert | No | Yes/No |
| Graph (Yes/No) | Yes | Yes/No |
Note: As Alert is not enabled on the above metric, the fields are left blank.
Sample Output
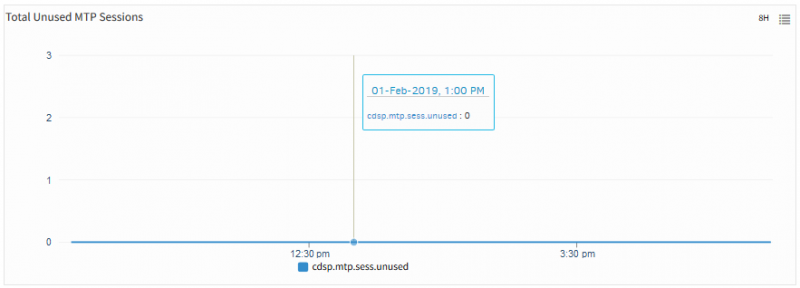
Total Unused MTP Sessions
cdsp.mtp.hw.sess.avail.per.profile
Metric Details
| Applicable for | Device |
| SNMP OID | 1.3.6.1.4.1.9.9.86.1.6.4.1.4 |
| Expression | NULL |
| Description | It represents the Number of Hardware MTPnsessions available for the DSP profile given in cdspMtpProfileId. [OID: 1.3.6.1.4.1.9.9.86.1.6.4.1.3, 1.3.6.1.4.1.9.9.86.1.6.4.1.4] |
| Category | SNMP monitors |
| Collector Type | Gateway |
| Monitor Name | Cisco MTP Session Statistics Per-Profile |
| Unit |
Possible Inputs
| Metric | Input Value | Range of Values |
|---|---|---|
| Frequency | 10 | 1 – 1440 (mins) |
| Filter | NULL | Not Applicable |
| Warning Operator | ||
| Warning Threshold | ||
| Warning Repeat Count | ||
| Critical Operator | ||
| Critical Threshold | ||
| Critical Repeat Count | ||
| Alert | No | Yes/No |
| Graph (Yes/No) | Yes | Yes/No |
Note: As Alert is not enabled on the above metric, the fields are left blank.
Sample Output
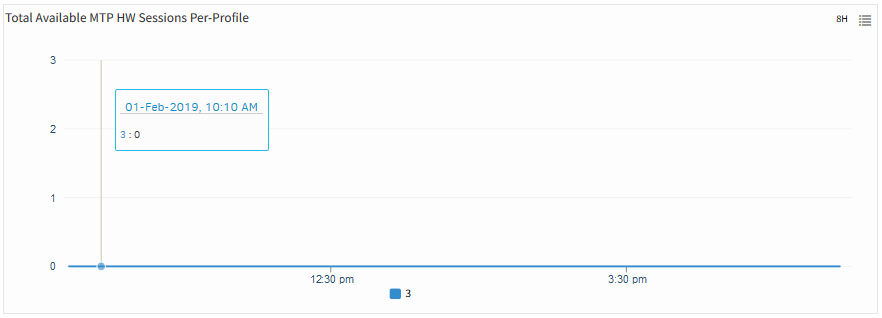
Total Available MTP HW Sessions Per Profile
cisco.sip.retry.invites
Metric Details
| Applicable for | Device |
| SNMP OID | 1.3.6.1.4.1.9.9.152.1.2.8.1.0 |
| Expression | NULL |
| Description | Monitors the number of INVITE retries/sec that have been sent by the user agent. [OID: 1.3.6.1.4.1.9.9.152.1.2.8.1.0] |
| Category | SNMP monitors |
| Collector Type | Gateway |
| Monitor Name | Cisco SIP Retry Statistics |
| Unit | psec |
Possible Inputs
| Metric | Input Value | Range of Values |
|---|---|---|
| Frequency | 10 | 1 – 1440 (mins) |
| Filter | ||
| Warning Operator | ||
| Warning Threshold | ||
| Warning Repeat Count | ||
| Critical Operator | ||
| Critical Threshold | ||
| Critical Repeat Count | ||
| Alert | No | Yes/No |
| Graph (Yes/No) | Yes | Yes/No |
Note: As Alert is not enabled on the above metric, the fields are left blank.
Sample Output
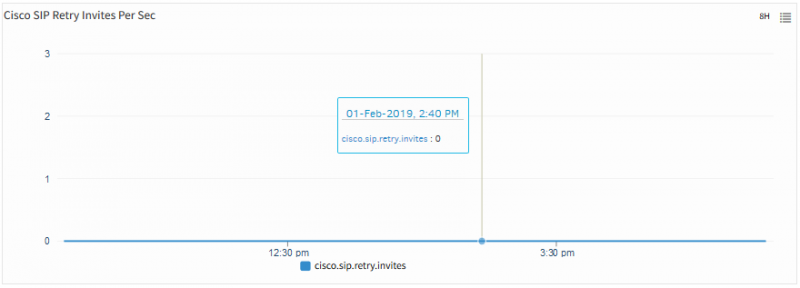
Cisco SIP Retry Invites Per Sec
cisco.sip.retry.byes
Metric Details
| Applicable for | Device |
| SNMP OID | 1.3.6.1.4.1.9.9.152.1.2.8.2.0 |
| Expression | NULL |
| Description | Monitors the number of BYE retries that have been sent by the user agent. [OID: 1.3.6.1.4.1.9.9.152.1.2.8.2] |
| Category | SNMP monitors |
| Collector Type | Gateway |
| Monitor Name | Cisco SIP Retry Statistics |
| Unit | psec |
Possible Inputs
| Metric | Input Value | Range of Values |
|---|---|---|
| Frequency | 10 | 1 – 1440 (mins) |
| Filter | ||
| Warning Operator | ||
| Warning Threshold | ||
| Warning Repeat Count | ||
| Critical Operator | ||
| Critical Threshold | ||
| Critical Repeat Count | ||
| Alert | No | Yes/No |
| Graph (Yes/No) | Yes | Yes/No |
Note: As Alert is not enabled on the above metric, the fields are left blank.
Sample Output
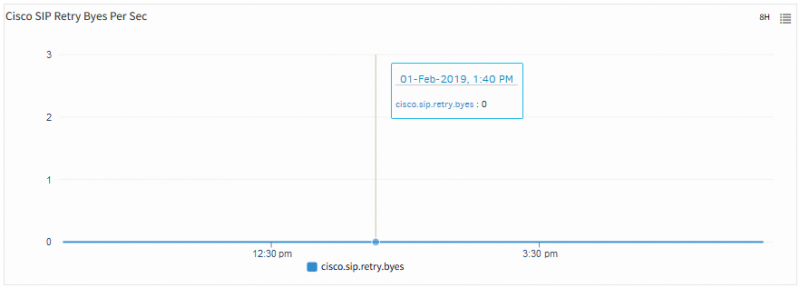
Cisco SIP Retry Bytes Per Second
cisco.sip.retry.cancels
Metric Details
| Applicable for | Device |
| SNMP OID | 1.3.6.1.4.1.9.9.152.1.2.8.3.0 |
| Expression | NULL |
| Description | Monitors the number of CANCEL retries that have been sent by the user agent. [OID: 1.3.6.1.4.1.9.9.152.1.2.8.3.0] |
| Category | SNMP monitors |
| Collector Type | Gateway |
| Monitor Name | Cisco SIP Retry Statistics |
| Unit | psec |
Possible Inputs
| Metric | Input Value | Range of Values |
|---|---|---|
| Frequency | 10 | 1 – 1440 (mins) |
| Filter | ||
| Warning Operator | ||
| Warning Threshold | ||
| Warning Repeat Count | ||
| Critical Operator | ||
| Critical Threshold | ||
| Critical Repeat Count | ||
| Alert | No | Yes/No |
| Graph (Yes/No) | Yes | Yes/No |
Note: As Alert is not enabled on the above metric, the fields are left blank.
Sample Output
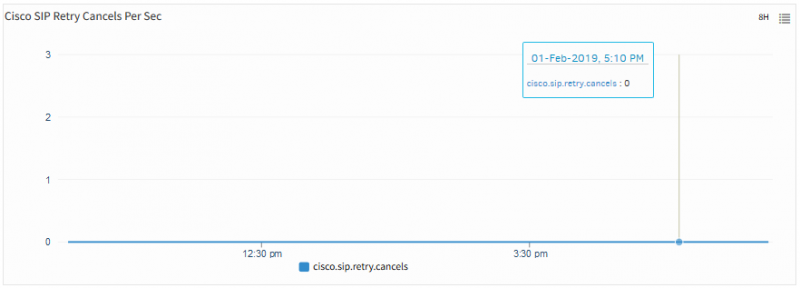
Cisco SIP Retry Cancels Per Second
cisco.sip.retry.registers
Metric Details
| Applicable for | Device |
| SNMP OID | 1.3.6.1.4.1.9.9.152.1.2.8.4.0 |
| Expression | NULL |
| Description | Monitors the number of REGISTER retries that have been sent by the user agent. [OID: 1.3.6.1.4.1.9.9.152.1.2.8.4.0] |
| Category | SNMP monitors |
| Collector Type | Gateway |
| Monitor Name | Cisco SIP Retry Statistics |
| Unit | psec |
Possible Inputs
| Metric | Input Value | Range of Values |
|---|---|---|
| Frequency | 10 | 1 – 1440 (mins) |
| Filter | ||
| Warning Operator | ||
| Warning Threshold | ||
| Warning Repeat Count | ||
| Critical Operator | ||
| Critical Threshold | ||
| Critical Repeat Count | ||
| Alert | No | Yes/No |
| Graph (Yes/No) | Yes | Yes/No |
Note: As Alert is not enabled on the above metric, the fields are left blank.
Sample Output
No graph
cisco.sip.retry.responses
Metric Details
| Applicable for | Device |
| SNMP OID | 1.3.6.1.4.1.9.9.152.1.2.8.5.0 |
| Expression | NULL |
| Description | Monitors number of Response (while expecting a ACK) retries that have been sent by the user agent. [OID: 1.3.6.1.4.1.9.9.152.1.2.8.5.0] |
| Category | SNMP monitors |
| Collector Type | Gateway |
| Monitor Name | Cisco SIP Retry Statistics |
| Unit | psec |
Possible Inputs
| Metric | Input Value | Range of Values |
|---|---|---|
| Frequency | 10 | 1 – 1440 (mins) |
| Filter | ||
| Warning Operator | ||
| Warning Threshold | ||
| Warning Repeat Count | ||
| Critical Operator | ||
| Critical Threshold | ||
| Critical Repeat Count | ||
| Alert | No | Yes/No |
| Graph (Yes/No) | Yes | Yes/No |
Note: As Alert is not enabled on the above metric, the fields are left blank.
Sample Output
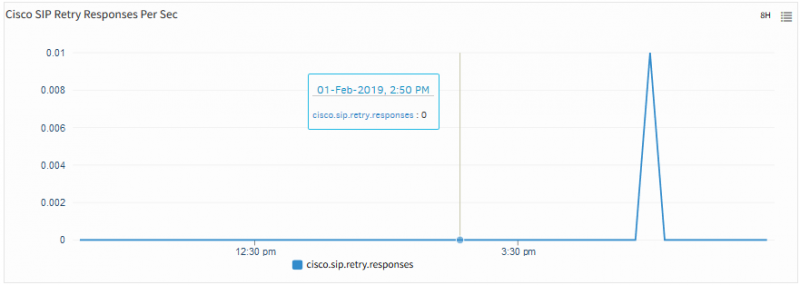
Cisco SIP Retry Responses Per Second
cisco.sip.retry.pracks
Metric Details
| Applicable for | Device |
| SNMP OID | 1.3.6.1.4.1.9.9.152.1.2.8.6.0 |
| Expression | NULL |
| Description | Monitors the number of PRovisional ACKnowledgement retries sent by the user agent. [OID: 1.3.6.1.4.1.9.9.152.1.2.8.6.0] |
| Category | SNMP monitors |
| Collector Type | Gateway |
| Monitor Name | Cisco SIP Retry Statistics |
| Unit | psec |
Possible Inputs
| Metric | Input Value | Range of Values |
|---|---|---|
| Frequency | 10 | 1 – 1440 (mins) |
| Filter | ||
| Warning Operator | ||
| Warning Threshold | ||
| Warning Repeat Count | ||
| Critical Operator | ||
| Critical Threshold | ||
| Critical Repeat Count | ||
| Alert | No | Yes/No |
| Graph (Yes/No) | Yes | Yes/No |
Note: As Alert is not enabled on the above metric, the fields are left blank.
Sample Output
Cisco SIP Retry Pracks Per Second
cisco.sip.retry.comets
Metric Details
| Applicable for | Device |
| SNMP OID | 1.3.6.1.4.1.9.9.152.1.2.8.7.0 |
| Expression | NULL |
| Description | Monitors the number of COndition MET retries sent by the user agent. [OID: 1.3.6.1.4.1.9.9.152.1.2.8.7.0] |
| Category | SNMP monitors |
| Collector Type | Gateway |
| Monitor Name | Cisco SIP Retry Statistics |
| Unit | psec |
Possible Inputs
| Metric | Input Value | Range of Values |
|---|---|---|
| Frequency | 10 | 1 – 1440 (mins) |
| Filter | ||
| Warning Operator | ||
| Warning Threshold | ||
| Warning Repeat Count | ||
| Critical Operator | ||
| Critical Threshold | ||
| Critical Repeat Count | ||
| Alert | No | Yes/No |
| Graph (Yes/No) | Yes | Yes/No |
Note: As Alert is not enabled on the above metric, the fields are left blank.
Sample Output
Cisco SIP Retry Comets Per Second
cisco.sip.retry.reliable1xxrsps
Metric Details
| Applicable for | Device |
| SNMP OID | 1.3.6.1.4.1.9.9.152.1.2.8.8.0 |
| Expression | NULL |
| Description | Monitors the number of Reliable 1xx Response retries sent by the user agent. [OID: 1.3.6.1.4.1.9.9.152.1.2.8.8.0] |
| Category | SNMP monitors |
| Collector Type | Gateway |
| Monitor Name | Cisco SIP Retry Statistics |
| Unit | psec |
Possible Inputs
| Metric | Input Value | Range of Values |
|---|---|---|
| Frequency | 10 | 1 – 1440 (mins) |
| Filter | ||
| Warning Operator | ||
| Warning Threshold | ||
| Warning Repeat Count | ||
| Critical Operator | ||
| Critical Threshold | ||
| Critical Repeat Count | ||
| Alert | No | Yes/No |
| Graph (Yes/No) | Yes | Yes/No |
Note: As Alert is not enabled on the above metric, the fields are left blank.
Sample Output
Cisco SIP Retry Reliable1Rxps Per Second
cisco.sip.retry.notifys
Metric Details
| Applicable for | Device |
| SNMP OID | 1.3.6.1.4.1.9.9.152.1.2.8.9.0 |
| Expression | NULL |
| Description | Monitors the number of Notify retries that have been sent by the user agent. [OID: 1.3.6.1.4.1.9.9.152.1.2.8.9.0] |
| Category | SNMP monitors |
| Collector Type | Gateway |
| Monitor Name | Cisco SIP Retry Statistics |
| Unit | psec |
Possible Inputs
| Metric | Input Value | Range of Values |
|---|---|---|
| Frequency | 10 | 1 – 1440 (mins) |
| Filter | ||
| Warning Operator | ||
| Warning Threshold | ||
| Warning Repeat Count | ||
| Critical Operator | ||
| Critical Threshold | ||
| Critical Repeat Count | ||
| Alert | No | Yes/No |
| Graph (Yes/No) | Yes | Yes/No |
Note: As Alert is not enabled on the above metric, the fields are left blank.
Sample Output
Cisco SIP Retry Notifys Per Second
cisco.sip.retry.refers
Metric Details
| Applicable for | Device |
| SNMP OID | 1.3.6.1.4.1.9.9.152.1.2.8.10.0 |
| Expression | NULL |
| Description | Monitors the number of refer retries that have been sent by the user agent. [OID: 1.3.6.1.4.1.9.9.152.1.2.8.10.0] |
| Category | SNMP monitors |
| Collector Type | Gateway |
| Monitor Name | Cisco SIP Retry Statistics |
| Unit | psec |
Possible Inputs
| Metric | Input Value | Range of Values |
|---|---|---|
| Frequency | 10 | 1 – 1440 (mins) |
| Filter | ||
| Warning Operator | ||
| Warning Threshold | ||
| Warning Repeat Count | ||
| Critical Operator | ||
| Critical Threshold | ||
| Critical Repeat Count | ||
| Alert | No | Yes/No |
| Graph (Yes/No) | Yes | Yes/No |
Note: As Alert is not enabled on the above metric, the fields are left blank.
Sample Output
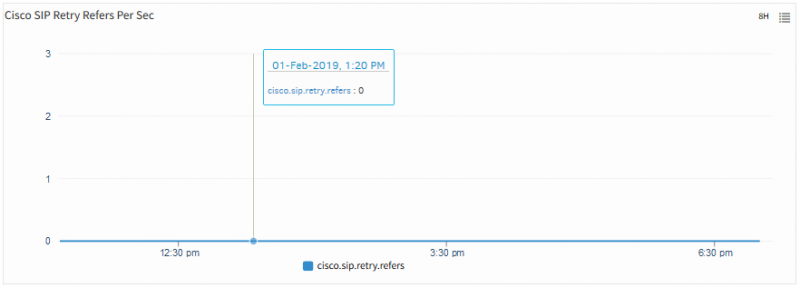
Cisco SIP Retry Refers Per Second
cisco.sip.retry.info
Metric Details
| Applicable for | Device |
| SNMP OID | 1.3.6.1.4.1.9.9.152.1.2.8.11.0 |
| Expression | NULL |
| Description | Monitors the number of Info retries that have been sent by the user agent. [OID: 1.3.6.1.4.1.9.9.152.1.2.8.11.0] |
| Category | SNMP monitors |
| Collector Type | Gateway |
| Monitor Name | Cisco SIP Retry Statistics |
| Unit | psec |
Possible Inputs
| Metric | Input Value | Range of Values |
|---|---|---|
| Frequency | 10 | 1 – 1440 (mins) |
| Filter | ||
| Warning Operator | ||
| Warning Threshold | ||
| Warning Repeat Count | ||
| Critical Operator | ||
| Critical Threshold | ||
| Critical Repeat Count | ||
| Alert | No | Yes/No |
| Graph (Yes/No) | Yes | Yes/No |
Note: As Alert is not enabled on the above metric, the fields are left blank.
Sample Output
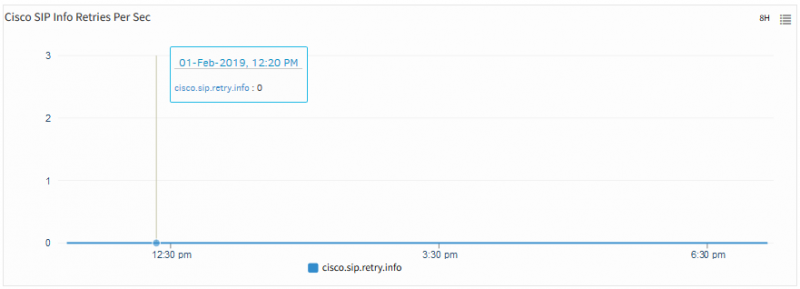
Cisco SIP Info Retries Per Second
cisco.sip.retry.subscribe
Metric Details
| Applicable for | Device |
| SNMP OID | 1.3.6.1.4.1.9.9.152.1.2.8.12.0 |
| Expression | NULL |
| Description | Monitors the number of Subscribe retries that have been sent by the user agent. [OID: 1.3.6.1.4.1.9.9.152.1.2.8.12.0] |
| Category | SNMP monitors |
| Collector Type | Gateway |
| Monitor Name | Cisco SIP Retry Statistics |
| Unit | psec |
Possible Inputs
| Metric | Input Value | Range of Values |
|---|---|---|
| Frequency | 10 | 1 – 1440 (mins) |
| Filter | ||
| Warning Operator | ||
| Warning Threshold | ||
| Warning Repeat Count | ||
| Critical Operator | ||
| Critical Threshold | ||
| Critical Repeat Count | ||
| Alert | No | Yes/No |
| Graph (Yes/No) | Yes | Yes/No |
Note: As Alert is not enabled on the above metric, the fields are left blank.
Sample Output
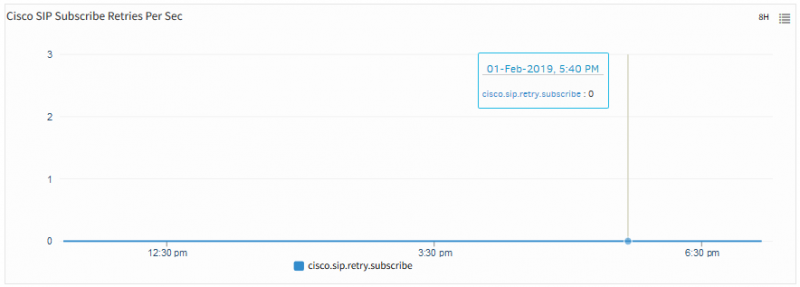
Cisco SIP Subscribe retries Per Second
cdsp.transcode.sess.avail.per.profile
Metric Details
| Applicable for | Device |
| SNMP OID | 1.3.6.1.4.1.9.9.86.1.6.3.1.3 |
| Expression | NULL |
| Description | It represents the total number of availablentranscode sessions per transcode profile from the configured maximum transcode sessions per transcode profile for the voice gateway. [OID: 1.3.6.1.4.1.9.9.86.1.6.3.1.3] |
| Category | SNMP monitors |
| Collector Type | Gateway |
| Monitor Name | Cisco Transcoding Session Statistics Per-Profile |
| Unit |
Possible Inputs
| Metric | Input Value | Range of Values |
|---|---|---|
| Frequency | 10 | 1 – 1440 (mins) |
| Filter | NULL | Not Applicable |
| Warning Operator | ||
| Warning Threshold | ||
| Warning Repeat Count | ||
| Critical Operator | ||
| Critical Threshold | ||
| Critical Repeat Count | ||
| Alert | No | Yes/No |
| Graph (Yes/No) | Yes | Yes/No |
Note: As Alert is not enabled on the above metric, the fields are left blank.
Sample Output
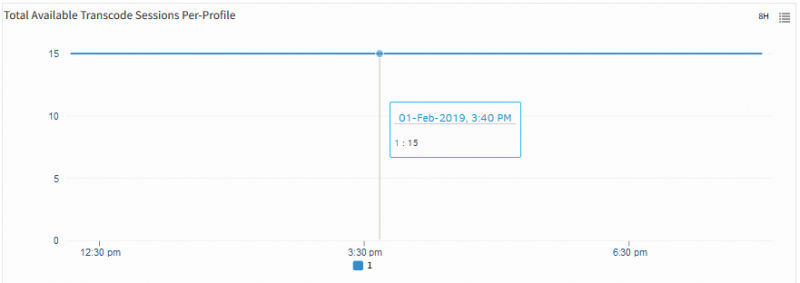
Total Available Transcode Sessions Per Profile
cdsp.transcode.sess.max.per.profile
Metric Details
| Applicable for | Device |
| SNMP OID | 1.3.6.1.4.1.9.9.86.1.6.3.1.2 |
| Expression | NULL |
| Description | Number of transcoding sessions configured for the DSP profile given in cdspTranscodeProfileId. [OID: 1.3.6.1.4.1.9.9.86.1.6.3.1.2] |
| Category | SNMP monitors |
| Collector Type | Gateway |
| Monitor Name | Cisco Transcoding Session Statistics Per-Profile |
| Unit |
Possible Inputs
| Metric | Input Value | Range of Values |
|---|---|---|
| Frequency | 10 | 1 – 1440 (mins) |
| Filter | NULL | Not Applicable |
| Warning Operator | ||
| Warning Threshold | ||
| Warning Repeat Count | ||
| Critical Operator | ||
| Critical Threshold | ||
| Critical Repeat Count | ||
| Alert | No | Yes/No |
| Graph (Yes/No) | Yes | Yes/No |
Note: As Alert is not enabled on the above metric, the fields are left blank.
Sample Output
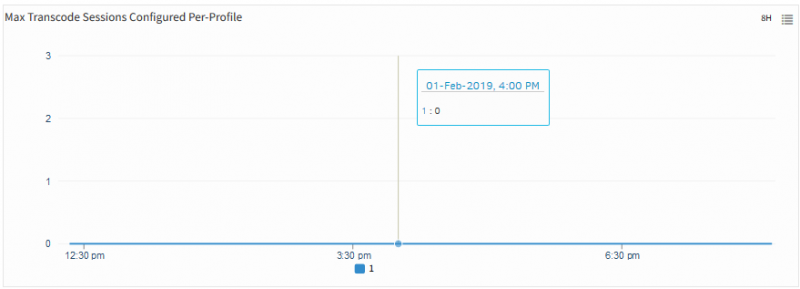
Max Transcode Sessions Configured Per-Profile
cdsp.transcode.sess.avail
Metric Details
| Applicable for | Device |
| SNMP OID | 1.3.6.1.4.1.9.9.86.1.7.1.0 |
| Expression | NULL |
| Description | It represents the total number of transcodensessions available for the voice gateway. The value is equal to summation of all the values returned by transcode profile object cdspTranscodeProfileMaxAvailSess. [OID: 1.3.6.1.4.1.9.9.86.1.7.1.0] |
| Category | SNMP monitors |
| Collector Type | Gateway |
| Monitor Name | Cisco Transcoding Sessions Statistics |
| Unit |
Possible Inputs
| Metric | Input Value | Range of Values |
|---|---|---|
| Frequency | 10 | 1 – 1440 (mins) |
| Filter | ||
| Warning Operator | ||
| Warning Threshold | ||
| Warning Repeat Count | ||
| Critical Operator | ||
| Critical Threshold | ||
| Critical Repeat Count | ||
| Alert | No | Yes/No |
| Graph (Yes/No) | Yes | Yes/No |
Note: As Alert is not enabled on the above metric, the fields are left blank.
Sample Output
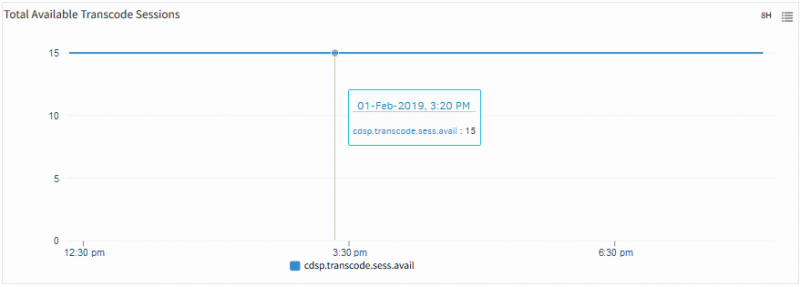
Total Available Transcode Sessions
cdsp.transcode.sess.unused
Metric Details
| Applicable for | Device |
| SNMP OID | 1.3.6.1.4.1.9.9.86.1.7.2.0 |
| Expression | NULL |
| Description | It represents the total of all unused transcoding sessions across all configured profiles. [OID: 1.3.6.1.4.1.9.9.86.1.7.2.0] |
| Category | SNMP monitors |
| Collector Type | Gateway |
| Monitor Name | Cisco Transcoding Sessions Statistics |
| Unit |
Possible Inputs
| Metric | Input Value | Range of Values |
|---|---|---|
| Frequency | 10 | 1 – 1440 (mins) |
| Filter | ||
| Warning Operator | ||
| Warning Threshold | ||
| Warning Repeat Count | ||
| Critical Operator | ||
| Critical Threshold | ||
| Critical Repeat Count | ||
| Alert | No | Yes/No |
| Graph (Yes/No) | Yes | Yes/No |
Note: As Alert is not enabled on the above metric, the fields are left blank.
Sample Output
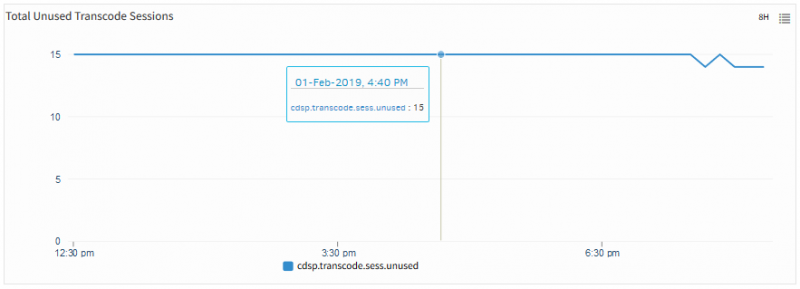
Total Unused Transcode Sessions
cisco.voice.gateway.active.calls.total
Metric Details
| Applicable for | Device |
| SNMP OID | 1.3.6.1.4.1.9.9.63.1.3.8.2.0 |
| Expression | NULL |
| Description | It monitors the total number of active call legs in the voice gateway. [OID: 1.3.6.1.4.1.9.9.63.1.3.8.2.0] |
| Category | SNMP monitors |
| Collector Type | Gateway |
| Monitor Name | Cisco Voice Gateway Active Calls Total |
| Unit |
Possible Inputs
| Metric | Input Value | Range of Values |
|---|---|---|
| Frequency | 10 | 1 – 1440 (mins) |
| Filter | ||
| Warning Operator | ||
| Warning Threshold | ||
| Warning Repeat Count | ||
| Critical Operator | ||
| Critical Threshold | ||
| Critical Repeat Count | ||
| Alert | No | Yes/No |
| Graph (Yes/No) | Yes | Yes/No |
Note: As Alert is not enabled on the above metric, the fields are left blank.
Sample Output
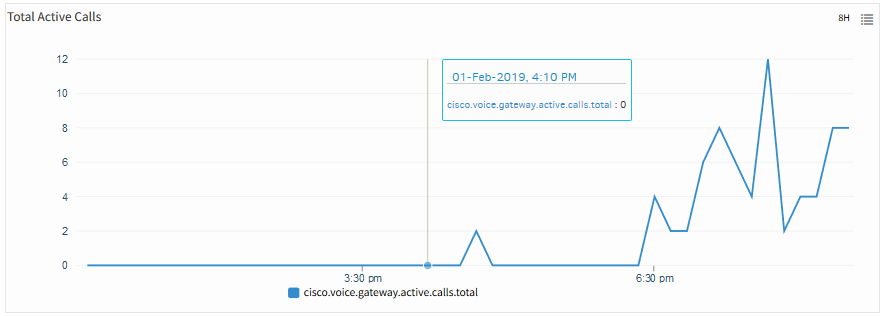
Total Active Calls
cisco.rttmon.jitter.rtp.avg
Metric Details
| Applicable for | Device |
| SNMP OID | 1.3.6.1.4.1.9.9.42.1.3.6.1.5 |
| Expression | NULL |
| Description | Monitors the average of inter-arrival jitter at source. [OID: 1.3.6.1.4.1.9.9.42.1.3.6.1.5] |
| Category | SNMP monitors |
| Collector Type | Gateway |
| Monitor Name | RTP Jitter - CISCO-RTTMON-RTP-MIB |
| Unit | ms |
Possible Inputs
| Metric | Input Value | Range of Values |
|---|---|---|
| Frequency | 10 | 1 – 1440 (mins) |
| Filter | NULL | Not Applicable |
| Warning Operator | ||
| Warning Threshold | ||
| Warning Repeat Count | ||
| Critical Operator | ||
| Critical Threshold | ||
| Critical Repeat Count | ||
| Alert | No | Yes/No |
| Graph (Yes/No) | Yes | Yes/No |
Note: As Alert is not enabled on the above metric, the fields are left blank.
Sample Output
No graph
cisco.rttmon.jitter.udp.avg
Metric Details
| Applicable for | Device |
| SNMP OID | 1.3.6.1.4.1.9.9.42.1.3.5.1.62 |
| Expression | NULL |
| Description | Monitors the average of positive and negative jitternvalues for SD and DS direction. [1.3.6.1.4.1.9.9.42.1.3.5.1.62] |
| Category | SNMP monitors |
| Collector Type | Gateway |
| Monitor Name | UDP Jitter - CISCO-RTTMON-MIB |
| Unit |
Possible Inputs
| Metric | Input Value | Range of Values |
|---|---|---|
| Frequency | 10 | 1 – 1440 (mins) |
| Filter | NULL | Not Applicable |
| Warning Operator | ||
| Warning Threshold | ||
| Warning Repeat Count | ||
| Critical Operator | ||
| Critical Threshold | ||
| Critical Repeat Count | ||
| Alert | No | Yes/No |
| Graph (Yes/No) | Yes | Yes/No |
Note: As Alert is not enabled on the above metric, the fields are left blank.
Sample Output
No graph
dial.peer.incoming.calls
Metric Details
| Applicable for | Device |
| SNMP OID | 1.3.6.1.4.1.9.9.63.1.3.8.4.1.1 |
| Expression | NULL |
| Description | It represents the total number of active calls that has selected the dialpeer as an incoming dialpeer. [OID: 1.3.6.1.4.1.9.9.63.1.3.8.4.1.1] |
| Category | SNMP monitors |
| Collector Type | Gateway |
| Monitor Name | Cisco Dial Peers Calls Usage |
| Unit |
Possible Inputs
| Metric | Input Value | Range of Values |
|---|---|---|
| Frequency | 10 | 1 – 1440 (mins) |
| Filter | NULL | Not Applicable |
| Warning Operator | ||
| Warning Threshold | ||
| Warning Repeat Count | ||
| Critical Operator | ||
| Critical Threshold | ||
| Critical Repeat Count | ||
| Alert | No | Yes/No |
| Graph (Yes/No) | Yes | Yes/No |
Note: As Alert is not enabled on the above metric, the fields are left blank.
Sample Output
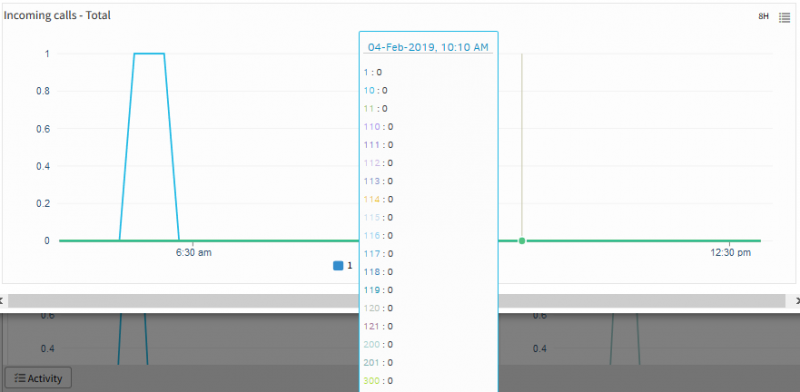
Incoming Calls Total
dial.peer.outgoing.calls
Metric Details
| Applicable for | Device |
| SNMP OID | 1.3.6.1.4.1.9.9.63.1.3.8.4.1.2 |
| Expression | NULL |
| Description | It represents the total number of active calls that has selected the dialpeer as an outgoing dialpeer. [OID: 1.3.6.1.4.1.9.9.63.1.3.8.4.1.2] |
| Category | SNMP monitors |
| Collector Type | Gateway |
| Monitor Name | Cisco Dial Peers Calls Usage |
| Unit |
Possible Inputs
| Metric | Input Value | Range of Values |
|---|---|---|
| Frequency | 10 | 1 – 1440 (mins) |
| Filter | NULL | Not Applicable |
| Warning Operator | ||
| Warning Threshold | ||
| Warning Repeat Count | ||
| Critical Operator | ||
| Critical Threshold | ||
| Critical Repeat Count | ||
| Alert | No | Yes/No |
| Graph (Yes/No) | Yes | Yes/No |
Note: As Alert is not enabled on the above metric, the fields are left blank.
Sample Output
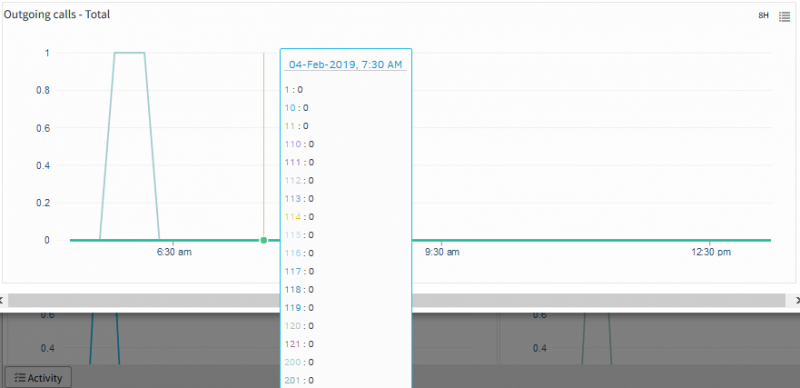
Outgoing Calls Total
dial.peer.calls.success
Metric Details
| Applicable for | Device |
| SNMP OID | 1.3.6.1.2.1.10.21.1.2.2.1.3 |
| Expression | NULL |
| Description | Number of completed calls to this peer. [OID: 1.3.6.1.2.1.10.21.1.2.2.1.3] |
| Category | SNMP monitors |
| Collector Type | Gateway |
| Monitor Name | Dial Peer Statistics |
| Unit |
Possible Inputs
| Metric | Input Value | Range of Values |
|---|---|---|
| Frequency | 10 | 1 – 1440 (mins) |
| Filter | NULL | Not Applicable |
| Warning Operator | ||
| Warning Threshold | ||
| Warning Repeat Count | ||
| Critical Operator | ||
| Critical Threshold | ||
| Critical Repeat Count | ||
| Alert | No | Yes/No |
| Graph (Yes/No) | Yes | Yes/No |
Note: As Alert is not enabled on the above metric, the fields are left blank.
Sample Output
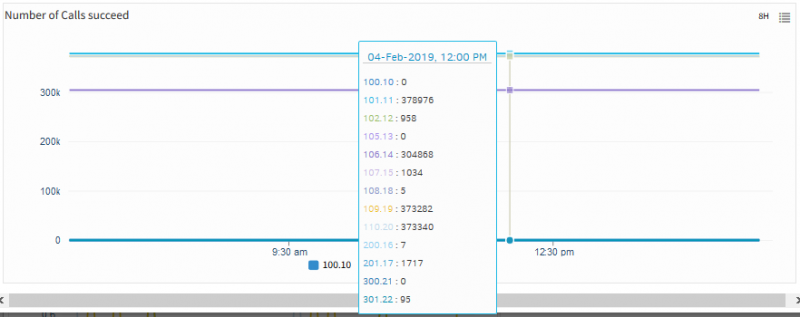
Number of Calls Succeed
dial.peer.calls.failed
Metric Details
| Applicable for | Device |
| SNMP OID | 1.3.6.1.2.1.10.21.1.2.2.1.4 |
| Expression | NULL |
| Description | Number of failed call attempts to this peer since system startup. [OID: 1.3.6.1.2.1.10.21.1.2.2.1.4] |
| Category | SNMP monitors |
| Collector Type | Gateway |
| Monitor Name | Dial Peer Statistics |
| Unit |
Possible Inputs
| Metric | Input Value | Range of Values |
|---|---|---|
| Frequency | 10 | 1 – 1440 (mins) |
| Filter | NULL | Not Applicable |
| Warning Operator | ||
| Warning Threshold | ||
| Warning Repeat Count | ||
| Critical Operator | ||
| Critical Threshold | ||
| Critical Repeat Count | ||
| Alert | No | Yes/No |
| Graph (Yes/No) | Yes | Yes/No |
Note: As Alert is not enabled on the above metric, the fields are left blank.
Sample Output
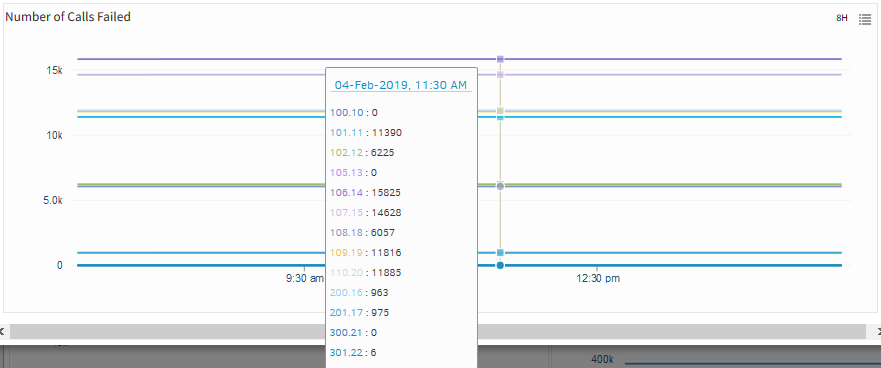
Number of Calls Failed
dial.peer.calls.accepted
Metric Details
| Applicable for | Device |
| SNMP OID | 1.3.6.1.2.1.10.21.1.2.2.1.5 |
| Expression | NULL |
| Description | Number of calls from this peer accepted since system startup. [OID: 1.3.6.1.2.1.10.21.1.2.2.1.5] |
| Category | SNMP monitors |
| Collector Type | Gateway |
| Monitor Name | Dial Peer Statistics |
| Unit |
Possible Inputs
| Metric | Input Value | Range of Values |
|---|---|---|
| Frequency | 10 | 1 – 1440 (mins) |
| Filter | NULL | Not Applicable |
| Warning Operator | ||
| Warning Threshold | ||
| Warning Repeat Count | ||
| Critical Operator | ||
| Critical Threshold | ||
| Critical Repeat Count | ||
| Alert | No | Yes/No |
| Graph (Yes/No) | Yes | Yes/No |
Note: As Alert is not enabled on the above metric, the fields are left blank.
Sample Output
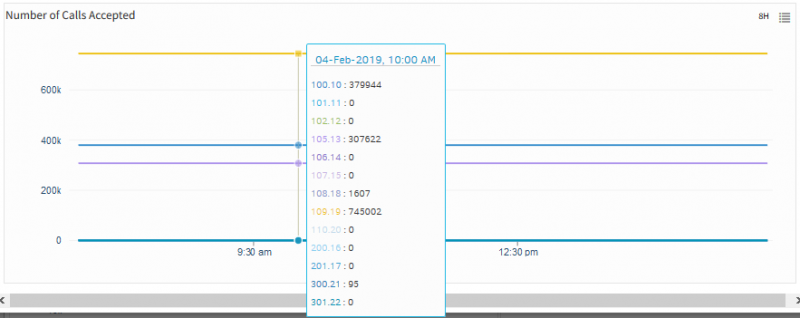
Number of Calls Accepted
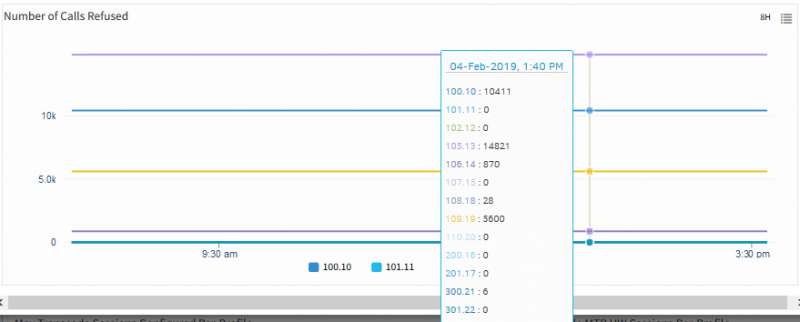
dial.peer.calls.refused
Metric Details
| Applicable for | Device |
| SNMP OID | 1.3.6.1.2.1.10.21.1.2.2.1.6 |
| Expression | NULL |
| Description | Number of calls from this peer refused since system startup. [OID: 1.3.6.1.2.1.10.21.1.2.2.1.6] |
| Category | SNMP monitors |
| Collector Type | Gateway |
| Monitor Name | Dial Peer Statistics |
| Unit |
Possible Inputs
| Metric | Input Value | Range of Values |
|---|---|---|
| Frequency | 10 | 1 – 1440 (mins) |
| Filter | NULL | Not Applicable |
| Warning Operator | ||
| Warning Threshold | ||
| Warning Repeat Count | ||
| Critical Operator | ||
| Critical Threshold | ||
| Critical Repeat Count | ||
| Alert | No | Yes/No |
| Graph (Yes/No) | Yes | Yes/No |
Note: As Alert is not enabled on the above metric, the fields are left blank.
Sample Output