Description
Applicable on the NetScaler appliance. It can be one of the NetScaler MPX, SDX or the VPX series. This template has been tested on a VPX, the software-based virtual appliance. Monitors CPU utilization, memory utilization, disk utilization, cache hit ratio, HTTP stats, current connection stats, high availability status, servers status, service group member stats, services stats, services monitoring status, services status, SSL certificate expiry period, VServer stats, system fan speed, voltage, temperature and power supply status.
Prerequisites
SNMP should be enabled in end device and device should support NS-ROOT-MIB OIDs and SNMP credentials should be attached against the device in portal.
How to Apply: This template is All instance selection based and Automatic select instance based. It will not ask user to select any instance (s) while assigning it to a device.
Metric Parameters
| Parameter | Description |
|---|---|
| Frequency | Warning Threshold | If the metric value satisfies the condition defined along with Warning Threshold value, then a notification is sent to the user. |
| Critical Threshold | If the metric value satisfies the condition defined along with Critical Threshold value, then a notification is sent to the user. |
| Alert | The alert value can be set to either Yes or No. If it is Yes, then an alert message is sent to the user. |
Metrics
system.memory.util.percent
Metric Details
| Applicable for | Device |
| SNMP OID | 1.3.6.1.4.1.5951.4.1.1.41.2.0 |
| Expression | NULL |
| Description | Monitors the percentage of memory utilization on NetScaler. [OID: 1.3.6.1.4.1.5951.4.1.1.41.2.0] |
| Category | SNMP monitors |
| Collector Type | Gateway |
| Monitor Name | Netscaler Appliance Monitoring |
| Unit | % |
Possible Inputs
| Metric | Input Value | Range of Values |
|---|---|---|
| Frequency | 15 | 1 – 1440 (mins) |
| Filter | ||
| Warning Operator | GREATER_THAN_EQUAL | Ends with, ==, !=, >=, <=, >, <, In Range, Out of range, Equals, Not equals, Equals Ignore Case, Not Equals Ignore Case, Contains, Not contains, Regex match, Regex no match, In string list, Not in string list, In List, Not in list, Starts with |
| Warning Threshold | 85 | 0-100 |
| Warning Repeat Count | 1 | 1-12 |
| Critical Operator | GREATER_THAN_EQUAL | Ends with, ==, !=, >=, <=, >, <, In Range, Out of range, Equals, Not equals, Equals Ignore Case, Not Equals Ignore Case, Contains, Not contains, Regex match, Regex no match, In string list, Not in string list, In List, Not in list, Starts with |
| Critical Threshold | 90 | 0-100 |
| Critical Repeat Count | 1 | 1-12 |
| Alert | Yes | Yes/No |
| Graph (Yes/No) | Yes | Yes/No |
Sample Output
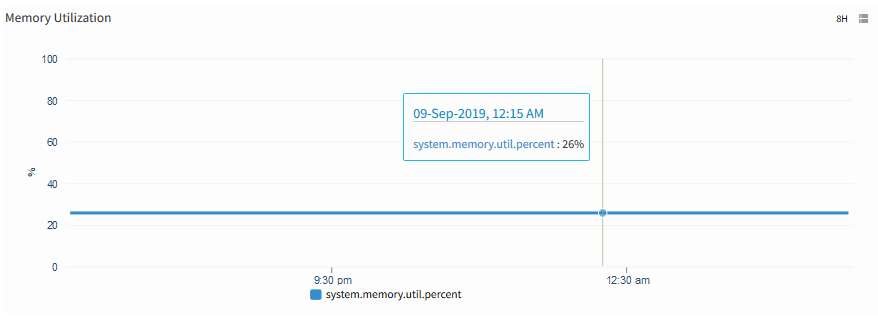
Memory Utilization
citrix.netscaler.cache.hit.percent
Metric Details
| Applicable for | Device |
| SNMP OID | 1.3.6.1.4.1.5951.4.1.1.49.12.0 |
| Expression | NULL |
| Description | Monitors the cache hits as percentage of the total number of requests. [OID: 1.3.6.1.4.1.5951.4.1.1.49.12.0] |
| Category | SNMP monitors |
| Collector Type | Gateway |
| Monitor Name | Netscaler Appliance Monitoring |
| Unit | % |
Possible Inputs
| Metric | Input Value | Range of Values |
|---|---|---|
| Frequency | 15 | 1 – 1440 (mins) |
| Filter | ||
| Warning Operator | LESS_THAN | Ends with, ==, !=, >=, <=, >, <, In Range, Out of range, Equals, Not equals, Equals Ignore Case, Not Equals Ignore Case, Contains, Not contains, Regex match, Regex no match, In string list, Not in string list, In List, Not in list, Starts with |
| Warning Threshold | 95 | 0-100 |
| Warning Repeat Count | 1 | 1-12 |
| Critical Operator | LESS_THAN | Ends with, ==, !=, >=, <=, >, <, In Range, Out of range, Equals, Not equals, Equals Ignore Case, Not Equals Ignore Case, Contains, Not contains, Regex match, Regex no match, In string list, Not in string list, In List, Not in list, Starts with |
| Critical Threshold | 90 | 0-100 |
| Critical Repeat Count | 1 | 1-12 |
| Alert | Yes | Yes/No |
| Graph (Yes/No) | Yes | Yes/No |
Sample Output
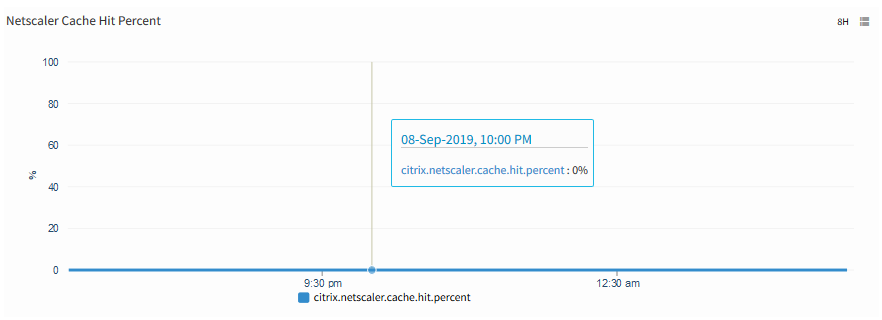
Netscaler Cache Hit Percent
citrix.netscaler.servers.httpresponses
Metric Details
| Applicable for | Device |
| SNMP OID | 1.3.6.1.4.1.5951.4.1.1.48.53.0 |
| Expression | NULL |
| Description | Monitors the total number of HTTP responses sent per second. [OID: 1.3.6.1.4.1.5951.4.1.1.48.53.0] |
| Category | SNMP monitors |
| Collector Type | Gateway |
| Monitor Name | Netscaler Appliance Monitoring |
| Unit | psec |
Possible Inputs
| Metric | Input Value | Range of Values |
|---|---|---|
| Frequency | 15 | 1 – 1440 (mins) |
| Filter | ||
| Warning Operator | ||
| Warning Threshold | ||
| Warning Repeat Count | ||
| Critical Operator | ||
| Critical Threshold | ||
| Critical Repeat Count | ||
| Alert | No | Yes/No |
| Graph (Yes/No) | Yes | Yes/No |
Sample Output
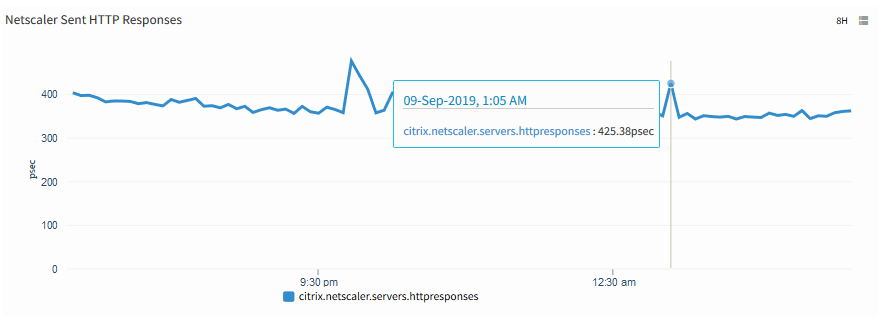
Netscaler Sent Http Response
citrix.netscaler.clients.httprequests
Metric Details
| Applicable for | Device |
| SNMP OID | 1.3.6.1.4.1.5951.4.1.1.48.67.0 |
| Expression | NULL |
| Description | Monitors the total number of HTTP requests received per second. [OID: 1.3.6.1.4.1.5951.4.1.1.48.67.0] |
| Category | SNMP monitors |
| Collector Type | Gateway |
| Monitor Name | Netscaler Appliance Monitoring |
| Unit | psec |
Possible Inputs
| Metric | Input Value | Range of Values |
|---|---|---|
| Frequency | 15 | 1 – 1440 (mins) |
| Filter | ||
| Warning Operator | ||
| Warning Threshold | ||
| Warning Repeat Count | ||
| Critical Operator | ||
| Critical Threshold | ||
| Critical Repeat Count | ||
| Alert | No | Yes/No |
| Graph (Yes/No) | Yes | Yes/No |
Sample Output
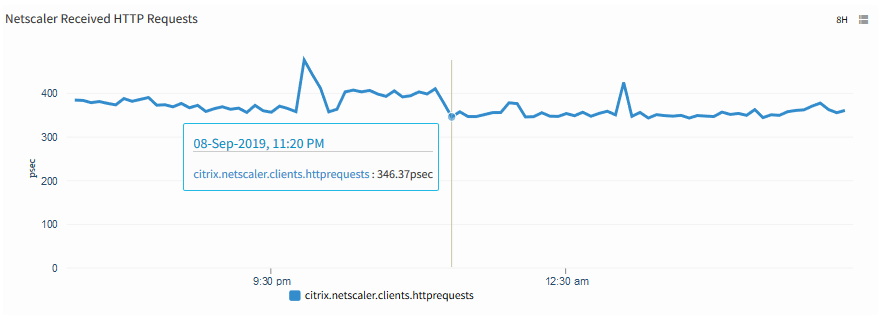
Netscaler Received HTTP Requests
citrix.netscaler.tcp.serverconn
Metric Details
| Applicable for | Device |
| SNMP OID | 1.3.6.1.4.1.5951.4.1.1.46.1.0 |
| Expression | NULL |
| Description | Monitors the server connections, including connections in the Opening, Established, and Closing state. [OID: 1.3.6.1.4.1.5951.4.1.1.46.1.0] |
| Category | SNMP monitors |
| Collector Type | Gateway |
| Monitor Name | Netscaler Appliance Monitoring |
| Unit | None |
Possible Inputs
| Metric | Input Value | Range of Values |
|---|---|---|
| Frequency | 15 | 1 – 1440 (mins) |
| Filter | ||
| Warning Operator | ||
| Warning Threshold | ||
| Warning Repeat Count | ||
| Critical Operator | ||
| Critical Threshold | ||
| Critical Repeat Count | ||
| Alert | No | Yes/No |
| Graph (Yes/No) | Yes | Yes/No |
Sample Output
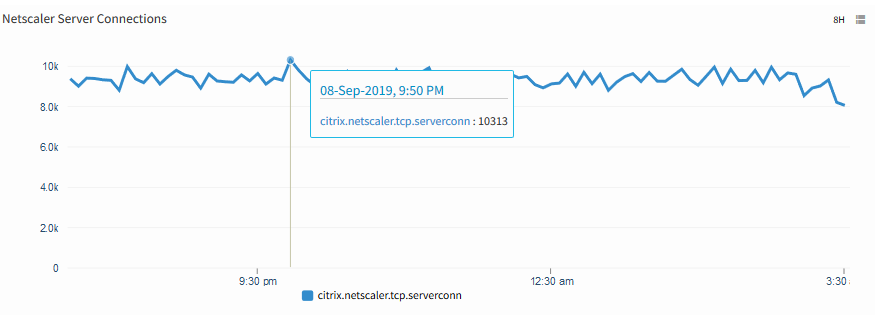
Netscaler Server Connections
citrix.netscaler.tcp.clientconn
Metric Details
| Applicable for | Device |
| SNMP OID | 1.3.6.1.4.1.5951.4.1.1.46.2.0 |
| Expression | NULL |
| Description | Monitors the client connections, including connections in the Opening, Established, and Closing state. [OID: 1.3.6.1.4.1.5951.4.1.1.46.2.0] |
| Category | SNMP monitors |
| Collector Type | Gateway |
| Monitor Name | Netscaler Appliance Monitoring |
| Unit | None |
Possible Inputs
| Metric | Input Value | Range of Values |
|---|---|---|
| Frequency | 15 | 1 – 1440 (mins) |
| Filter | ||
| Warning Operator | ||
| Warning Threshold | ||
| Warning Repeat Count | ||
| Critical Operator | ||
| Critical Threshold | ||
| Critical Repeat Count | ||
| Alert | No | Yes/No |
| Graph (Yes/No) | Yes | Yes/No |
Sample Output
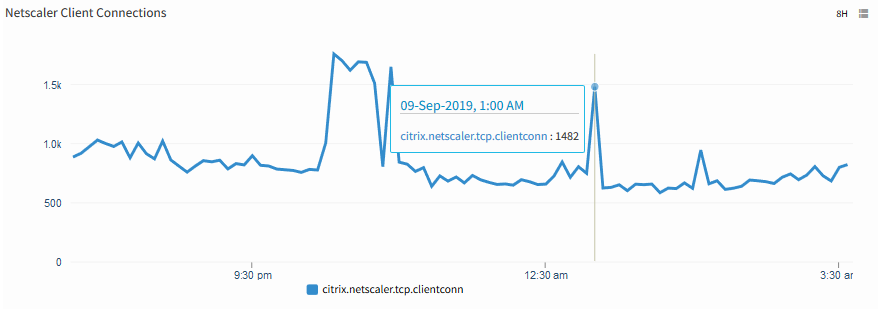
Netscaler Client Connections
citrix.netscaler.tcp.serverconn.estb
Metric Details
| Applicable for | Device |
| SNMP OID | 1.3.6.1.4.1.5951.4.1.1.46.10.0 |
| Expression | NULL |
| Description | Monitors the current server connections in the Established state, which indicates that data transfer can occur between the NetScaler and the server. [OID: 1.3.6.1.4.1.5951.4.1.1.46.10.0] |
| Category | SNMP monitors |
| Collector Type | Gateway |
| Monitor Name | Netscaler Appliance Monitoring |
| Unit | None |
Possible Inputs
| Metric | Input Value | Range of Values |
|---|---|---|
| Frequency | 15 | 1 – 1440 (mins) |
| Filter | ||
| Warning Operator | ||
| Warning Threshold | ||
| Warning Repeat Count | ||
| Critical Operator | ||
| Critical Threshold | ||
| Critical Repeat Count | ||
| Alert | No | Yes/No |
| Graph (Yes/No) | Yes | Yes/No |
Sample Output
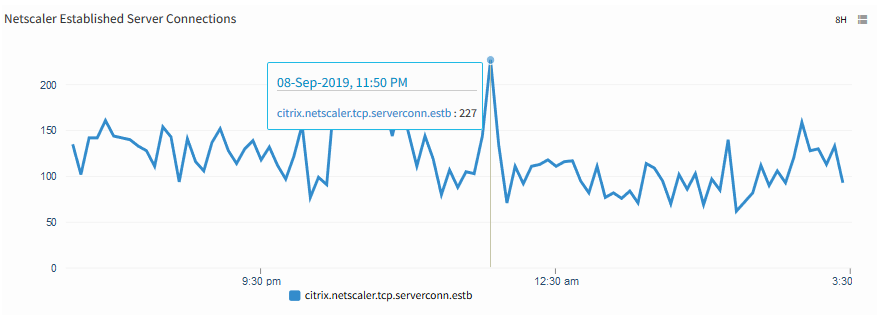
Netscaler Established Server Connections
citrix.netscaler.tcp.clientconns.estb
Metric Details
| Applicable for | Device |
| SNMP OID | 1.3.6.1.4.1.5951.4.1.1.46.12.0 |
| Expression | NULL |
| Description | Monitors the current client connections in the Established state, which indicates that data transfer can occur between the NetScaler and the client. [OID: 1.3.6.1.4.1.5951.4.1.1.46.12.0] |
| Category | SNMP monitors |
| Collector Type | Gateway |
| Monitor Name | Netscaler Appliance Monitoring |
| Unit | None |
Possible Inputs
| Metric | Input Value | Range of Values |
|---|---|---|
| Frequency | 15 | 1 – 1440 (mins) |
| Filter | ||
| Warning Operator | ||
| Warning Threshold | ||
| Warning Repeat Count | ||
| Critical Operator | ||
| Critical Threshold | ||
| Critical Repeat Count | ||
| Alert | No | Yes/No |
| Graph (Yes/No) | Yes | Yes/No |
Sample Output
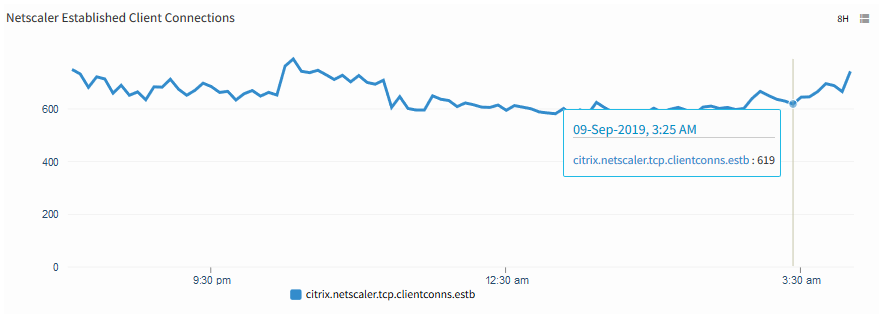
Netscaler Established Client Connections
citrix.netscaler.highavailability.status
Metric Details
| Applicable for | Device |
| SNMP OID | 1.3.6.1.4.1.5951.4.1.1.23.23.0, 1.3.6.1.4.1.5951.4.1.1.23.24.0 |
| Expression | if((haCurStatus==1),haCurState,-1) |
| Description | Monitors the high-availability system state. Possible values are 0 - unknown, 1- init: Indicates that the node is in the process of becoming part of the high availability configuration, 2- down, 3 - up: Indicates that the node is accessible and can function as either a primary or secondary node, 4- partialFail: Indicates that one of the high availability monitored interfaces has failed because of a card or link failure. This state triggers a failover, 5 -monitorFail, 6 -monitorOk, 7- completeFail: Indicates that all the interfaces of the node are unusable, because the interfaces on which high availability monitoring is enabled are not connected or are manually disabled. This state triggers a failover, 8- dumb: Indicates that the node is in listening mode. It does not participate in high availability transitions or transfer configuration from the peer node. This is a configured value, not a statistic, 9- disabled: Indicates that the high availability status of the node has been manually disabled. Synchronization and propagation cannot take place between the peer nodes, 10- partialFailSsl: Indicates that the SSL card has failed. This state triggers a failover, 11- routemonitorFail: Indicates that the route monitor has failed. This state triggers a failover. [OIDs: 1.3.6.1.4.1.5951.4.1.1.23.23.0, 1.3.6.1.4.1.5951.4.1.1.23.24.0] |
| Category | SNMP monitors |
| Collector Type | Gateway |
| Monitor Name | Netscaler Appliance Monitoring |
| Unit |
Possible Inputs
| Metric | Input Value | Range of Values |
|---|---|---|
| Frequency | 15 | 1 – 1440 (mins) |
| Filter | ||
| Warning Operator | IN_LIST | Ends with, ==, !=, >=, <=, >, <, In Range, Out of range, Equals, Not equals, Equals Ignore Case, Not Equals Ignore Case, Contains, Not contains, Regex match, Regex no match, In string list, Not in string list, In List, Not in list, Starts with |
| Warning Threshold | 0,1,5,6 | [{"0":"unknown"},{"1":"init"},{"2":"down"},{"3":"up"},{"4":"partialFail"},{"5":"monitorFail"},{"6":"monitorOk"},{"7":"completeFail"},{"8":"dumb"},{"9":"disabled"},{"10":"partialFailSsl"},{"11":"routemonitorFail"},{"-1":"High_Availability_Not_Configured"}] |
| Warning Repeat Count | 1 | 1-12 |
| Critical Operator | IN_LIST | Ends with, ==, !=, >=, <=, >, <, In Range, Out of range, Equals, Not equals, Equals Ignore Case, Not Equals Ignore Case, Contains, Not contains, Regex match, Regex no match, In string list, Not in string list, In List, Not in list, Starts with |
| Critical Threshold | 2,4,7,8,9,10,11 | [{"0":"unknown"},{"1":"init"},{"2":"down"},{"3":"up"},{"4":"partialFail"},{"5":"monitorFail"},{"6":"monitorOk"},{"7":"completeFail"},{"8":"dumb"},{"9":"disabled"},{"10":"partialFailSsl"},{"11":"routemonitorFail"},{"-1":"High_Availability_Not_Configured"}] |
| Critical Repeat Count | 1 | 1-12 |
| Alert | Yes | Yes/No |
| Graph (Yes/No) | Yes | Yes/No |
Sample Output
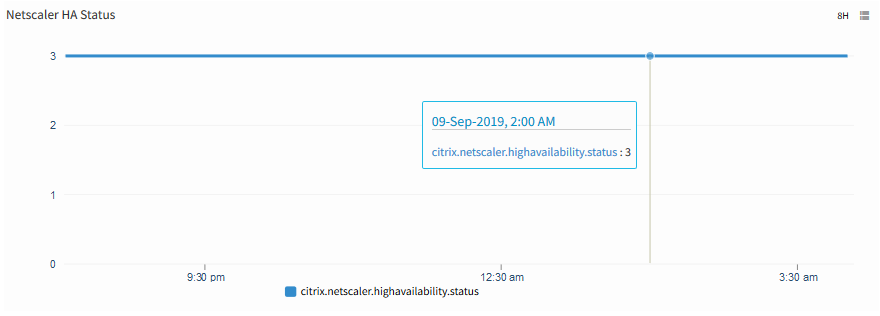
Netscaler HA Status
citrix.netscaler.highavailability.lasttransition
Metric Details
| Applicable for | Device |
| SNMP OID | 1.3.6.1.4.1.5951.4.1.1.23.1.0, 1.3.6.1.4.1.5951.4.1.1.23.2.0, 1.3.6.1.4.1.5951.4.1.1.23.3.0, 1.3.6.1.4.1.5951.4.1.1.23.4.0, 1.3.6.1.4.1.5951.4.1.1.23.5.0 |
| Expression | if((haPeerState!=0),(haTimeofLastStateTransition/100),1001) |
| Description | Monitors the time since the NetScaler underwent a state change from primary to secondary or vice-versa. [OIDs: 1.3.6.1.4.1.5951.4.1.1.23.1.0, 1.3.6.1.4.1.5951.4.1.1.23.2.0, 1.3.6.1.4.1.5951.4.1.1.23.3.0, 1.3.6.1.4.1.5951.4.1.1.23.4.0, 1.3.6.1.4.1.5951.4.1.1.23.5.0] |
| Category | SNMP monitors |
| Collector Type | Gateway |
| Monitor Name | Netscaler Appliance Monitoring |
| Unit | s |
Possible Inputs
| Metric | Input Value | Range of Values |
|---|---|---|
| Frequency | 15 | 1 – 1440 (mins) |
| Filter | ||
| Warning Operator | ||
| Warning Threshold | ||
| Warning Repeat Count | ||
| Critical Operator | LESS_THAN_EQUAL | Ends with, ==, !=, >=, <=, >, <, In Range, Out of range, Equals, Not equals, Equals Ignore Case, Not Equals Ignore Case, Contains, Not contains, Regex match, Regex no match, In string list, Not in string list, In List, Not in list, Starts with |
| Critical Threshold | 1000 | 0 - 4294967295 |
| Critical Repeat Count | 1 | 1-12 |
| Alert | Yes | Yes/No |
| Graph (Yes/No) | No | Yes/No |
Sample Output
No graph
system.cpu.utilization
Metric Details
| Applicable for | Device |
| SNMP OID | 1.3.6.1.4.1.5951.4.1.1.41.6.1.2 |
| Expression | NULL |
| Description | Monitors the CPU utilization percentage. [OIDs: 1.3.6.1.4.1.5951.4.1.1.41.6.1.1, 1.3.6.1.4.1.5951.4.1.1.41.6.1.2] |
| Category | SNMP monitors |
| Collector Type | Gateway |
| Monitor Name | Netscaler CPU Utilization |
| Unit | % |
Possible Inputs
| Metric | Input Value | Range of Values |
|---|---|---|
| Frequency | 15 | 1 – 1440 (mins) |
| Filter | NULL | Not Applicable |
| Warning Operator | GREATER_THAN_EQUAL | Ends with, ==, !=, >=, <=, >, <, In Range, Out of range, Equals, Not equals, Equals Ignore Case, Not Equals Ignore Case, Contains, Not contains, Regex match, Regex no match, In string list, Not in string list, In List, Not in list, Starts with |
| Warning Threshold | 85 | 0-100 |
| Warning Repeat Count | 1 | 1-12 |
| Critical Operator | GREATER_THAN_EQUAL | Ends with, ==, !=, >=, <=, >, <, In Range, Out of range, Equals, Not equals, Equals Ignore Case, Not Equals Ignore Case, Contains, Not contains, Regex match, Regex no match, In string list, Not in string list, In List, Not in list, Starts with |
| Critical Threshold | 90 | 0-100 |
| Critical Repeat Count | 1 | 1-12 |
| Alert | Yes | Yes/No |
| Graph (Yes/No) | Yes | Yes/No |
Sample Output
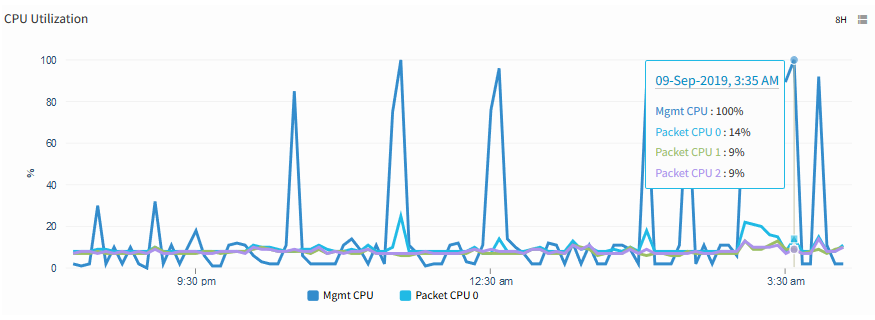
CPU Utilization
system.disk.util.percent
Metric Details
| Applicable for | Device |
| SNMP OID | 1.3.6.1.4.1.5951.4.1.1.41.8.1.2, 1.3.6.1.4.1.5951.4.1.1.41.8.1.3, 1.3.6.1.4.1.5951.4.1.1.41.8.1.4, 1.3.6.1.4.1.5951.4.1.1.41.8.1.5 |
| Expression | sysHealthDiskPerusage |
| Description | Monitors the Percentage of the disk space used. [OIDs: 1.3.6.1.4.1.5951.4.1.1.41.8.1.1, 1.3.6.1.4.1.5951.4.1.1.41.8.1.2, 1.3.6.1.4.1.5951.4.1.1.41.8.1.3, 1.3.6.1.4.1.5951.4.1.1.41.8.1.4, 1.3.6.1.4.1.5951.4.1.1.41.8.1.5] |
| Category | SNMP monitors |
| Collector Type | Gateway |
| Monitor Name | Netscaler Disk Utilization |
| Unit | % |
Possible Inputs
| Metric | Input Value | Range of Values |
|---|---|---|
| Frequency | 15 | 1 – 1440 (mins) |
| Filter | NULL | Not Applicable |
| Warning Operator | GREATER_THAN_EQUAL | Ends with, ==, !=, >=, <=, >, <, In Range, Out of range, Equals, Not equals, Equals Ignore Case, Not Equals Ignore Case, Contains, Not contains, Regex match, Regex no match, In string list, Not in string list, In List, Not in list, Starts with |
| Warning Threshold | 85 | 0-100 |
| Warning Repeat Count | 1 | 1-12 |
| Critical Operator | GREATER_THAN_EQUAL | Ends with, ==, !=, >=, <=, >, <, In Range, Out of range, Equals, Not equals, Equals Ignore Case, Not Equals Ignore Case, Contains, Not contains, Regex match, Regex no match, In string list, Not in string list, In List, Not in list, Starts with |
| Critical Threshold | 90 | 0-100 |
| Critical Repeat Count | 1 | 1-12 |
| Alert | Yes | Yes/No |
| Graph (Yes/No) | Yes | Yes/No |
Sample Output
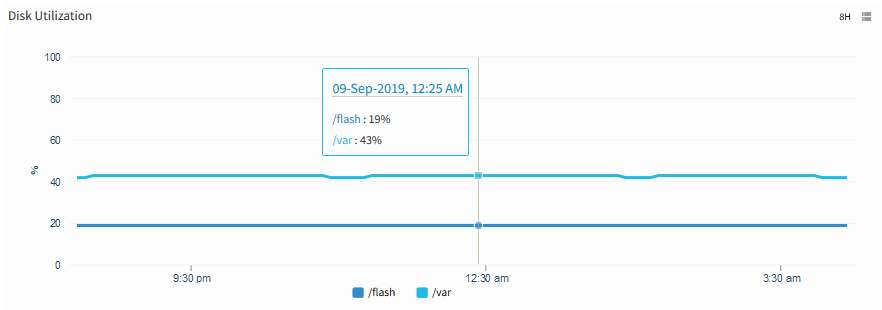
Disk Utilization
citrix.netscaler.server.status
Metric Details
| Applicable for | Device |
| SNMP OID | 1.3.6.1.4.1.5951.4.1.2.2.1.2, 1.3.6.1.4.1.5951.4.1.2.2.1.3 |
| Expression | serverState |
| Description | Monitors the state of the server. Possible values are 1- down, 2- unknown,3- busy, 4- outOfService, 5- transitionToOutOfService, 7- up, 8- transitionToOutOfServiceDown. [OIDs: 1.3.6.1.4.1.5951.4.1.2.2.1.1, 1.3.6.1.4.1.5951.4.1.2.2.1.2, 1.3.6.1.4.1.5951.4.1.2.2.1.3] |
| Category | SNMP monitors |
| Collector Type | Gateway |
| Monitor Name | Netscaler Servers Status |
| Unit |
Possible Inputs
| Metric | Input Value | Range of Values |
|---|---|---|
| Frequency | 15 | 1 – 1440 (mins) |
| Filter | NULL | Not Applicable |
| Warning Operator | ||
| Warning Threshold | ||
| Warning Repeat Count | ||
| Critical Operator | NOT_EQUAL | Ends with, ==, !=, >=, <=, >, <, In Range, Out of range, Equals, Not equals, Equals Ignore Case, Not Equals Ignore Case, Contains, Not contains, Regex match, Regex no match, In string list, Not in string list, In List, Not in list, Starts with |
| Critical Threshold | 7 | [{"1":"down"},{"2":"unknown"},{"3":"busy"},{"4":"outOfService"},{"5":"transitionToOutOfService"},{"7":"up"},{"8":"transitionToOutOfServiceDown"}] |
| Critical Repeat Count | 1 | 1-12 |
| Alert | Yes | Yes/No |
| Graph (Yes/No) | Yes | Yes/No |
Sample Output
No graph
citrix.netscaler.monprobe.status
Metric Details
| Applicable for | Device |
| SNMP OID | 1.3.6.1.4.1.5951.4.1.2.10.1.3 |
| Expression | monitorState |
| Description | Monitors the service monitor status. Possible values are 0- monitorStateNotProbed, 1- monitorStateDown, 2- monitorStateUnknown, 6- monitorStateDisabled, 7- monitorStateUp. [OIDs: 1.3.6.1.4.1.5951.4.1.2.10.1.1, 1.3.6.1.4.1.5951.4.1.2.10.1.3] |
| Category | SNMP monitors |
| Collector Type | Gateway |
| Monitor Name | Netscaler Service Monitors Status |
| Unit |
Possible Inputs
| Metric | Input Value | Range of Values |
|---|---|---|
| Frequency | 15 | 1 – 1440 (mins) |
| Filter | NULL | Not Applicable |
| Warning Operator | ||
| Warning Threshold | ||
| Warning Repeat Count | ||
| Critical Operator | IN_LIST | Ends with, ==, !=, >=, <=, >, <, In Range, Out of range, Equals, Not equals, Equals Ignore Case, Not Equals Ignore Case, Contains, Not contains, Regex match, Regex no match, In string list, Not in string list, In List, Not in list, Starts with |
| Critical Threshold | 1,2 | [{"0":"monitorStateNotProbed"},{"1":"monitorStateDown"},{"2":"monitorStateUnknown"},{"6":"monitorStateDisabled"},{"7":"monitorStateUp"}] |
| Critical Repeat Count | 1 | 1-12 |
| Alert | Yes | Yes/No |
| Graph (Yes/No) | No | Yes/No |
Sample Output
No graph
citrix.netscaler.monprobes.failed
Metric Details
| Applicable for | Device |
| SNMP OID | 1.3.6.1.4.1.5951.4.1.2.10.1.10 |
| Expression | NULL |
| Description | Monitors the number of monitoring probes failed. [OIDs: 1.3.6.1.4.1.5951.4.1.2.10.1.1, 1.3.6.1.4.1.5951.4.1.2.10.1.10, 1.3.6.1.4.1.5951.4.1.2.9.1.1] |
| Category | SNMP monitors |
| Collector Type | Gateway |
| Monitor Name | Netscaler Service Monitors Status |
| Unit | psec |
Possible Inputs
| Metric | Input Value | Range of Values |
|---|---|---|
| Frequency | 15 | 1 – 1440 (mins) |
| Filter | NULL | Not Applicable |
| Warning Operator | ||
| Warning Threshold | ||
| Warning Repeat Count | ||
| Critical Operator | ||
| Critical Threshold | ||
| Critical Repeat Count | ||
| Alert | No | Yes/No |
| Graph (Yes/No) | No | Yes/No |
Sample Output
No graph
citrix.netscaler.sslcert.daysto.expire
Metric Details
| Applicable for | Device |
| SNMP OID | 1.3.6.1.4.1.5951.4.1.1.56.1.1.5, 1.3.6.1.4.1.5951.4.1.1.56.1.1.2 |
| Expression | sslDaysToExpire |
| Description | Monitors the number of days remaining for the certificate to expire. [OIDs: 1.3.6.1.4.1.5951.4.1.1.56.1.1.1, 1.3.6.1.4.1.5951.4.1.1.56.1.1.2, 1.3.6.1.4.1.5951.4.1.1.56.1.1.5] |
| Category | SNMP monitors |
| Collector Type | Gateway |
| Monitor Name | Netscaler SSL Certificate Expiry Period |
| Unit | Days |
Possible Inputs
| Metric | Input Value | Range of Values |
|---|---|---|
| Frequency | 15 | 1 – 1440 (mins) |
| Filter | sslDaysToExpire <= 30 | |
| Warning Operator | LESS_THAN_EQUAL | Ends with, ==, !=, >=, <=, >, <, In Range, Out of range, Equals, Not equals, Equals Ignore Case, Not Equals Ignore Case, Contains, Not contains, Regex match, Regex no match, In string list, Not in string list, In List, Not in list, Starts with |
| Warning Threshold | 20 | 0-365 |
| Warning Repeat Count | 1 | 1-12 |
| Critical Operator | LESS_THAN_EQUAL | Ends with, ==, !=, >=, <=, >, <, In Range, Out of range, Equals, Not equals, Equals Ignore Case, Not Equals Ignore Case, Contains, Not contains, Regex match, Regex no match, In string list, Not in string list, In List, Not in list, Starts with |
| Critical Threshold | 15 | 0-365 |
| Critical Repeat Count | 1 | 1-12 |
| Alert | Yes | Yes/No |
| Graph (Yes/No) | No | Yes/No |
Sample Output
No graph
citrix.netscaler.system.fanspeed
Metric Details
| Applicable for | Device |
| SNMP OID | 1.3.6.1.4.1.5951.4.1.1.41.7.1.2 |
| Expression | NULL |
| Description | Monitors the system fan speed. [OIDs: 1.3.6.1.4.1.5951.4.1.1.41.7.1.1, 1.3.6.1.4.1.5951.4.1.1.41.7.1.2] |
| Category | SNMP monitors |
| Collector Type | Gateway |
| Monitor Name | Netscaler System Fan Speed |
| Unit | rpm |
Possible Inputs
| Metric | Input Value | Range of Values |
|---|---|---|
| Frequency | 15 | 1 – 1440 (mins) |
| Filter | Name Contains Fan | |
| Warning Operator | ||
| Warning Threshold | ||
| Warning Repeat Count | ||
| Critical Operator | GREATER_THAN_EQUAL | Ends with, ==, !=, >=, <=, >, <, In Range, Out of range, Equals, Not equals, Equals Ignore Case, Not Equals Ignore Case, Contains, Not contains, Regex match, Regex no match, In string list, Not in string list, In List, Not in list, Starts with |
| Critical Threshold | 6000 | 0 - 2147483647 |
| Critical Repeat Count | 1 | 1-12 |
| Alert | Yes | Yes/No |
| Graph (Yes/No) | Yes | Yes/No |
Sample Output
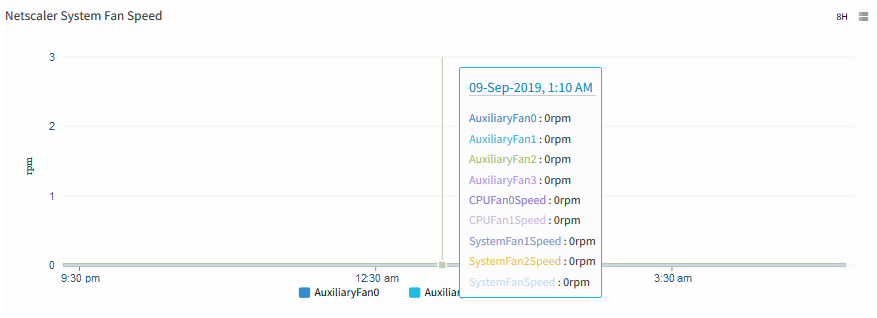
Netscaler Fan Speed System
citrix.netscaler.system.powersupply.status
Metric Details
| Applicable for | Device |
| SNMP OID | 1.3.6.1.4.1.5951.4.1.1.41.7.1.2 |
| Expression | NULL |
| Description | Monitors the system power supply status. The appliance has 2 power supply units. The appliance functions as expected with a single power supply unit. The second power supply unit is a backup unit. Possible values are 0-Normal, 1 - Not preset, 2 - failed, 3- Not supported. [OIDs: 1.3.6.1.4.1.5951.4.1.1.41.7.1.1, 1.3.6.1.4.1.5951.4.1.1.41.7.1.2] |
| Category | SNMP monitors |
| Collector Type | Gateway |
| Monitor Name | Netscaler System Power Supply Status |
| Unit | None |
Possible Inputs
| Metric | Input Value | Range of Values |
|---|---|---|
| Frequency | 15 | 1 – 1440 (mins) |
| Filter | 1. Name Contains Power Supply 2. Name Not contains Voltage | |
| Warning Operator | ||
| Warning Threshold | ||
| Warning Repeat Count | ||
| Critical Operator | EQUAL | Ends with, ==, !=, >=, <=, >, <, In Range, Out of range, Equals, Not equals, Equals Ignore Case, Not Equals Ignore Case, Contains, Not contains, Regex match, Regex no match, In string list, Not in string list, In List, Not in list, Starts with |
| Critical Threshold | 2 | [{"0":"Normal"},{"1":"Notpresent"},{"2":"Failed"},{"3":"Notsupported"}] |
| Critical Repeat Count | 1 | 1-12 |
| Alert | Yes | Yes/No |
| Graph (Yes/No) | Yes | Yes/No |
Sample Output
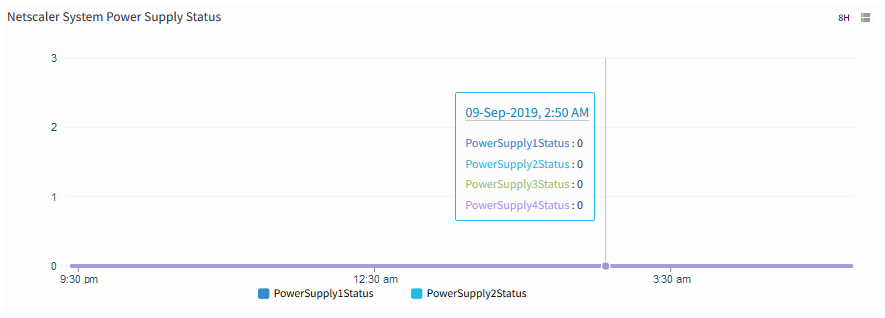
Netscaler System Power Suply Status
citrix.netscaler.system.temperature
Metric Details
| Applicable for | Device |
| SNMP OID | 1.3.6.1.4.1.5951.4.1.1.41.7.1.2 |
| Expression | NULL |
| Description | Monitors the temperature. [OIDs: 1.3.6.1.4.1.5951.4.1.1.41.7.1.1, 1.3.6.1.4.1.5951.4.1.1.41.7.1.2] |
| Category | SNMP monitors |
| Collector Type | Gateway |
| Monitor Name | Netscaler System Temperature |
| Unit | C |
Possible Inputs
| Metric | Input Value | Range of Values |
|---|---|---|
| Frequency | 15 | 1 – 1440 (mins) |
| Filter | Name Contains Temperature | |
| Warning Operator | ||
| Warning Threshold | ||
| Warning Repeat Count | ||
| Critical Operator | ||
| Critical Threshold | ||
| Critical Repeat Count | ||
| Alert | No | Yes/No |
| Graph (Yes/No) | Yes | Yes/No |
Sample Output
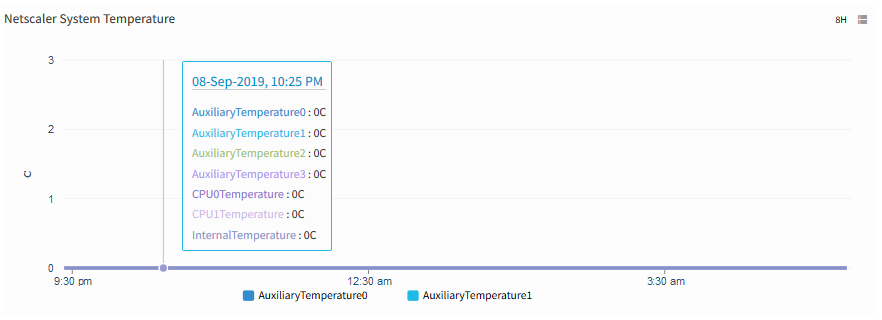
Netscaler System Temperature
citrix.netscaler.system.voltage
Metric Details
| Applicable for | Device |
| SNMP OID | 1.3.6.1.4.1.5951.4.1.1.41.7.1.2 |
| Expression | sysHealthCounterValue/1000 |
| Description | Monitors the system voltage. [OIDs: 1.3.6.1.4.1.5951.4.1.1.41.7.1.1, 1.3.6.1.4.1.5951.4.1.1.41.7.1.2] |
| Category | SNMP monitors |
| Collector Type | Gateway |
| Monitor Name | Netscaler System Voltage |
| Unit | v |
Possible Inputs
| Metric | Input Value | Range of Values |
|---|---|---|
| Frequency | 15 | 1 – 1440 (mins) |
| Filter | Name Contains Voltage | |
| Warning Operator | ||
| Warning Threshold | ||
| Warning Repeat Count | ||
| Critical Operator | ||
| Critical Threshold | ||
| Critical Repeat Count | ||
| Alert | No | Yes/No |
| Graph (Yes/No) | Yes | Yes/No |
Sample Output
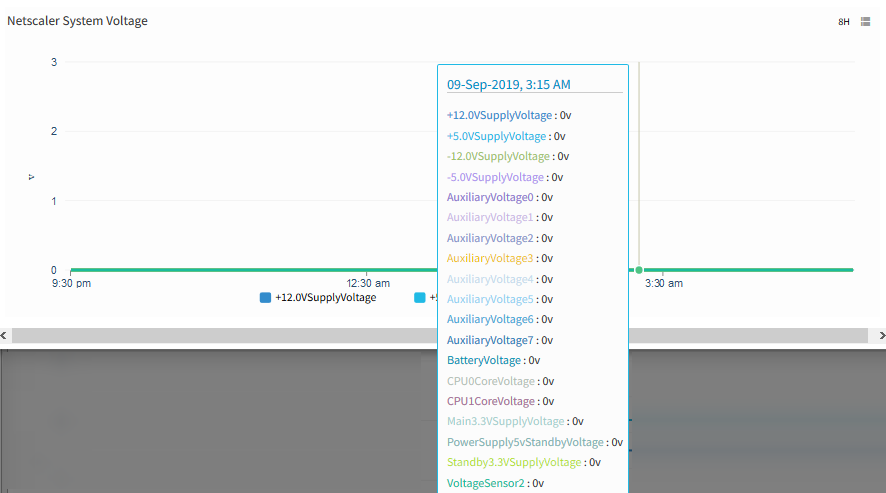
Netscaler System Voltage
