Description
It monitors the ExtemeXOS switch’s port statistics like average bandwidth utilization in the transmit(Tx) and receive(Rx) direction and monitors the number of packets dropped due to congestion on this port. Validated on ExtremeXOS X440 switch (SysObjID: enterprises.1916.2.175, enterprises.1916.2.177).
Note: While assigning this template user should select ports manually which need to be monitored.
Prerequisites
SNMP should be enabled in end device and device should support EXTREME-PORT-MIB OIDs and SNMP credentials should be attached against the device in portal.
How to Apply: While assigning the template, it will show get components discovery button. Once we click on it, it will show values for the following properties: Name
Metric Parameters
| Parameter | Description |
|---|---|
| Frequency | Warning Threshold | If the metric value satisfies the condition defined along with Warning Threshold value, then a notification is sent to the user. |
| Critical Threshold | If the metric value satisfies the condition defined along with Critical Threshold value, then a notification is sent to the user. |
| Alert | The alert value can be set to either Yes or No. If it is Yes, then an alert message is sent to the user. |
Metrics
extreme.average.port.tx.utilization
Metric Details
| Applicable for | Device |
| SNMP OID | 1.3.6.1.4.1.1916.1.4.5.1.1 |
| Expression | extremePortUtilizationAvgTxBw / 100 |
| Description | This monitor provides the reported average bandwidth in the transmit direction. When displayed, it shows as an Integer value, i.e., 99.99% is displayed as 9999. [OID: 1.3.6.1.4.1.1916.1.4.5.1.1] |
| Category | SNMP monitors |
| Collector Type | Gateway |
| Extreme XOS Port Monitoring | |
| Unit | % |
Possible Inputs
| Metric | Input Value | Range of Values |
|---|---|---|
| Frequency | 5 | 1 – 1440 (mins) |
| Filter | Name | |
| Warning Operator | ||
| Warning Threshold | ||
| Warning Repeat Count | ||
| Critical Operator | ||
| Critical Threshold | ||
| Critical Repeat Count | ||
| Alert | No | Yes/No |
| Graph (Yes/No) | Yes | Yes/No |
Sample Output
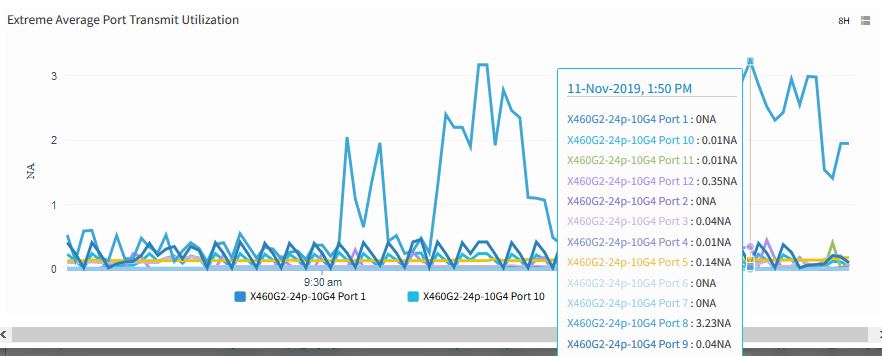
Extreme Average Port Transmit Utilization
extreme.average.port.rx.utilization
Metric Details
| Applicable for | Device |
| SNMP OID | 1.3.6.1.4.1.1916.1.4.5.1.2 |
| Expression | extremePortUtilizationAvgRxBw / 100 |
| Description | This monitor provides the reported average bandwidth in the receive direction. When displayed, it shows as an Integer value, i.e., 99.99% is displayed as 9999. [OID: 1.3.6.1.4.1.1916.1.4.5.1.2] |
| Category | SNMP monitors |
| Collector Type | Gateway |
| Monitor Name | Extreme XOS Port Monitoring |
| Unit | % |
Possible Inputs
| Metric | Input Value | Range of Values |
|---|---|---|
| Frequency | 5 | 1 – 1440 (mins) |
| Filter | Name | |
| Warning Operator | ||
| Warning Threshold | ||
| Warning Repeat Count | ||
| Critical Operator | ||
| Critical Threshold | ||
| Critical Repeat Count | ||
| Alert | No | Yes/No |
| Graph (Yes/No) | Yes | Yes/No |
Sample Output
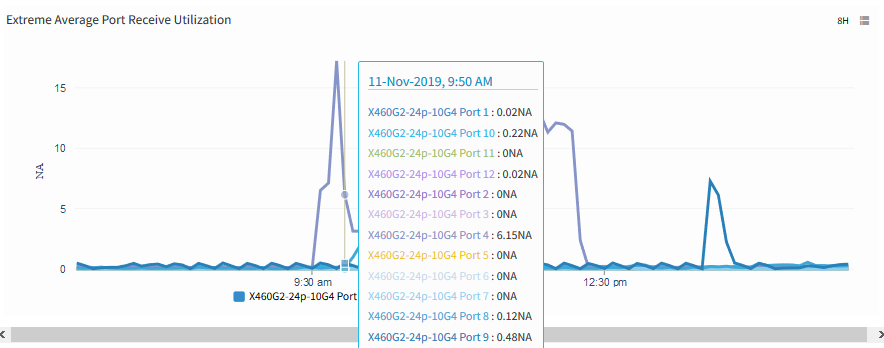
Extreme Average Port Receive Utilization
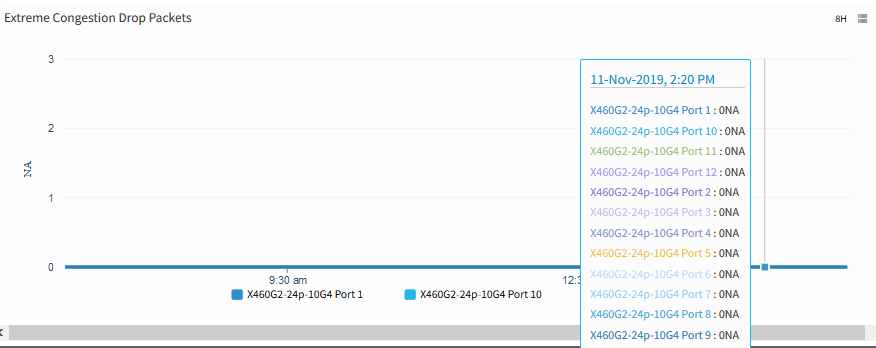
extreme.congestion.drop.packets
Metric Details
| Applicable for | Device |
| SNMP OID | 1.3.6.1.4.1.1916.1.4.14.1.1 |
| Expression | NULL |
| Description | This monitor provides the number of packets dropped due to congestion on this port. [OID: 1.3.6.1.4.1.1916.1.4.14.1.1] |
| Category | SNMP monitors |
| Collector Type | Gateway |
| Monitor Name | Extreme XOS Port Monitoring |
| Unit |
Possible Inputs
| Metric | Input Value | Range of Values |
|---|---|---|
| Frequency | 5 | 1 – 1440 (mins) |
| Filter | Name | |
| Warning Operator | ||
| Warning Threshold | ||
| Warning Repeat Count | ||
| Critical Operator | GREATER_THAN | Ends with, ==, !=, >=, <=, >, <, In Range, Out of range, Equals, Not equals, Equals Ignore Case, Not Equals Ignore Case, Contains, Not contains, Regex match, Regex no match, In string list, Not in string list, In List, Not in list, Starts with |
| Critical Threshold | 30 | 0 - 18446744073709551615 |
| Critical Repeat Count | 1 | 1-12 |
| Alert | Yes | Yes/No |
| Graph (Yes/No) | Yes | Yes/No |
Sample Output