Description
Monitors the Local Traffic Manager (LTM) statistics like Virtual Server Client Throughput, Virtual Server Status, Virtual Server Usage, LTM Pool Status and Node Status.
Prerequisites
SNMP should be enabled in end device and device should support F5-BIGIP-LOCAL-MIB OIDs and SNMP credentials should be attached against the device in portal.
How to Apply: This template is All instance selection based and Automatic select instance based. It will not ask user to select any instance (s) while assigning it to a device.
Metric Parameters
| Parameter | Description |
|---|---|
| Frequency | |
| Warning Threshold | If the metric value satisfies the condition defined along with Warning Threshold value, then a notification is sent to the user. |
| Critical Threshold | If the metric value satisfies the condition defined along with Critical Threshold value, then a notification is sent to the user. |
| Alert | The alert value can be set to either Yes or No. If it is Yes, then an alert message is sent to the user. |
Metrics
f5lb.pool.avail.state
Metric Details
| Applicable for | Device |
| SNMP OID | 1.3.6.1.4.1.3375.2.2.5.5.2.1.2, 1.3.6.1.4.1.3375.2.2.5.5.2.1.5, 1.3.6.1.4.1.3375.2.2.5.1.2.1.8, 1.3.6.1.4.1.3375.2.2.5.1.2.1.23 |
| Expression | ltmPoolStatusAvailState |
| Description | The availability of the specified pool indicated in color. t0: none - error; t1: green - available in some capacity; t2: yellow - not currently available; t3: red - not available; t4: blue - availability is unknown; t5: gray - unlicensed. Alert will be generated when availability status not equals to 1,4. [OIDs: 1.3.6.1.4.1.3375.2.2.5.5.2.1.1, 1.3.6.1.4.1.3375.2.2.5.5.2.1.2, 1.3.6.1.4.1.3375.2.2.5.5.2.1.5] |
| Category | SNMP monitors |
| Collector Type | Gateway |
| Monitor Name | F5-LB LTM Pool Status |
| Unit |
Possible Inputs
| Metric | Input Value | Range of Values |
|---|---|---|
| Frequency | 15 | 1 – 1440 (mins) |
| Filter | NULL | Not Applicable |
| Warning Operator | ||
| Warning Threshold | ||
| Warning Repeat Count | ||
| Critical Operator | NOT_IN_LIST | Ends with, ==, !=, >=, <=, >, <, In Range, Out of range, Equals, Not equals, Equals Ignore Case, Not Equals Ignore Case, Contains, Not contains, Regex match, Regex no match, In string list, Not in string list, In List, Not in list, Starts with |
| Critical Threshold | 1,4,6 | 0-6 |
| Critical Repeat Count | 1 | 1-12 |
| Alert | No | Yes/No |
| Graph (Yes/No) | Yes | Yes/No |
Sample Output
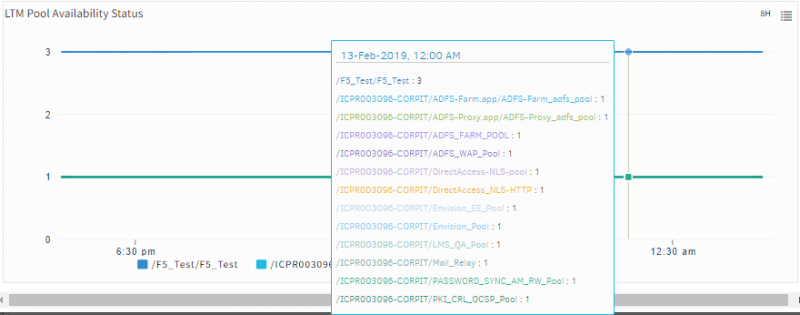
LTM Pool Availability Status
f5lb.virtualserver.avail.state
Metric Details
| Applicable for | Device |
| SNMP OID | 1.3.6.1.4.1.3375.2.2.10.13.2.1.2, 1.3.6.1.4.1.3375.2.2.10.13.2.1.5 |
| Expression | ltmVsStatusAvailState |
| Description | The availability of the specified virtual server indicated in color. t0-none - error; t1-green - available in some capacity; t2-yellow - not currently available; t3-red - not available; t4-blue - availability is unknown; t5-gray - unlicensed. [OIDs: 1.3.6.1.4.1.3375.2.2.10.13.2.1.1, 1.3.6.1.4.1.3375.2.2.10.13.2.1.2, 1.3.6.1.4.1.3375.2.2.10.13.2.1.5] |
| Category | SNMP monitors |
| Collector Type | Gateway |
| Monitor Name | F5-LB LTM Virtual Server Status |
| Unit |
Possible Inputs
| Metric | Input Value | Range of Values |
|---|---|---|
| Frequency | 15 | 1 – 1440 (mins) |
| Filter | NULL | Not Applicable |
| Warning Operator | ||
| Warning Threshold | ||
| Warning Repeat Count | ||
| Critical Operator | ||
| Critical Threshold | ||
| Critical Repeat Count | ||
| Alert | No | Yes/No |
| Graph (Yes/No) | Yes | Yes/No |
Note: As Alert is not enabled on the above metric, the fields are left blank.
Sample Output
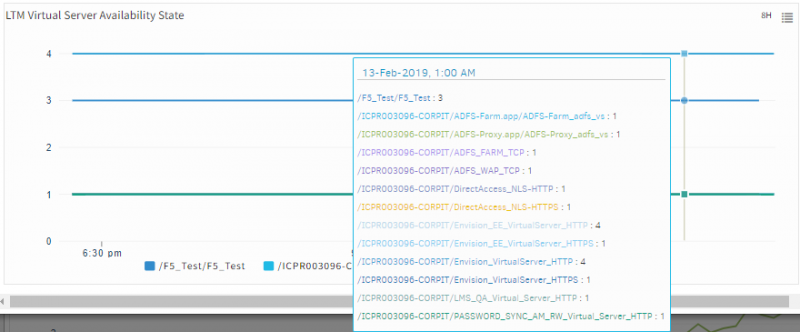
LTM Virtual Server Availability State
f5lb.node.avail.state
Metric Details
| Applicable for | Device |
| SNMP OID | 1.3.6.1.4.1.3375.2.2.4.3.2.1.3, 1.3.6.1.4.1.3375.2.2.4.3.2.1.6 |
| Expression | ltmNodeAddrStatusAvailState |
| Description | The availability of the specified node address indicated in color. t0- none - error; t1- green - available in some capacity; t2- yellow - not currently available; t3- red - not available; t4- blue - availability is unknown; t5- gray - unlicensed. [OIDs: 1.3.6.1.4.1.3375.2.2.4.3.2.1.2, 1.3.6.1.4.1.3375.2.2.4.3.2.1.3, 1.3.6.1.4.1.3375.2.2.4.3.2.1.6] |
| Category | SNMP monitors |
| Collector Type | Gateway |
| Monitor Name | F5-LB Node Status |
| Unit |
Possible Inputs
| Metric | Input Value | Range of Values |
|---|---|---|
| Frequency | 15 | 1 – 1440 (mins) |
| Filter | NULL | Not Applicable |
| Warning Operator | ||
| Warning Threshold | ||
| Warning Repeat Count | ||
| Critical Operator | ||
| Critical Threshold | ||
| Critical Repeat Count | ||
| Alert | No | Yes/No |
| Graph (Yes/No) | Yes | Yes/No |
Note: As Alert is not enabled on the above metric, the fields are left blank.
Sample Output
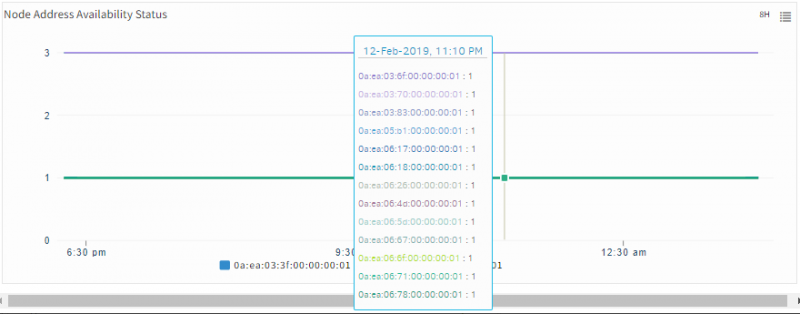
Node Address Availability Status
f5lb.virtualserver.client.throughput
Metric Details
| Applicable for | Device |
| SNMP OID | 1.3.6.1.4.1.3375.2.2.10.2.3.1.7, 1.3.6.1.4.1.3375.2.2.10.2.3.1.9 |
| Expression | ltmVirtualServStatClientBytesIn + ltmVirtualServStatClientBytesOut |
| Description | Monitors the virtual server client throughput. [OIDs: 1.3.6.1.4.1.3375.2.2.10.2.3.1.1, 1.3.6.1.4.1.3375.2.2.10.2.3.1.7, 1.3.6.1.4.1.3375.2.2.10.2.3.1.9] |
| Category | SNMP monitors |
| Collector Type | Gateway |
| Monitor Name | F5-LB LTM Virtual Server Usage and Client Throughput |
| Unit | Bps |
Possible Inputs
| Metric | Input Value | Range of Values |
|---|---|---|
| Frequency | 15 | 1 – 1440 (mins) |
| Filter | NULL | Not Applicable |
| Warning Operator | ||
| Warning Threshold | ||
| Warning Repeat Count | ||
| Critical Operator | ||
| Critical Threshold | ||
| Critical Repeat Count | ||
| Alert | No | Yes/No |
| Graph (Yes/No) | Yes | Yes/No |
Note: As Alert is not enabled on the above metric, the fields are left blank.
Sample Output
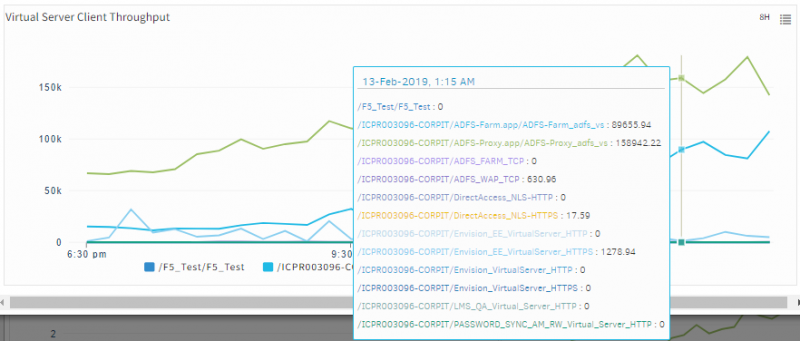
Virtual Server Client Throughput
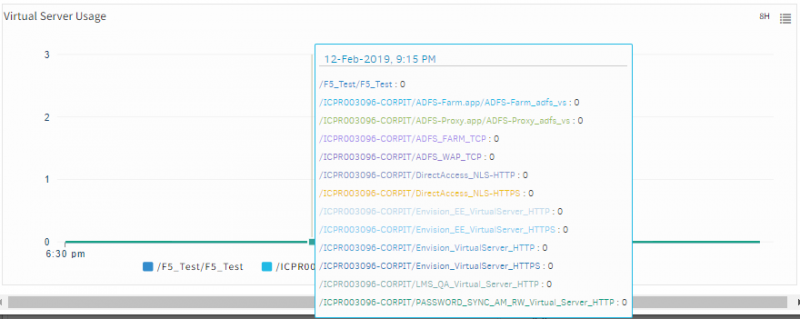
f5lb.virtualserver.usage
Metric Details
| Applicable for | Device |
| SNMP OID | 1.3.6.1.4.1.3375.2.2.10.2.3.1.33 |
| Expression | NULL |
| Description | Monitors the percentage of time Virtual Server was busy over the last 5 minutes. [OID: 1.3.6.1.4.1.3375.2.2.10.2.3.1.33] |
| Category | SNMP monitors |
| Collector Type | Gateway |
| Monitor Name | F5-LB LTM Virtual Server Usage and Client Throughput |
| Unit | % |
Possible Inputs
| Metric | Input Value | Range of Values |
|---|---|---|
| Frequency | 15 | 1 – 1440 (mins) |
| Filter | NULL | Not Applicable |
| Warning Operator | GREATER_THAN | Ends with, ==, !=, >=, <=, >, <, In Range, Out of range, Equals, Not equals, Equals Ignore Case, Not Equals Ignore Case, Contains, Not contains, Regex match, Regex no match, In string list, Not in string list, In List, Not in list, Starts with |
| Warning Threshold | 80 | 0-100 |
| Warning Repeat Count | 1 | 1-12 |
| Critical Operator | GREATER_THAN | Ends with, ==, !=, >=, <=, >, <, In Range, Out of range, Equals, Not equals, Equals Ignore Case, Not Equals Ignore Case, Contains, Not contains, Regex match, Regex no match, In string list, Not in string list, In List, Not in list, Starts with |
| Critical Threshold | 90 | 0-100 |
| Critical Repeat Count | 1 | 1-12 |
| Alert | Yes | Yes/No |
| Graph (Yes/No) | Yes | Yes/No |
Sample Output