Description
Monitors CPU utilization, memory utilization, dns statistics, dhcp statistics, ddns statistics, grid status, replication status, global services status and DHCP subnet usage of infoblox appliance.
Prerequisites
SNMP should be enabled in end device and device should support IB-PLATFORMONE-MIB, IB-DNSONE-MIB, IB-DHCPONE-MIB OIDs and SNMP credentials should be attached against the device in portal.
How to Apply: This template is All instance selection based. It will not ask user to select any instance(s) while assigning it to a device.
Metric Parameters
| Parameter | Description |
|---|---|
| Frequency | Warning Threshold | If the metric value satisfies the condition defined along with Warning Threshold value, then a notification is sent to the user. |
| Critical Threshold | If the metric value satisfies the condition defined along with Critical Threshold value, then a notification is sent to the user. |
| Alert | The alert value can be set to either Yes or No. If it is Yes, then an alert message is sent to the user. |
Metrics
system.uptime
Metric Details
| Applicable for | Device |
| SNMP OID | 1.3.6.1.2.1.25.1.1.0 |
| Expression | hrSystemUptime/100 |
| Description | The amount of time since this host was last initialized. [OID - 1.3.6.1.2.1.25.1.1.0] |
| Category | SNMP monitors |
| Collector Type | Gateway |
| Monitor Name | Host System Uptime |
| Unit | s |
Possible Inputs
| Metric | Input Value | Range of Values |
|---|---|---|
| Frequency | 10 | 1 – 1440 (mins) |
| Filter | ||
| Warning Operator | ||
| Warning Threshold | ||
| Warning Repeat Count | ||
| Critical Operator | LESS_THAN_EQUAL | Ends with, ==, !=, >=, <=, >, <, In Range, Out of range, Equals, Not equals, Equals Ignore Case, Not Equals Ignore Case, Contains, Not contains, Regex match, Regex no match, In string list, Not in string list, In List, Not in list, Starts with |
| Critical Threshold | 1800 | 0 - 4294967295 |
| Critical Repeat Count | 1 | 1-12 |
| Alert | Yes | Yes/No |
| Graph (Yes/No) | Yes | Yes/No |
Sample Output
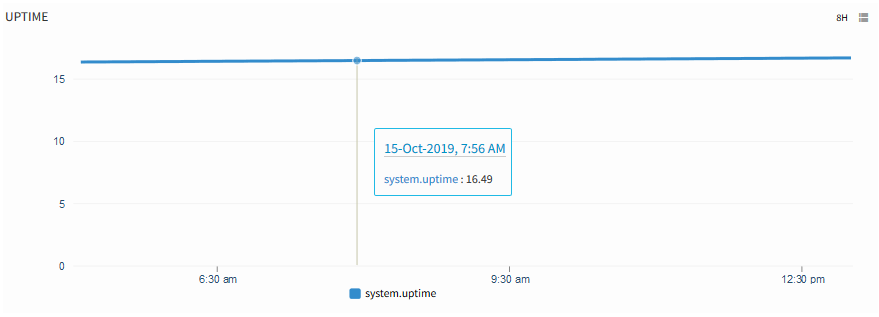
UPTIME
ib.dhcp.subnet.usage
Metric Details
| Applicable for | Device |
| SNMP OID | 1.3.6.1.4.1.7779.3.1.1.4.1.1.1.2, 1.3.6.1.4.1.7779.3.1.1.4.1.1.1.3 |
| Expression | ibDHCPSubnetPercentUsed |
| Description | Provides percentage of dynamic DHCP address for subnet leased out at this time. Fixed addresses are always counted as leased for this calculation if the fixed addresses are within ranges of leases. [OIDs: 1.3.6.1.4.1.7779.3.1.1.4.1.1.1.1, 1.3.6.1.4.1.7779.3.1.1.4.1.1.1.2, 1.3.6.1.4.1.7779.3.1.1.4.1.1.1.3] |
| Category | SNMP monitors |
| Collector Type | Gateway |
| Monitor Name | Infoblox DHCP Subnet Usage |
| Unit | % |
Possible Inputs
| Metric | Input Value | Range of Values |
|---|---|---|
| Frequency | 10 | 1 – 1440 (mins) |
| Filter | NULL | Not Applicable |
| Warning Operator | GREATER_THAN_EQUAL | Ends with, ==, !=, >=, <=, >, <, In Range, Out of range, Equals, Not equals, Equals Ignore Case, Not Equals Ignore Case, Contains, Not contains, Regex match, Regex no match, In string list, Not in string list, In List, Not in list, Starts with |
| Warning Threshold | 90 | 0-100 |
| Warning Repeat Count | 1 | 1-12 |
| Critical Operator | GREATER_THAN_EQUAL | Ends with, ==, !=, >=, <=, >, <, In Range, Out of range, Equals, Not equals, Equals Ignore Case, Not Equals Ignore Case, Contains, Not contains, Regex match, Regex no match, In string list, Not in string list, In List, Not in list, Starts with |
| Critical Threshold | 95 | 0-100 |
| Critical Repeat Count | 1 | 1-12 |
| Alert | Yes | Yes/No |
| Graph (Yes/No) | Yes | Yes/No |
Sample Output
No graph
ib.service.status
Metric Details
| Applicable for | Device |
| SNMP OID | 1.3.6.1.4.1.7779.3.1.1.2.1.9.1.2, 1.3.6.1.4.1.7779.3.1.1.2.1.9.1.3 |
| Expression | ibServiceStatus |
| Description | Monitors Infoblox services status. Possible status values are working(1), warning(2), failed(3), inactive(4), unknown(5). [OIDs: 1.3.6.1.4.1.7779.3.1.1.2.1.9.1.1, 1.3.6.1.4.1.7779.3.1.1.2.1.9.1.2, 1.3.6.1.4.1.7779.3.1.1.2.1.9.1.3] |
| Category | SNMP monitors |
| Collector Type | Gateway |
| Monitor Name | Infoblox Services Status |
| Unit |
Possible Inputs
| Metric | Input Value | Range of Values |
|---|---|---|
| Frequency | 10 | 1 – 1440 (mins) |
| Filter | NULL | Not Applicable |
| Warning Operator | EQUAL | Ends with, ==, !=, >=, <=, >, <, In Range, Out of range, Equals, Not equals, Equals Ignore Case, Not Equals Ignore Case, Contains, Not contains, Regex match, Regex no match, In string list, Not in string list, In List, Not in list, Starts with |
| Warning Threshold | 2 | [{"1":"working"},{"2":"warning"},{"3":"failed"},{"4":"inactive"},{"5":"unknown"}] |
| Warning Repeat Count | 1 | 1-12 |
| Critical Operator | EQUAL | Ends with, ==, !=, >=, <=, >, <, In Range, Out of range, Equals, Not equals, Equals Ignore Case, Not Equals Ignore Case, Contains, Not contains, Regex match, Regex no match, In string list, Not in string list, In List, Not in list, Starts with |
| Critical Threshold | 3 | [{"1":"working"},{"2":"warning"},{"3":"failed"},{"4":"inactive"},{"5":"unknown"}] |
| Critical Repeat Count | 1 | 1-12 |
| Alert | Yes | Yes/No |
| Graph (Yes/No) | Yes | Yes/No |
Sample Output
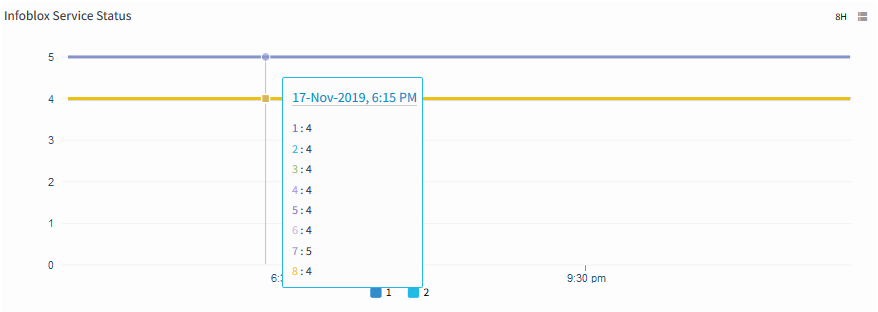
Inflobox Service Status
ib.service.name
Metric Details
| Applicable for | Device |
| SNMP OID | 1.3.6.1.4.1.7779.3.1.1.2.1.9.1.1 |
| Expression | NULL |
| Description | Gives the names for infoblox services. Possible service names are dhcp(1), dns(2), ntp(3), radius(4), tftp(5), http-file-dist(6), ftp(7), bloxtools-move(8), bloxtools(9), node-status(10), disk-usage(11), enet-lan(12), enet-lan2(13), enet-ha(14), enet-mgmt(15), lcd(16), memory(17), replication(18), db-object(19), raid-summary(20), raid-disk1(21), raid-disk2(22), raid-disk3(23), raid-disk4(24), fan1(25), fan2(26), fan3(27), power-supply(28), ntp-sync(29), cpu1-temp(30), cpu2-temp(31), sys-temp(32), raid-battery(33), cpu-usage(34), ospf(35), bgp(36). [OID: 1.3.6.1.4.1.7779.3.1.1.2.1.9.1.1] |
| Category | SNMP monitors |
| Collector Type | Gateway |
| Monitor Name | Infoblox Services Status |
| Unit | None |
Possible Inputs
| Metric | Input Value | Range of Values |
|---|---|---|
| Frequency | 10 | 1 – 1440 (mins) |
| Filter | NULL | Not Applicable |
| Warning Operator | ||
| Warning Threshold | ||
| Warning Repeat Count | ||
| Critical Operator | ||
| Critical Threshold | ||
| Critical Repeat Count | ||
| Alert | No | Yes/No |
| Graph (Yes/No) | No | Yes/No |
Sample Output
No graph
ib.system.cpu.usage
Metric Details
| Applicable for | Device |
| SNMP OID | 1.3.6.1.4.1.7779.3.1.1.2.1.8.1.1.0 |
| Expression | NULL |
| Description | Provides current average CPU usage. [OID: 1.3.6.1.4.1.7779.3.1.1.2.1.8.1.1.0] |
| Category | SNMP monitors |
| Collector Type | Gateway |
| Monitor Name | Infoblox Appliance Performance Monitoring |
| Unit | % |
Possible Inputs
| Metric | Input Value | Range of Values |
|---|---|---|
| Frequency | 10 | 1 – 1440 (mins) |
| Filter | ||
| Warning Operator | GREATER_THAN_EQUAL | Ends with, ==, !=, >=, <=, >, <, In Range, Out of range, Equals, Not equals, Equals Ignore Case, Not Equals Ignore Case, Contains, Not contains, Regex match, Regex no match, In string list, Not in string list, In List, Not in list, Starts with |
| Warning Threshold | 80 | 0-100 |
| Warning Repeat Count | 1 | 1-12 |
| Critical Operator | GREATER_THAN_EQUAL | Ends with, ==, !=, >=, <=, >, <, In Range, Out of range, Equals, Not equals, Equals Ignore Case, Not Equals Ignore Case, Contains, Not contains, Regex match, Regex no match, In string list, Not in string list, In List, Not in list, Starts with |
| Critical Threshold | 90 | 0-100 |
| Critical Repeat Count | 1 | 1-12 |
| Alert | Yes | Yes/No |
| Graph (Yes/No) | Yes | Yes/No |
Sample Output
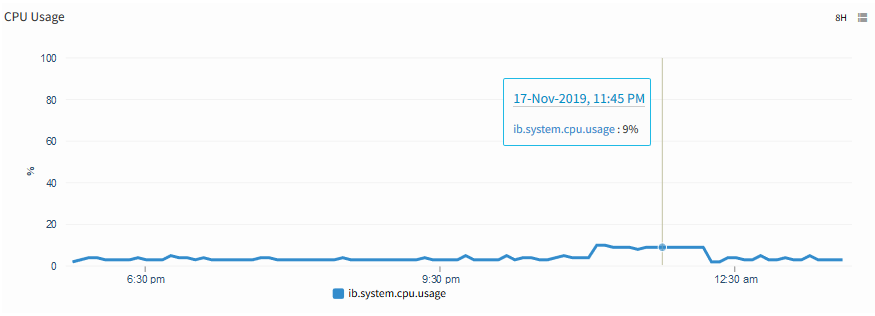
CPU Usage
ib.system.mem.usage
Metric Details
| Applicable for | Device |
| SNMP OID | 1.3.6.1.4.1.7779.3.1.1.2.1.8.2.1.0 |
| Expression | NULL |
| Description | Provides current Memory usage. [OID: 1.3.6.1.4.1.7779.3.1.1.2.1.8.2.1.0] |
| Category | SNMP monitors |
| Collector Type | Gateway |
| Monitor Name | Infoblox Appliance Performance Monitoring |
| Unit | % |
Possible Inputs
| Metric | Input Value | Range of Values |
|---|---|---|
| Frequency | 10 | 1 – 1440 (mins) |
| Filter | ||
| Warning Operator | GREATER_THAN_EQUAL | Ends with, ==, !=, >=, <=, >, <, In Range, Out of range, Equals, Not equals, Equals Ignore Case, Not Equals Ignore Case, Contains, Not contains, Regex match, Regex no match, In string list, Not in string list, In List, Not in list, Starts with |
| Warning Threshold | 80 | 0-100 |
| Warning Repeat Count | 2 | 1-12 |
| Critical Operator | GREATER_THAN_EQUAL | Ends with, ==, !=, >=, <=, >, <, In Range, Out of range, Equals, Not equals, Equals Ignore Case, Not Equals Ignore Case, Contains, Not contains, Regex match, Regex no match, In string list, Not in string list, In List, Not in list, Starts with |
| Critical Threshold | 90 | 0-100 |
| Critical Repeat Count | 2 | 1-12 |
| Alert | Yes | Yes/No |
| Graph (Yes/No) | Yes | Yes/No |
Sample Output
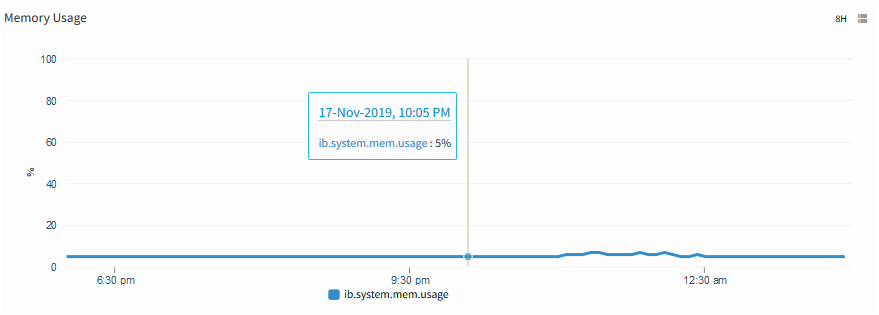
Memory Usage
ib.cpu.temperature
Metric Details
| Applicable for | Device |
| SNMP OID | 1.3.6.1.4.1.7779.3.1.1.2.1.1.0 |
| Expression | MATCHER(ibCPUTemperature, '(+|-){0,1}(d+.*d*)') |
| Description | Provides the temperature of the Infoblox CPU. [OID: 1.3.6.1.4.1.7779.3.1.1.2.1.1] |
| Category | SNMP monitors |
| Collector Type | Gateway |
| Monitor Name | Infoblox Appliance Performance Monitoring |
| Unit | C |
Possible Inputs
| Metric | Input Value | Range of Values |
|---|---|---|
| Frequency | 10 | 1 – 1440 (mins) |
| Filter | ||
| Warning Operator | GREATER_THAN | Ends with, ==, !=, >=, <=, >, <, In Range, Out of range, Equals, Not equals, Equals Ignore Case, Not Equals Ignore Case, Contains, Not contains, Regex match, Regex no match, In string list, Not in string list, In List, Not in list, Starts with |
| Warning Threshold | 48 | 0 - 2147483647 |
| Warning Repeat Count | 1 | 1-12 |
| Critical Operator | GREATER_THAN | Ends with, ==, !=, >=, <=, >, <, In Range, Out of range, Equals, Not equals, Equals Ignore Case, Not Equals Ignore Case, Contains, Not contains, Regex match, Regex no match, In string list, Not in string list, In List, Not in list, Starts with |
| Critical Threshold | 52 | 0 - 2147483647 |
| Critical Repeat Count | 1 | 1-12 |
| Alert | Yes | Yes/No |
| Graph (Yes/No) | Yes | Yes/No |
Sample Output
No graph
ib.member.grid.status
Metric Details
| Applicable for | Device |
| SNMP OID | 1.3.6.1.4.1.7779.3.1.1.2.1.13.0 |
| Expression | NULL |
| Description | Provides the current member status (either Active or Passive) if there are several Infoblox appliances put together in a grid (= acting as one Infoblox but highly available). [OIDs: 1.3.6.1.4.1.7779.3.1.1.2.1.13.0] |
| Category | SNMP monitors |
| Collector Type | Gateway |
| Monitor Name | Infoblox Appliance Performance Monitoring |
| Unit | None |
Possible Inputs
| Metric | Input Value | Range of Values |
|---|---|---|
| Frequency | 10 | 1 – 1440 (mins) |
| Filter | ||
| Warning Operator | EQUALS_IGNORE_CASE | Ends with, ==, !=, >=, <=, >, <, In Range, Out of range, Equals, Not equals, Equals Ignore Case, Not Equals Ignore Case, Contains, Not contains, Regex match, Regex no match, In string list, Not in string list, In List, Not in list, Starts with |
| Warning Threshold | Passive | 0...255 |
| Warning Repeat Count | 1 | 1-12 |
| Critical Operator | ||
| Critical Threshold | ||
| Critical Repeat Count | ||
| Alert | Yes | Yes/No |
| Graph (Yes/No) | No | Yes/No |
Sample Output
No graph
ib.dns.security.invalidport.5min
Metric Details
| Applicable for | Device |
| SNMP OID | 1.3.6.1.4.1.7779.3.1.1.2.1.3.1.4.1.2.0 |
| Expression | NULL |
| Description | Provides number of DNS responses to invalid ports during the last 5 minutes. [OID: 1.3.6.1.4.1.7779.3.1.1.2.1.3.1.4.1.2.0] |
| Category | SNMP monitors |
| Collector Type | Gateway |
| Monitor Name | Infoblox Appliance Performance Monitoring |
| Unit | None |
Possible Inputs
| Metric | Input Value | Range of Values |
|---|---|---|
| Frequency | 10 | 1 – 1440 (mins) |
| Filter | ||
| Warning Operator | ||
| Warning Threshold | ||
| Warning Repeat Count | ||
| Critical Operator | ||
| Critical Threshold | ||
| Critical Repeat Count | ||
| Alert | No | Yes/No |
| Graph (Yes/No) | Yes | Yes/No |
Sample Output
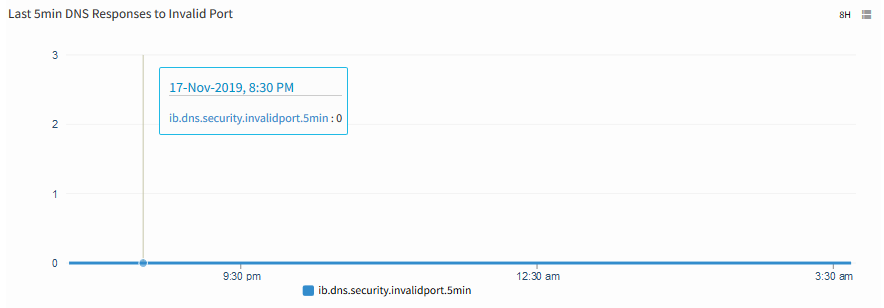
Last 5min DNS Response to Invalid Port
ib.dns.security.invalidtxid.5min
Metric Details
| Applicable for | Device |
| SNMP OID | 1.3.6.1.4.1.7779.3.1.1.2.1.3.1.4.2.2.0 |
| Expression | NULL |
| Description | Provides number of DNS responses with an invalid TXID during the last 5 minutes. [OID: 1.3.6.1.4.1.7779.3.1.1.2.1.3.1.4.2.2.0] |
| Category | SNMP monitors |
| Collector Type | Gateway |
| Monitor Name | Infoblox Appliance Performance Monitoring |
| Unit | None |
Possible Inputs
| Metric | Input Value | Range of Values |
|---|---|---|
| Frequency | 10 | 1 – 1440 (mins) |
| Filter | ||
| Warning Operator | ||
| Warning Threshold | ||
| Warning Repeat Count | ||
| Critical Operator | ||
| Critical Threshold | ||
| Critical Repeat Count | ||
| Alert | No | Yes/No |
| Graph (Yes/No) | Yes | Yes/No |
Sample Output
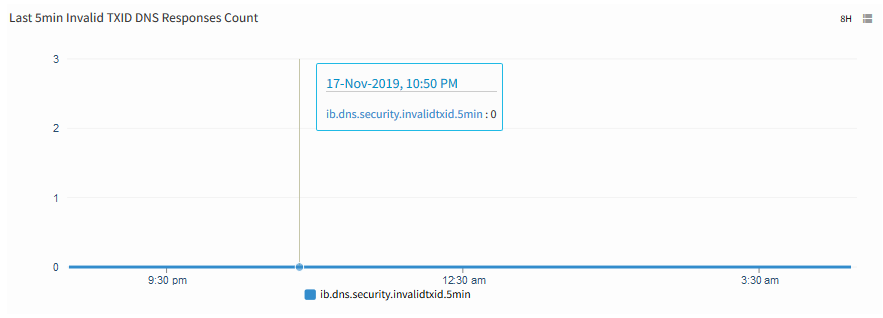
Last 5min Invalid TXID DNS Responses Count
ib.dns.zonetransfer.count
Metric Details
| Applicable for | Device |
| SNMP OID | 1.3.6.1.4.1.7779.3.1.1.3.1.4.0 |
| Expression | NULL |
| Description | Total number of successful zone transfers from an Infoblox primary or secondary DNS server to a DNS client, since the DNS service was last restarted. Note that this counter tracks the number of successful full zone transfers (AXFRs) and incremental zone transfers (IXFRs). [OID: 1.3.6.1.4.1.7779.3.1.1.3.1.4.0] |
| Category | SNMP monitors |
| Collector Type | Gateway |
| Monitor Name | Infoblox Appliance Performance Monitoring |
| Unit | None |
Possible Inputs
| Metric | Input Value | Range of Values |
|---|---|---|
| Frequency | 10 | 1 – 1440 (mins) |
| Filter | ||
| Warning Operator | ||
| Warning Threshold | ||
| Warning Repeat Count | ||
| Critical Operator | ||
| Critical Threshold | ||
| Critical Repeat Count | ||
| Alert | No | Yes/No |
| Graph (Yes/No) | Yes | Yes/No |
Sample Output
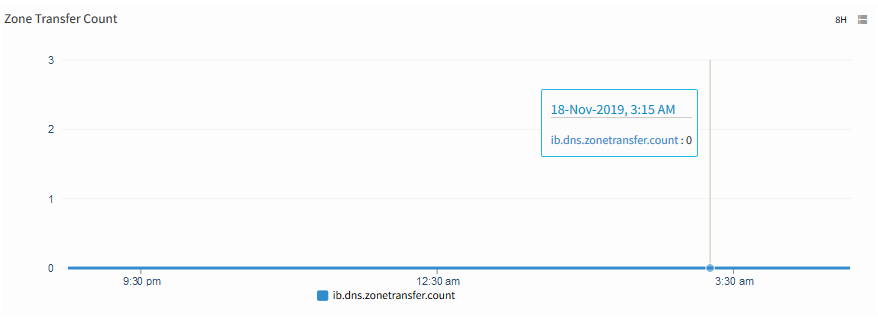
Zone Transfer Count
ib.dns.nonauthoritative.avglatency.5min
Metric Details
| Applicable for | Device |
| SNMP OID | 1.3.6.1.4.1.7779.3.1.1.2.1.3.1.2.2.1.0, 1.3.6.1.4.1.7779.3.1.1.2.1.3.1.2.2.2.0 |
| Expression | ibNetworkMonitorDNSNonAAT5AvgLatency*1000 |
| Description | Average Latencies (in microseconds) for incoming DNS queries during the last 5 minutes where the reply was non authoritative. [OIDs: 1.3.6.1.4.1.7779.3.1.1.2.1.3.1.2.2.1.0, 1.3.6.1.4.1.7779.3.1.1.2.1.3.1.2.2.2.0] |
| Category | SNMP monitors |
| Collector Type | Gateway |
| Monitor Name | Infoblox Appliance Performance Monitoring |
| Unit | ms |
Possible Inputs
| Metric | Input Value | Range of Values |
|---|---|---|
| Frequency | 10 | 1 – 1440 (mins) |
| Filter | ||
| Warning Operator | ||
| Warning Threshold | ||
| Warning Repeat Count | ||
| Critical Operator | ||
| Critical Threshold | ||
| Critical Repeat Count | ||
| Alert | No | Yes/No |
| Graph (Yes/No) | Yes | Yes/No |
Sample Output
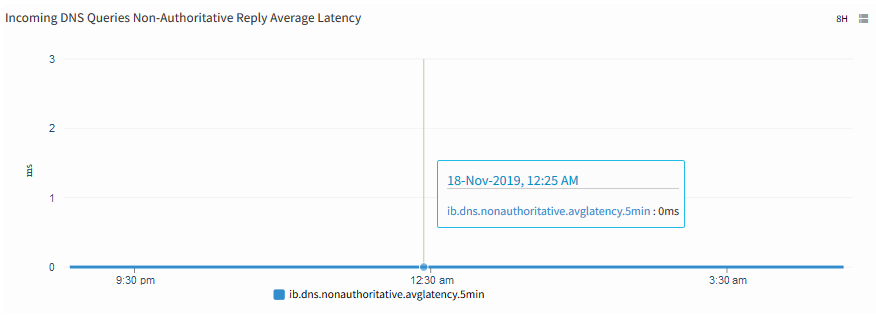
Incoming DNS Queries Non-Authoritative Reply Average Latency
ib.dns.authoritative.avglatency.5min
Metric Details
| Applicable for | Device |
| SNMP OID | 1.3.6.1.4.1.7779.3.1.1.2.1.3.1.3.2.1.0, 1.3.6.1.4.1.7779.3.1.1.2.1.3.1.3.2.2.0 |
| Expression | ibNetworkMonitorDNSAAT5AvgLatency*1000 |
| Description | Provides average Latencies (in microseconds) for incoming DNS queries during the last 5 minutes where the reply was authoritative. [OIDs: 1.3.6.1.4.1.7779.3.1.1.2.1.3.1.3.2.1.0, 1.3.6.1.4.1.7779.3.1.1.2.1.3.1.3.2.2.0] |
| Category | SNMP monitors |
| Collector Type | Gateway |
| Monitor Name | Infoblox Appliance Performance Monitoring |
| Unit | ms |
Possible Inputs
| Metric | Input Value | Range of Values |
|---|---|---|
| Frequency | 10 | 1 – 1440 (mins) |
| Filter | ||
| Warning Operator | ||
| Warning Threshold | ||
| Warning Repeat Count | ||
| Critical Operator | ||
| Critical Threshold | ||
| Critical Repeat Count | ||
| Alert | No | Yes/No |
| Graph (Yes/No) | Yes | Yes/No |
Sample Output
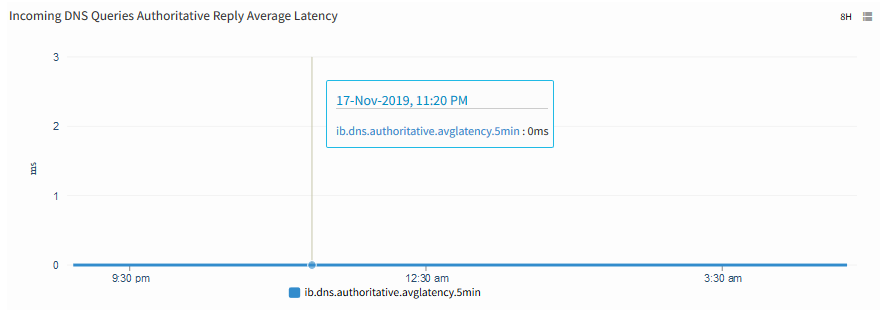
Incoming DNS Queries Authoritative Reply Average Latency
ib.dns.summary.success
Metric Details
| Applicable for | Device |
| SNMP OID | 1.3.6.1.4.1.7779.3.1.1.3.1.1.1.2.7.115.117.109.109.97.114.121 |
| Expression | NULL |
| Description | Provides success DNS responses summary per second. |
| Category | SNMP monitors |
| Collector Type | Gateway |
| Monitor Name | Infoblox Appliance Performance Monitoring |
| Unit | psec |
Possible Inputs
| Metric | Input Value | Range of Values |
|---|---|---|
| Frequency | 10 | 1 – 1440 (mins) |
| Filter | ||
| Warning Operator | ||
| Warning Threshold | ||
| Warning Repeat Count | ||
| Critical Operator | ||
| Critical Threshold | ||
| Critical Repeat Count | ||
| Alert | No | Yes/No |
| Graph (Yes/No) | Yes | Yes/No |
Sample Output
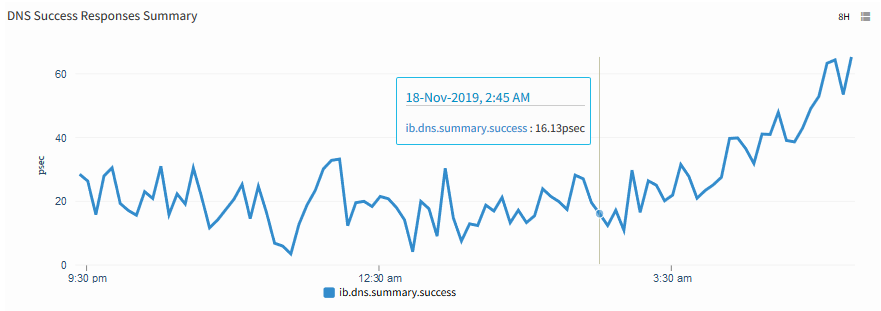
DNS Success Response Summary
ib.dns.summary.nxrrset
Metric Details
| Applicable for | Device |
| SNMP OID | 1.3.6.1.4.1.7779.3.1.1.3.1.1.1.4.7.115.117.109.109.97.114.121 |
| Expression | NULL |
| Description | Provides number of DNS queries summary (per second) received for non-existent record. |
| Category | SNMP monitors |
| Collector Type | Gateway |
| Monitor Name | Infoblox Appliance Performance Monitoring |
| Unit | psec |
Possible Inputs
| Metric | Input Value | Range of Values |
|---|---|---|
| Frequency | 10 | 1 – 1440 (mins) |
| Filter | ||
| Warning Operator | ||
| Warning Threshold | ||
| Warning Repeat Count | ||
| Critical Operator | ||
| Critical Threshold | ||
| Critical Repeat Count | ||
| Alert | No | Yes/No |
| Graph (Yes/No) | Yes | Yes/No |
Sample Output
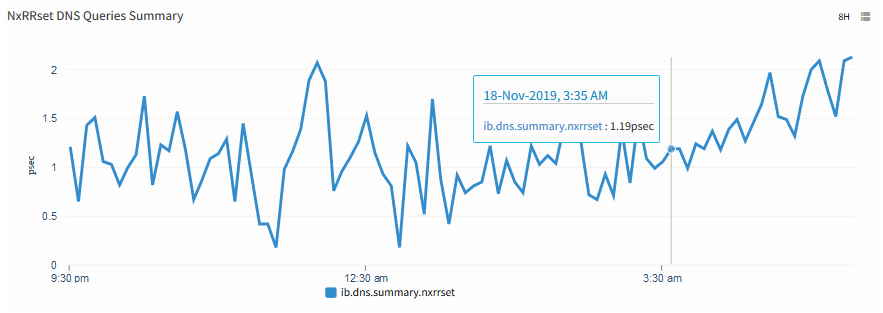
NxRRset DNS Queries Summary
ib.dns.summary.nxdomain
Metric Details
| Applicable for | Device |
| SNMP OID | 1.3.6.1.4.1.7779.3.1.1.3.1.1.1.5.7.115.117.109.109.97.114.121 |
| Expression | NULL |
| Description | Provides number of DNS queries summary (per second) received for non-existent domain. |
| Category | SNMP monitors |
| Collector Type | Gateway |
| Monitor Name | Infoblox Appliance Performance Monitoring |
| Unit | psec |
Possible Inputs
| Metric | Input Value | Range of Values |
|---|---|---|
| Frequency | 10 | 1 – 1440 (mins) |
| Filter | ||
| Warning Operator | ||
| Warning Threshold | ||
| Warning Repeat Count | ||
| Critical Operator | ||
| Critical Threshold | ||
| Critical Repeat Count | ||
| Alert | No | Yes/No |
| Graph (Yes/No) | Yes | Yes/No |
Sample Output
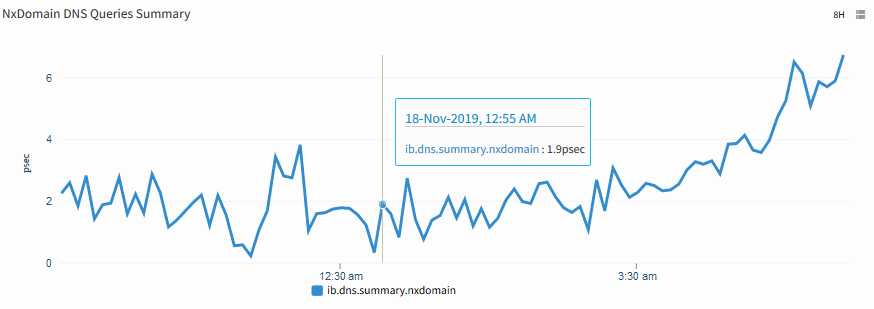
NxDomain DNS Queries Summary
ib.dns.summary.failure
Metric Details
| Applicable for | Device |
| SNMP OID | 1.3.6.1.4.1.7779.3.1.1.3.1.1.1.7.7.115.117.109.109.97.114.121 |
| Expression | NULL |
| Description | Provides number of Failed queries summary (per second). |
| Category | SNMP monitors |
| Collector Type | Gateway |
| Monitor Name | Infoblox Appliance Performance Monitoring |
| Unit | psec |
Possible Inputs
| Metric | Input Value | Range of Values |
|---|---|---|
| Frequency | 10 | 1 – 1440 (mins) |
| Filter | ||
| Warning Operator | ||
| Warning Threshold | ||
| Warning Repeat Count | ||
| Critical Operator | ||
| Critical Threshold | ||
| Critical Repeat Count | ||
| Alert | No | Yes/No |
| Graph (Yes/No) | Yes | Yes/No |
Sample Output
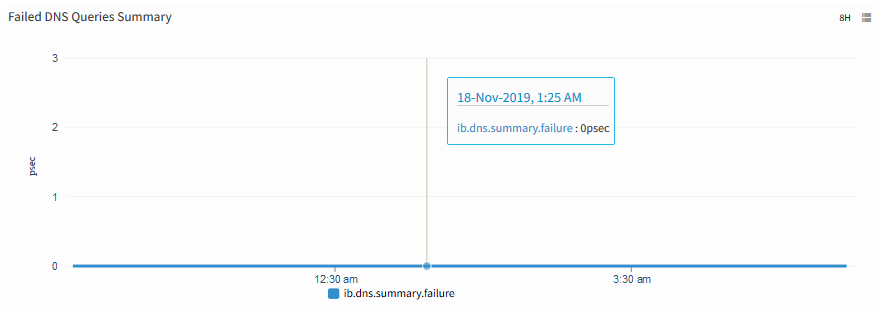
Failed DNS Queries Summary
ib.ddns.update.success
Metric Details
| Applicable for | Device |
| SNMP OID | 1.3.6.1.4.1.7779.3.1.1.3.1.3.1.0 |
| Expression | NULL |
| Description | Provides number of successful dynamic DNS updates per second. [OID: 1.3.6.1.4.1.7779.3.1.1.3.1.3.1.0] |
| Category | SNMP monitors |
| Collector Type | Gateway |
| Monitor Name | Infoblox Appliance Performance Monitoring |
| Unit | psec |
Possible Inputs
| Metric | Input Value | Range of Values |
|---|---|---|
| Frequency | 10 | 1 – 1440 (mins) |
| Filter | ||
| Warning Operator | ||
| Warning Threshold | ||
| Warning Repeat Count | ||
| Critical Operator | ||
| Critical Threshold | ||
| Critical Repeat Count | ||
| Alert | No | Yes/No |
| Graph (Yes/No) | Yes | Yes/No |
Sample Output
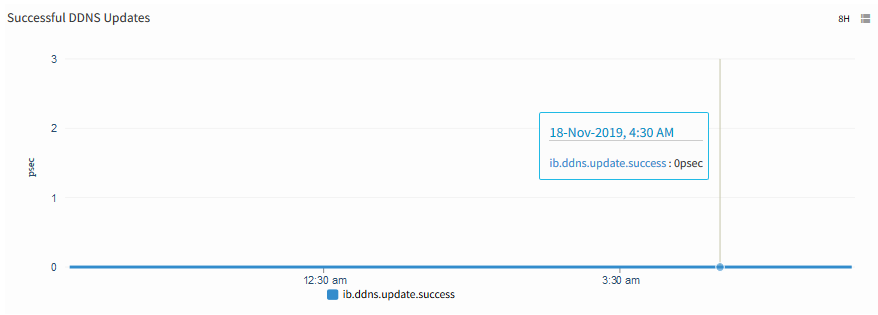
Successful DDNS Updtes
ib.ddns.update.failures
Metric Details
| Applicable for | Device |
| SNMP OID | 1.3.6.1.4.1.7779.3.1.1.3.1.3.2.0 |
| Expression | NULL |
| Description | Provides number of failure dynamic DNS updates per second. [OID: 1.3.6.1.4.1.7779.3.1.1.3.1.3.2.0] |
| Category | SNMP monitors |
| Collector Type | Gateway |
| Monitor Name | Infoblox Appliance Performance Monitoring |
| Unit | psec |
Possible Inputs
| Metric | Input Value | Range of Values |
|---|---|---|
| Frequency | 10 | 1 – 1440 (mins) |
| Filter | ||
| Warning Operator | ||
| Warning Threshold | ||
| Warning Repeat Count | ||
| Critical Operator | ||
| Critical Threshold | ||
| Critical Repeat Count | ||
| Alert | No | Yes/No |
| Graph (Yes/No) | Yes | Yes/No |
Sample Output
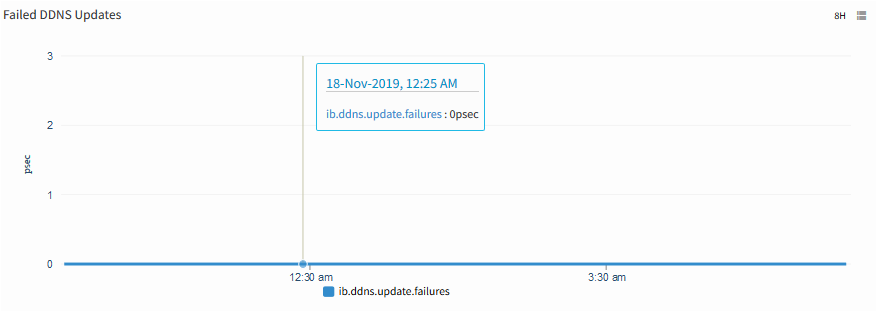
Failed DDNS Updtes
ib.ddns.update.rejects
Metric Details
| Applicable for | Device |
| SNMP OID | 1.3.6.1.4.1.7779.3.1.1.3.1.3.3.0 |
| Expression | NULL |
| Description | Provides number of dynamic DNS update rejects per second may be due to permission failure. [OID: 1.3.6.1.4.1.7779.3.1.1.3.1.3.3.0] |
| Category | SNMP monitors |
| Collector Type | Gateway |
| Monitor Name | Infoblox Appliance Performance Monitoring |
| Unit | psec |
Possible Inputs
| Metric | Input Value | Range of Values |
|---|---|---|
| Frequency | 10 | 1 – 1440 (mins) |
| Filter | ||
| Warning Operator | ||
| Warning Threshold | ||
| Warning Repeat Count | ||
| Critical Operator | ||
| Critical Threshold | ||
| Critical Repeat Count | ||
| Alert | No | Yes/No |
| Graph (Yes/No) | Yes | Yes/No |
Sample Output
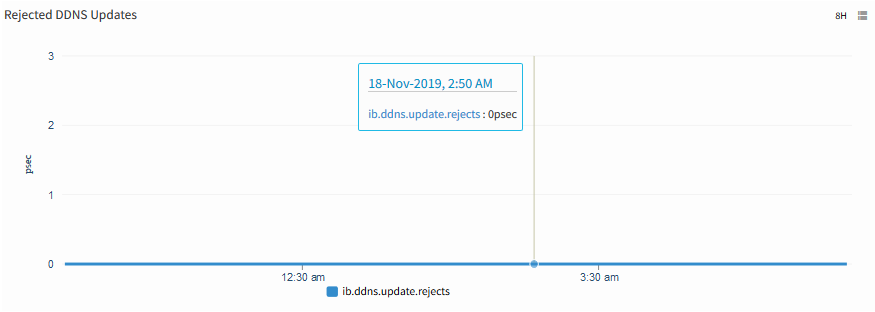
Rejected DDNS Updtes
ib.ddns.update.prerequisite.rejects
Metric Details
| Applicable for | Device |
| SNMP OID | 1.3.6.1.4.1.7779.3.1.1.3.1.3.4.0 |
| Expression | NULL |
| Description | Provides number of dynamic DNS update rejects per second due to prerequisite failure. [OID: 1.3.6.1.4.1.7779.3.1.1.3.1.3.4.0] |
| Category | SNMP monitors |
| Collector Type | Gateway |
| Monitor Name | Infoblox Appliance Performance Monitoring |
| Unit | psec |
Possible Inputs
| Metric | Input Value | Range of Values |
|---|---|---|
| Frequency | 10 | 1 – 1440 (mins) |
| Filter | ||
| Warning Operator | ||
| Warning Threshold | ||
| Warning Repeat Count | ||
| Critical Operator | ||
| Critical Threshold | ||
| Critical Repeat Count | ||
| Alert | No | Yes/No |
| Graph (Yes/No) | Yes | Yes/No |
Sample Output
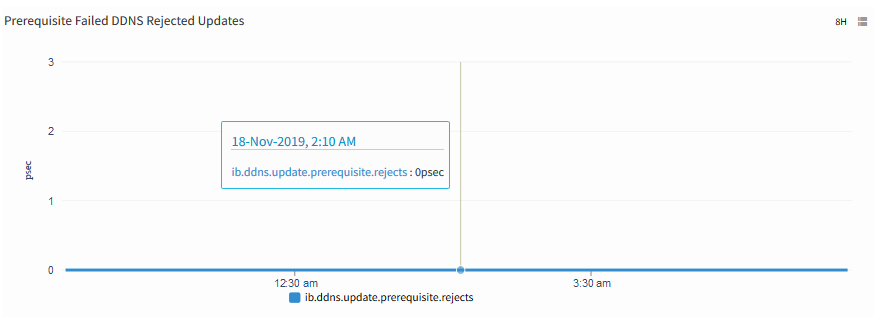
Prerequisite Failed DDNS Rejected Updtes
ib.dhcp.requests.received
Metric Details
| Applicable for | Device |
| SNMP OID | 1.3.6.1.4.1.7779.3.1.1.4.1.3.2.0 |
| Expression | NULL |
| Description | Provides number of dhcp requests received per second. [OID: 1.3.6.1.4.1.7779.3.1.1.4.1.3.2.0] |
| Category | SNMP monitors |
| Collector Type | Gateway |
| Monitor Name | Infoblox Appliance Performance Monitoring |
| Unit | psec |
Possible Inputs
| Metric | Input Value | Range of Values |
|---|---|---|
| Frequency | 10 | 1 – 1440 (mins) |
| Filter | ||
| Warning Operator | ||
| Warning Threshold | ||
| Warning Repeat Count | ||
| Critical Operator | ||
| Critical Threshold | ||
| Critical Repeat Count | ||
| Alert | No | Yes/No |
| Graph (Yes/No) | Yes | Yes/No |
Sample Output
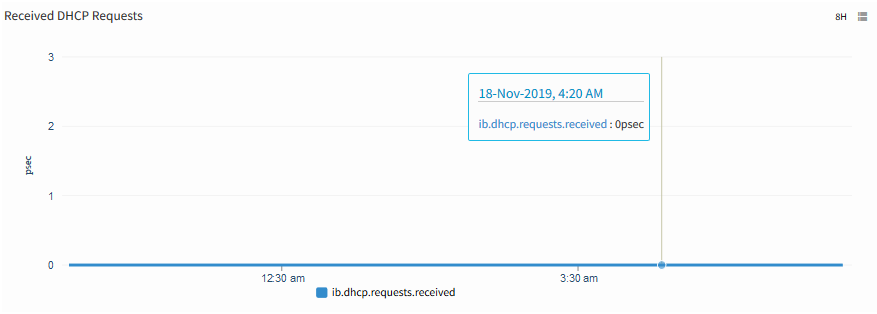
Received DHCP Requests
ib.dhcp.offers.sent
Metric Details
| Applicable for | Device |
| SNMP OID | 1.3.6.1.4.1.7779.3.1.1.4.1.3.4.0 |
| Expression | NULL |
| Description | Provides number of dhcp offers sent per second. [OID: 1.3.6.1.4.1.7779.3.1.1.4.1.3.4.0] |
| Category | SNMP monitors |
| Collector Type | Gateway |
| Monitor Name | Infoblox Appliance Performance Monitoring |
| Unit | psec |
Possible Inputs
| Metric | Input Value | Range of Values |
|---|---|---|
| Frequency | 10 | 1 – 1440 (mins) |
| Filter | ||
| Warning Operator | ||
| Warning Threshold | ||
| Warning Repeat Count | ||
| Critical Operator | ||
| Critical Threshold | ||
| Critical Repeat Count | ||
| Alert | No | Yes/No |
| Graph (Yes/No) | Yes | Yes/No |
Sample Output
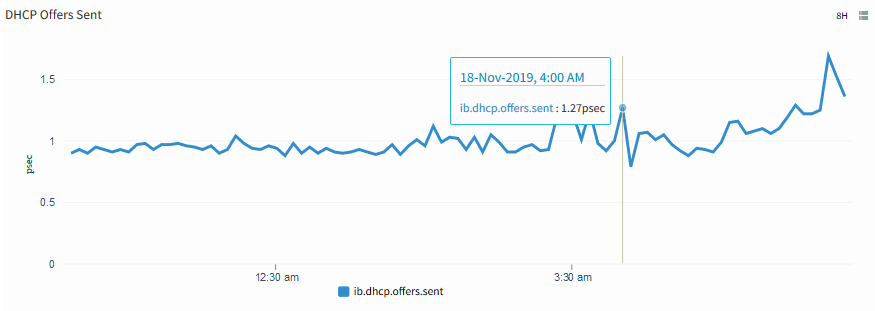
DHCP Offers Sent
ib.dhcp.releases.received
Metric Details
| Applicable for | Device |
| SNMP OID | 1.3.6.1.4.1.7779.3.1.1.4.1.3.3.0 |
| Expression | NULL |
| Description | Provides number of dhcp releases received per second. [OID: 1.3.6.1.4.1.7779.3.1.1.4.1.3.3.0] |
| Category | SNMP monitors |
| Collector Type | Gateway |
| Monitor Name | Infoblox Appliance Performance Monitoring |
| Unit | psec |
Possible Inputs
| Metric | Input Value | Range of Values |
|---|---|---|
| Frequency | 10 | 1 – 1440 (mins) |
| Filter | ||
| Warning Operator | ||
| Warning Threshold | ||
| Warning Repeat Count | ||
| Critical Operator | ||
| Critical Threshold | ||
| Critical Repeat Count | ||
| Alert | No | Yes/No |
| Graph (Yes/No) | Yes | Yes/No |
Sample Output
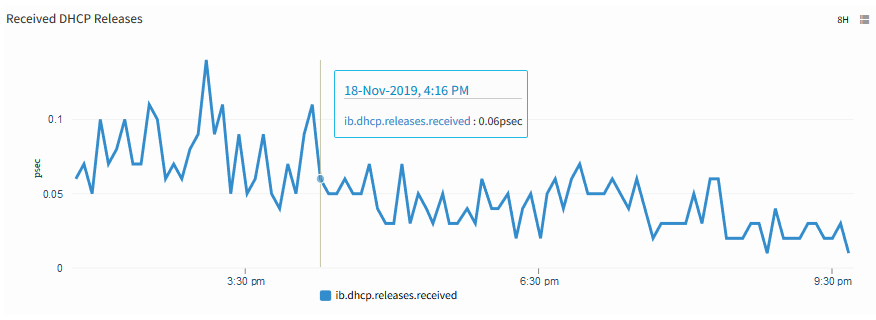
Received DHCP Releases
ib.dhcp.acks.sent
Metric Details
| Applicable for | Device |
| SNMP OID | 1.3.6.1.4.1.7779.3.1.1.4.1.3.5.0 |
| Expression | NULL |
| Description | Provides number of DHCP acknowledgements sent per second. [OID: 1.3.6.1.4.1.7779.3.1.1.4.1.3.5.0] |
| Category | SNMP monitors |
| Collector Type | Gateway |
| Monitor Name | Infoblox Appliance Performance Monitoring |
| Unit | psec |
Possible Inputs
| Metric | Input Value | Range of Values |
|---|---|---|
| Frequency | 10 | 1 – 1440 (mins) |
| Filter | ||
| Warning Operator | ||
| Warning Threshold | ||
| Warning Repeat Count | ||
| Critical Operator | ||
| Critical Threshold | ||
| Critical Repeat Count | ||
| Alert | No | Yes/No |
| Graph (Yes/No) | Yes | Yes/No |
Sample Output
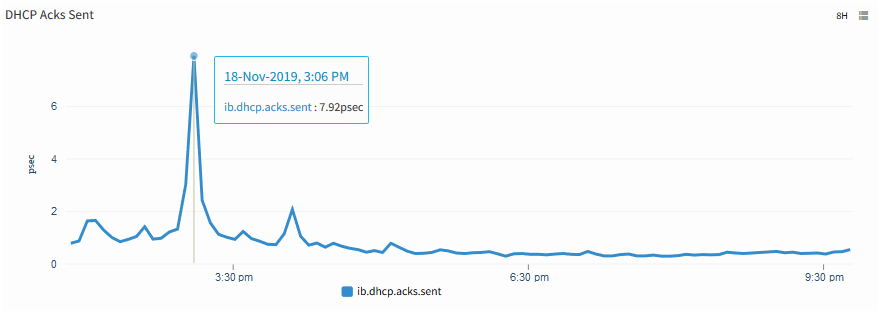
DHCP Acks Sent
ib.dhcp.nacks.sent
Metric Details
| Applicable for | Device |
| SNMP OID | 1.3.6.1.4.1.7779.3.1.1.4.1.3.6.0 |
| Expression | NULL |
| Description | Provides number of DHCP negative acknowledgements sent per second. [OID: 1.3.6.1.4.1.7779.3.1.1.4.1.3.6.0] |
| Category | SNMP monitors |
| Collector Type | Gateway |
| Monitor Name | Infoblox Appliance Performance Monitoring |
| Unit | psec |
Possible Inputs
| Metric | Input Value | Range of Values |
|---|---|---|
| Frequency | 10 | 1 – 1440 (mins) |
| Filter | ||
| Warning Operator | ||
| Warning Threshold | ||
| Warning Repeat Count | ||
| Critical Operator | ||
| Critical Threshold | ||
| Critical Repeat Count | ||
| Alert | No | Yes/No |
| Graph (Yes/No) | Yes | Yes/No |
Sample Output
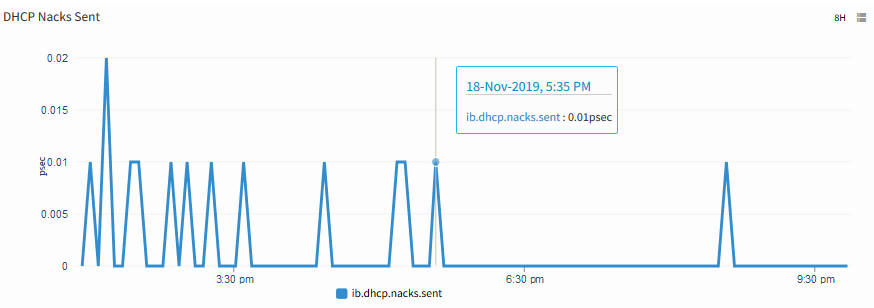
DHCP Nacks Sent
ib.dhcp.declines.received
Metric Details
| Applicable for | Device |
| SNMP OID | 1.3.6.1.4.1.7779.3.1.1.4.1.3.7.0 |
| Expression | NULL |
| Description | Provides number of DHCP declines received per second. [OID: 1.3.6.1.4.1.7779.3.1.1.4.1.3.7.0] |
| Category | SNMP monitors |
| Collector Type | Gateway |
| Monitor Name | Infoblox Appliance Performance Monitoring |
| Unit | psec |
Possible Inputs
| Metric | Input Value | Range of Values |
|---|---|---|
| Frequency | 10 | 1 – 1440 (mins) |
| Filter | ||
| Warning Operator | ||
| Warning Threshold | ||
| Warning Repeat Count | ||
| Critical Operator | ||
| Critical Threshold | ||
| Critical Repeat Count | ||
| Alert | No | Yes/No |
| Graph (Yes/No) | Yes | Yes/No |
Sample Output
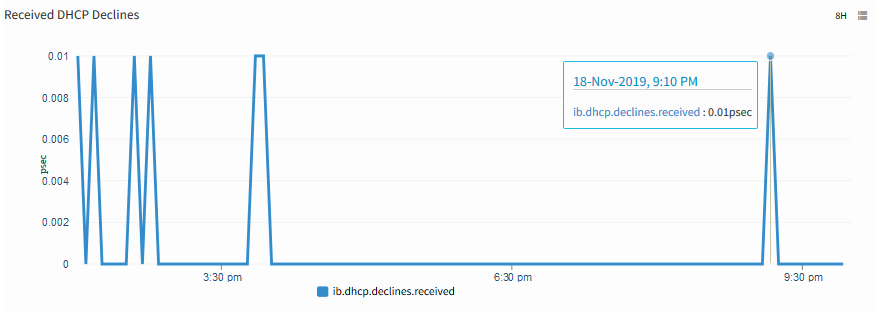
Received DHCP Declines
ib.dhcp.discovers.received
Metric Details
| Applicable for | Device |
| SNMP OID | 1.3.6.1.4.1.7779.3.1.1.4.1.3.1.0 |
| Expression | NULL |
| Description | Monitors the number of discovery messages received per second. [OID: 1.3.6.1.4.1.7779.3.1.1.4.1.3.1] |
| Category | SNMP monitors |
| Collector Type | Gateway |
| Monitor Name | Infoblox Appliance Performance Monitoring |
| Unit | psec |
Possible Inputs
| Metric | Input Value | Range of Values |
|---|---|---|
| Frequency | 10 | 1 – 1440 (mins) |
| Filter | ||
| Warning Operator | ||
| Warning Threshold | ||
| Warning Repeat Count | ||
| Critical Operator | ||
| Critical Threshold | ||
| Critical Repeat Count | ||
| Alert | No | Yes/No |
| Graph (Yes/No) | Yes | Yes/No |
Sample Output
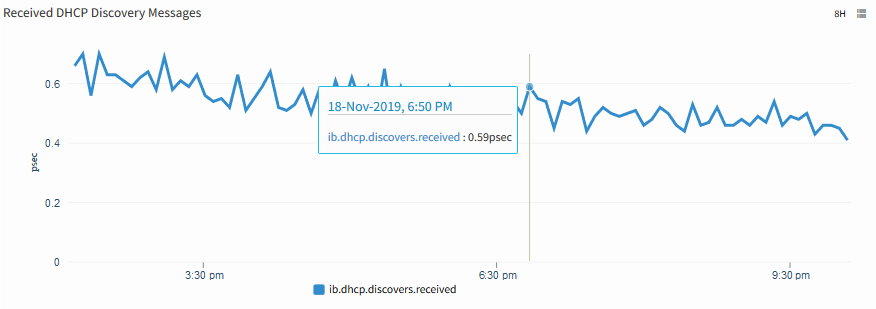
eceived DHCP Discovery Messages
ib.dhcp.informs.received
Metric Details
| Applicable for | Device |
| SNMP OID | 1.3.6.1.4.1.7779.3.1.1.4.1.3.8.0 |
| Expression | NULL |
| Description | Monitors the number of informs received per second. [OID: 1.3.6.1.4.1.7779.3.1.1.4.1.3.8] |
| Category | SNMP monitors |
| Collector Type | Gateway |
| Monitor Name | Infoblox Appliance Performance Monitoring |
| Unit | psec |
Possible Inputs
| Metric | Input Value | Range of Values |
|---|---|---|
| Frequency | 10 | 1 – 1440 (mins) |
| Filter | ||
| Warning Operator | ||
| Warning Threshold | ||
| Warning Repeat Count | ||
| Critical Operator | ||
| Critical Threshold | ||
| Critical Repeat Count | ||
| Alert | No | Yes/No |
| Graph (Yes/No) | Yes | Yes/No |
Sample Output
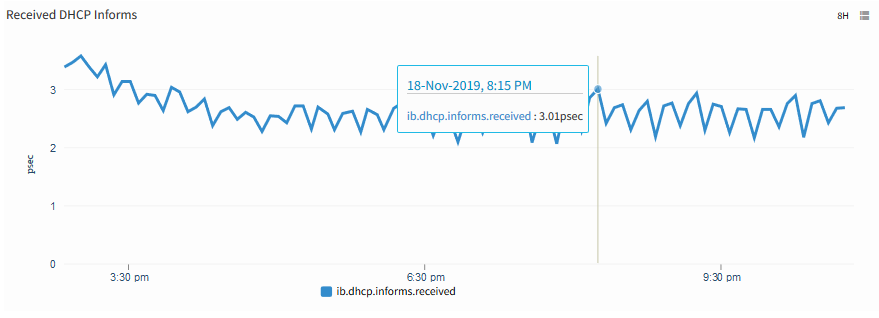
eceived DHCP Informs
ib.dhcp.others.received
Metric Details
| Applicable for | Device |
| SNMP OID | 1.3.6.1.4.1.7779.3.1.1.4.1.3.9.0 |
| Expression | NULL |
| Description | Monitors the number of other messages received per second. [OID: 1.3.6.1.4.1.7779.3.1.1.4.1.3.9] |
| Category | SNMP monitors |
| Collector Type | Gateway |
| Monitor Name | Infoblox Appliance Performance Monitoring |
| Unit | psec |
Possible Inputs
| Metric | Input Value | Range of Values |
|---|---|---|
| Frequency | 10 | 1 – 1440 (mins) |
| Filter | ||
| Warning Operator | ||
| Warning Threshold | ||
| Warning Repeat Count | ||
| Critical Operator | ||
| Critical Threshold | ||
| Critical Repeat Count | ||
| Alert | No | Yes/No |
| Graph (Yes/No) | Yes | Yes/No |
Sample Output
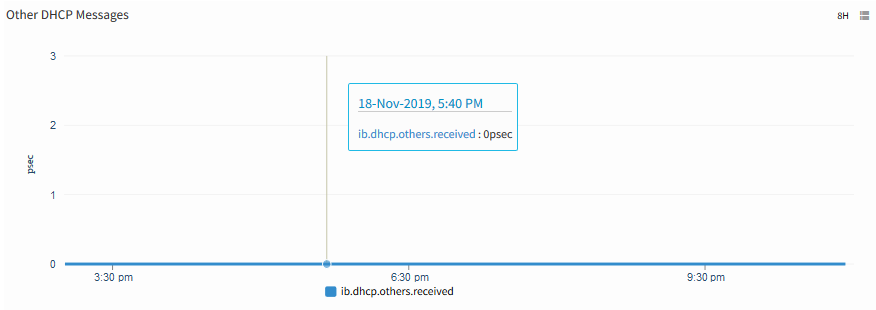
Other DHCP Messages
ib.dns.hitratio
Metric Details
| Applicable for | Device |
| SNMP OID | 1.3.6.1.4.1.7779.3.1.1.3.1.5.0 |
| Expression | NULL |
| Description | Monitors the dns hit ratio. [OID: 1.3.6.1.4.1.7779.3.1.1.3.1.5] |
| Category | SNMP monitors |
| Collector Type | Gateway |
| Monitor Name | Infoblox Appliance Performance Monitoring |
| Unit | None |
Possible Inputs
| Metric | Input Value | Range of Values |
|---|---|---|
| Frequency | 10 | 1 – 1440 (mins) |
| Filter | ||
| Warning Operator | ||
| Warning Threshold | ||
| Warning Repeat Count | ||
| Critical Operator | ||
| Critical Threshold | ||
| Critical Repeat Count | ||
| Alert | No | Yes/No |
| Graph (Yes/No) | Yes | Yes/No |
Sample Output
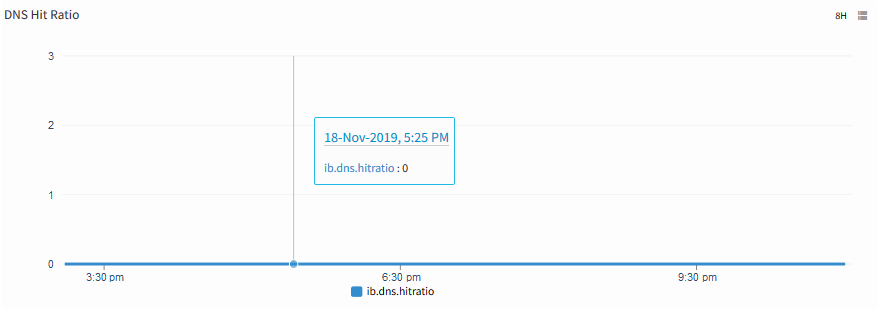
DNS Hit Ratio
ib.node.replication.status
Metric Details
| Applicable for | Device |
| SNMP OID | 1.3.6.1.4.1.7779.3.1.1.2.1.2.1.2, 1.3.6.1.4.1.7779.3.1.1.2.1.2.1.4 |
| Expression | ibNodeReplicationStatus |
| Description | Provides the current status of replication between Infoblox appliances (if Primary and Secondary are configured). Does not make sense on a standalone Infoblox appliance. Replication status can only be checked if this appliance is "Active" in the grid. [OIDs: 1.3.6.1.4.1.7779.3.1.1.2.1.2.1.1, 1.3.6.1.4.1.7779.3.1.1.2.1.2.1.2, 1.3.6.1.4.1.7779.3.1.1.2.1.13, 1.3.6.1.4.1.7779.3.1.1.2.1.2.1.4] |
| Category | SNMP monitors |
| Collector Type | Gateway |
| Monitor Name | Infoblox Replication Status |
| Unit |
Possible Inputs
| Metric | Input Value | Range of Values |
|---|---|---|
| Frequency | 10 | 1 – 1440 (mins) |
| Filter | hostGridStatus Equals Ignore Case Active | |
| Warning Operator | ||
| Warning Threshold | ||
| Warning Repeat Count | ||
| Critical Operator | EQUALS_IGNORE_CASE | Ends with, ==, !=, >=, <=, >, <, In Range, Out of range, Equals, Not equals, Equals Ignore Case, Not Equals Ignore Case, Contains, Not contains, Regex match, Regex no match, In string list, Not in string list, In List, Not in list, Starts with |
| Critical Threshold | Offline | 0...255 |
| Critical Repeat Count | 1 | 1-12 |
| Alert | Yes | Yes/No |
| Graph (Yes/No) | No | Yes/No |
Sample Output
No graph
ib.node.queuesize.frommaster
Metric Details
| Applicable for | Device |
| SNMP OID | 1.3.6.1.4.1.7779.3.1.1.2.1.2.1.3 |
| Expression | NULL |
| Description | Monitors the sent queue size from master. [OID: 1.3.6.1.4.1.7779.3.1.1.2.1.2.1.3] |
| Category | SNMP monitors |
| Collector Type | Gateway |
| Monitor Name | Infoblox Replication Status |
| Unit | None |
Possible Inputs
| Metric | Input Value | Range of Values |
|---|---|---|
| Frequency | 10 | 1 – 1440 (mins) |
| Filter | hostGridStatus Equals Ignore Case Active | |
| Warning Operator | ||
| Warning Threshold | ||
| Warning Repeat Count | ||
| Critical Operator | ||
| Critical Threshold | ||
| Critical Repeat Count | ||
| Alert | No | Yes/No |
| Graph (Yes/No) | Yes | Yes/No |
Sample Output
No graph
ib.node.queuesize.tomaster
Metric Details
| Applicable for | Device |
| SNMP OID | 1.3.6.1.4.1.7779.3.1.1.2.1.2.1.5 |
| Expression | NULL |
| Description | Monitors the receive queue size to master. [OID: 1.3.6.1.4.1.7779.3.1.1.2.1.2.1.5] |
| Category | SNMP monitors |
| Collector Type | Gateway |
| Monitor Name | Infoblox Replication Status |
| Unit | None |
Possible Inputs
| Metric | Input Value | Range of Values |
|---|---|---|
| Frequency | 10 | 1 – 1440 (mins) |
| Filter | hostGridStatus Equals Ignore Case Active | Warning Operator |
| Warning Threshold | ||
| Warning Repeat Count | ||
| Critical Operator | ||
| Critical Threshold | ||
| Critical Repeat Count | ||
| Alert | No | Yes/No |
| Graph (Yes/No) | Yes | Yes/No |
Sample Output
No graph
ib.node1.temperature
Metric Details
| Applicable for | Device |
| SNMP OID | 1.3.6.1.4.1.7779.3.1.1.2.1.10.1.3 |
| Expression | MATCHER(ibNode1ServiceDesc, '(+|-){1}(d+.*d*)') |
| Description | Monitors the Infoblox Node1 temperature. [OID: 1.3.6.1.4.1.7779.3.1.1.2.1.10.1.1, 1.3.6.1.4.1.7779.3.1.1.2.1.10.1.3] |
| Category | SNMP monitors |
| Collector Type | Gateway |
| Monitor Name | Infoblox Physical Node1 Temperature |
| Unit | C |
Possible Inputs
| Metric | Input Value | Range of Values |
|---|---|---|
| Frequency | 10 | 1 – 1440 (mins) |
| Filter | NULL | Not Applicable |
| Warning Operator | GREATER_THAN | Ends with, ==, !=, >=, <=, >, <, In Range, Out of range, Equals, Not equals, Equals Ignore Case, Not Equals Ignore Case, Contains, Not contains, Regex match, Regex no match, In string list, Not in string list, In List, Not in list, Starts with |
| Warning Threshold | 48 | 0 - 2147483647 |
| Warning Repeat Count | 1 | 1-12 |
| Critical Operator | GREATER_THAN | Ends with, ==, !=, >=, <=, >, <, In Range, Out of range, Equals, Not equals, Equals Ignore Case, Not Equals Ignore Case, Contains, Not contains, Regex match, Regex no match, In string list, Not in string list, In List, Not in list, Starts with |
| Critical Threshold | 52 | 0 - 2147483647 |
| Critical Repeat Count | 1 | 1-12 |
| Alert | Yes | Yes/No |
| Graph (Yes/No) | Yes | Yes/No |
Sample Output
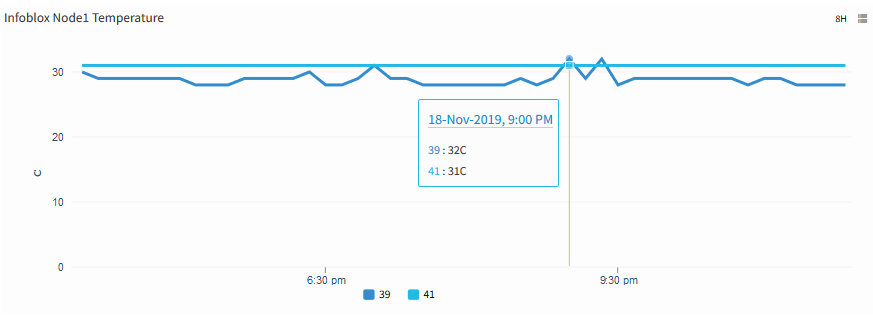
Inflobox Node1 Temperature
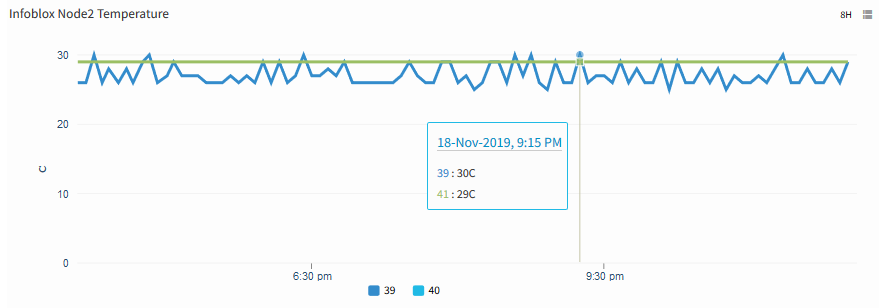
ib.node2.temperature
Metric Details
| Applicable for | Device |
| SNMP OID | 1.3.6.1.4.1.7779.3.1.1.2.1.11.1.3 |
| Expression | MATCHER(ibNode2ServiceDesc, '(+|-){1}(d+.*d*)') |
| Description | Monitors the Infoblox Node2 temperatures. [OID: 1.3.6.1.4.1.7779.3.1.1.2.1.11.1.1, 1.3.6.1.4.1.7779.3.1.1.2.1.11.1.3] |
| Category | SNMP monitors |
| Collector Type | Gateway |
| Monitor Name | Infoblox Physical Node2 Temperature |
| Unit | C |
Possible Inputs
| Metric | Input Value | Range of Values |
|---|---|---|
| Frequency | 10 | 1 – 1440 (mins) |
| Filter | NULL | Not Applicable |
| Warning Operator | GREATER_THAN | Ends with, ==, !=, >=, <=, >, <, In Range, Out of range, Equals, Not equals, Equals Ignore Case, Not Equals Ignore Case, Contains, Not contains, Regex match, Regex no match, In string list, Not in string list, In List, Not in list, Starts with |
| Warning Threshold | 48 | 0 - 2147483647 |
| Warning Repeat Count | 1 | 1-12 |
| Critical Operator | GREATER_THAN | Ends with, ==, !=, >=, <=, >, <, In Range, Out of range, Equals, Not equals, Equals Ignore Case, Not Equals Ignore Case, Contains, Not contains, Regex match, Regex no match, In string list, Not in string list, In List, Not in list, Starts with |
| Critical Threshold | 52 | 0 - 2147483647 |
| Critical Repeat Count | 1 | 1-12 |
| Alert | Yes | Yes/No |
| Graph (Yes/No) | Yes | Yes/No |
Sample Output