Description
Applicable only on QFX series devices. Monitors CPU utilization, memory utilization, buffer utilization, CPU load, temperature, operational state, FRU state and device uptime.
Prerequisites
SNMP should be enabled in end device and device should support JUNIPER-HOSTRESOURCES-MIB OIDs and SNMP credentials should be attached against the device in portal.
How to Apply: This template is All instance selection based and Automatic select instance based. It will not ask user to select any instance (s) while assigning it to a device.
Metric Parameters
| Parameter | Description |
|---|---|
| Frequency | Warning Threshold | If the metric value satisfies the condition defined along with Warning Threshold value, then a notification is sent to the user. |
| Critical Threshold | If the metric value satisfies the condition defined along with Critical Threshold value, then a notification is sent to the user. |
| Alert | The alert value can be set to either Yes or No. If it is Yes, then an alert message is sent to the user. |
Metrics
system.uptime
Metric Details
| Applicable for | Device |
| SNMP OID | 1.3.6.1.2.1.1.3.0 |
| Expression | sysUpTime/100 |
| Description | The time since the SNMP agent in the system was last re-initialized.[OID : 1.3.6.1.2.1.1.3.0] |
| Category | SNMP monitors |
| Collector Type | Gateway |
| Monitor Name | System Uptime |
| Unit | s |
Possible Inputs
| Metric | Input Value | Range of Values |
|---|---|---|
| Frequency | 15 | 1 – 1440 (mins) |
| Filter | ||
| Warning Operator | ||
| Warning Threshold | ||
| Warning Repeat Count | ||
| Critical Operator | LESS_THAN_EQUAL | Ends with, ==, !=, >=, <=, >, <, In Range, Out of range, Equals, Not equals, Equals Ignore Case, Not Equals Ignore Case, Contains, Not contains, Regex match, Regex no match, In string list, Not in string list, In List, Not in list, Starts with |
| Critical Threshold | 1800 | 0 - 4294967295 |
| Critical Repeat Count | 1 | 1-12 |
| Alert | Yes | Yes/No |
| Graph (Yes/No) | Yes | Yes/No |
Sample Output
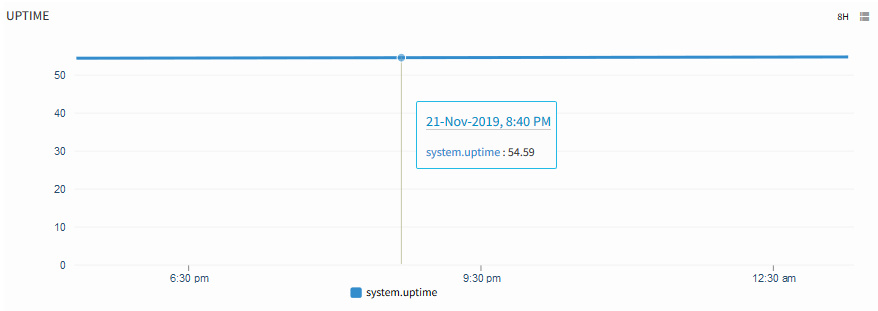
UPTIME
juniper.common.app.storageutilization
Metric Details
| Applicable for | Device |
| SNMP OID | 1.3.6.1.4.1.2636.3.31.1.1.1.1 |
| Expression | NULL |
| Description | The amount of the storage used by each file system on the router in percentage. [OIDs: 1.3.6.1.2.1.25.2.3.1.2, 1.3.6.1.2.1.25.2.3.1.3, 1.3.6.1.4.1.2636.3.31.1.1.1.1] |
| Category | SNMP monitors |
| Collector Type | Gateway |
| Monitor Name | Juniper Storage Utilization |
| Unit | % |
Possible Inputs
| Metric | Input Value | Range of Values |
|---|---|---|
| Frequency | 15 | 1 – 1440 (mins) |
| Filter | hrStorageType In string list Name | |
| Warning Operator | GREATER_THAN_EQUAL | Ends with, ==, !=, >=, <=, >, <, In Range, Out of range, Equals, Not equals, Equals Ignore Case, Not Equals Ignore Case, Contains, Not contains, Regex match, Regex no match, In string list, Not in string list, In List, Not in list, Starts with |
| Warning Threshold | 80 | 0-100 |
| Warning Repeat Count | 1 | 1-12 |
| Critical Operator | GREATER_THAN_EQUAL | Ends with, ==, !=, >=, <=, >, <, In Range, Out of range, Equals, Not equals, Equals Ignore Case, Not Equals Ignore Case, Contains, Not contains, Regex match, Regex no match, In string list, Not in string list, In List, Not in list, Starts with |
| Critical Threshold | 90 | 0-100 |
| Critical Repeat Count | 1 | 1-12 |
| Alert | Yes | Yes/No |
| Graph (Yes/No) | Yes | Yes/No |
Sample Output
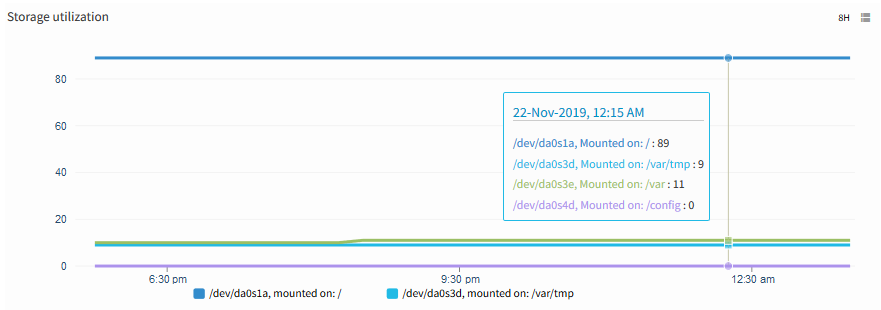
Storage Utilization
juniper.fru.state
Metric Details
| Applicable for | Device |
| SNMP OID | 1.3.6.1.4.1.2636.3.42.2.2.7.1.8 |
| Expression | NULL |
| Description | Indicates the FRU state of this subject. Possible states are 1- Unknown 2- Empty 3- Present 4- Ready 5- announceOnline 6- Online 7- anounceOffline 8- offline, 9-diagnostic, 10-standby. |
| Category | SNMP monitors |
| Collector Type | Gateway |
| Monitor Name | Juniper QFabric - FRU |
| Unit |
Possible Inputs
| Metric | Input Value | Range of Values |
|---|---|---|
| Frequency | 15 | 1 – 1440 (mins) |
| Filter | NULL | Not Applicable |
| Warning Operator | IN_LIST | Ends with, ==, !=, >=, <=, >, <, In Range, Out of range, Equals, Not equals, Equals Ignore Case, Not Equals Ignore Case, Contains, Not contains, Regex match, Regex no match, In string list, Not in string list, In List, Not in list, Starts with |
| Warning Threshold | 1,7 | [{"1":"unknown"},{"2":"empty"},{"3":"present"},{"4":"ready"},{"5":"announceOnline"},{"6":"online"},{"7":"anounceOffline"},{"8":"offline"},{"9":"diagnostic"},{"10":"standby"}] |
| Warning Repeat Count | 1 | 1-12 |
| Critical Operator | EQUAL | Ends with, ==, !=, >=, <=, >, <, In Range, Out of range, Equals, Not equals, Equals Ignore Case, Not Equals Ignore Case, Contains, Not contains, Regex match, Regex no match, In string list, Not in string list, In List, Not in list, Starts with |
| Critical Threshold | 8 | [{"1":"unknown"},{"2":"empty"},{"3":"present"},{"4":"ready"},{"5":"announceOnline"},{"6":"online"},{"7":"anounceOffline"},{"8":"offline"},{"9":"diagnostic"},{"10":"standby"}] |
| Critical Repeat Count | 1 | 1-12 |
| Alert | Yes | Yes/No |
| Graph (Yes/No) | Yes | Yes/No |
Sample Output
No graph
juniper.fru.type
Metric Details
| Applicable for | Device |
| SNMP OID | 1.3.6.1.4.1.2636.3.42.2.2.7.1.6 |
| Expression | NULL |
| Description | The FRU type for this subject. |
| Category | SNMP monitors |
| Collector Type | Gateway |
| Monitor Name | Juniper QFabric - FRU |
| Unit |
Possible Inputs
| Metric | Input Value | Range of Values |
|---|---|---|
| Frequency | 15 | 1 – 1440 (mins) |
| Filter | NULL | Not Applicable |
| Warning Operator | ||
| Warning Threshold | ||
| Warning Repeat Count | ||
| Critical Operator | ||
| Critical Threshold | ||
| Critical Repeat Count | ||
| Alert | No | Yes/No |
| Graph (Yes/No) | No | Yes/No |
Sample Output
No graph
juniper.virtualchassis.fru.temperature
Metric Details
| Applicable for | Device |
| SNMP OID | 1.3.6.1.4.1.2636.3.42.2.2.7.1.9 |
| Expression | NULL |
| Description | Monitors the temperature in Celsius (degrees C). The value of this monitor is zero if unavailable or inapplicable. |
| Category | SNMP monitors |
| Collector Type | Gateway |
| Monitor Name | Juniper QFabric - FRU |
| Unit | C |
Possible Inputs
| Metric | Input Value | Range of Values |
|---|---|---|
| Frequency | 15 | 1 – 1440 (mins) |
| Filter | NULL | Not Applicable |
| Warning Operator | GREATER_THAN_EQUAL | Ends with, ==, !=, >=, <=, >, <, In Range, Out of range, Equals, Not equals, Equals Ignore Case, Not Equals Ignore Case, Contains, Not contains, Regex match, Regex no match, In string list, Not in string list, In List, Not in list, Starts with |
| Warning Threshold | 48 | 0 - 2147483647 |
| Warning Repeat Count | 1 | 1-12 |
| Critical Operator | GREATER_THAN_EQUAL | Ends with, ==, !=, >=, <=, >, <, In Range, Out of range, Equals, Not equals, Equals Ignore Case, Not Equals Ignore Case, Contains, Not contains, Regex match, Regex no match, In string list, Not in string list, In List, Not in list, Starts with |
| Critical Threshold | 52 | 0 - 2147483647 |
| Critical Repeat Count | 1 | 1-12 |
| Alert | Yes | Yes/No |
| Graph (Yes/No) | Yes | Yes/No |
Sample Output
No graph
memory.utilization
Metric Details
| Applicable for | Device |
| SNMP OID | 1.3.6.1.4.1.2636.3.42.2.2.5.1.12, 1.3.6.1.4.1.2636.3.42.2.2.5.1.15 |
| Expression | jnxFabricOperatingHeap |
| Description | Indicates the heap utilization in percentage. Zero if unavailable or inapplicable. |
| Category | SNMP monitors |
| Collector Type | Gateway |
| Monitor Name | Juniper QFabric - Memory |
| Unit | % |
Possible Inputs
| Metric | Input Value | Range of Values |
|---|---|---|
| Frequency | 15 | 1 – 1440 (mins) |
| Filter | Name Regex no match | |
| Warning Operator | GREATER_THAN_EQUAL | Ends with, ==, !=, >=, <=, >, <, In Range, Out of range, Equals, Not equals, Equals Ignore Case, Not Equals Ignore Case, Contains, Not contains, Regex match, Regex no match, In string list, Not in string list, In List, Not in list, Starts with |
| Warning Threshold | 80 | 0-100 |
| Warning Repeat Count | 1 | 1-12 |
| Critical Operator | GREATER_THAN_EQUAL | Ends with, ==, !=, >=, <=, >, <, In Range, Out of range, Equals, Not equals, Equals Ignore Case, Not Equals Ignore Case, Contains, Not contains, Regex match, Regex no match, In string list, Not in string list, In List, Not in list, Starts with |
| Critical Threshold | 90 | 0-100 |
| Critical Repeat Count | 1 | 1-12 |
| Alert | Yes | Yes/No |
| Graph (Yes/No) | Yes | Yes/No |
Sample Output
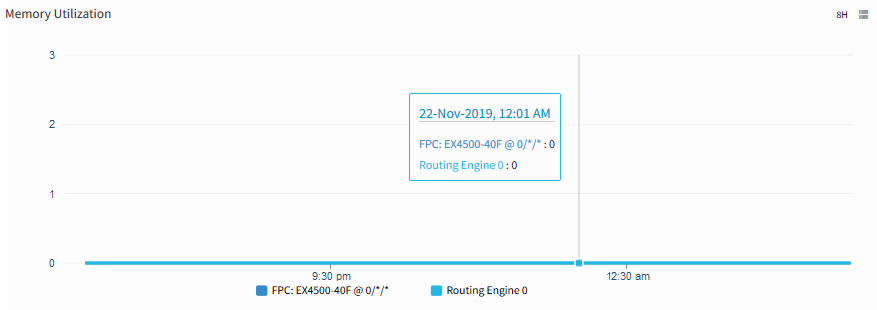
Memory Utilization
juniper.buffer.utilization
Metric Details
| Applicable for | Device |
| SNMP OID | 1.3.6.1.4.1.2636.3.42.2.2.5.1.11 |
| Expression | NULL |
| Description | The buffer pool utilization in percentage. Zero if unavailable or inapplicable. |
| Category | SNMP monitors |
| Collector Type | Gateway |
| Monitor Name | Juniper QFabric - Memory |
| Unit | % |
Possible Inputs
| Metric | Input Value | Range of Values |
|---|---|---|
| Frequency | 15 | 1 – 1440 (mins) |
| Filter | Name Regex no match | |
| Warning Operator | GREATER_THAN_EQUAL | Ends with, ==, !=, >=, <=, >, <, In Range, Out of range, Equals, Not equals, Equals Ignore Case, Not Equals Ignore Case, Contains, Not contains, Regex match, Regex no match, In string list, Not in string list, In List, Not in list, Starts with |
| Warning Threshold | 90 | 0-100 |
| Warning Repeat Count | 1 | 1-12 |
| Critical Operator | GREATER_THAN_EQUAL | Ends with, ==, !=, >=, <=, >, <, In Range, Out of range, Equals, Not equals, Equals Ignore Case, Not Equals Ignore Case, Contains, Not contains, Regex match, Regex no match, In string list, Not in string list, In List, Not in list, Starts with |
| Critical Threshold | 95 | 0-100 |
| Critical Repeat Count | 1 | 1-12 |
| Alert | Yes | Yes/No |
| Graph (Yes/No) | Yes | Yes/No |
Sample Output
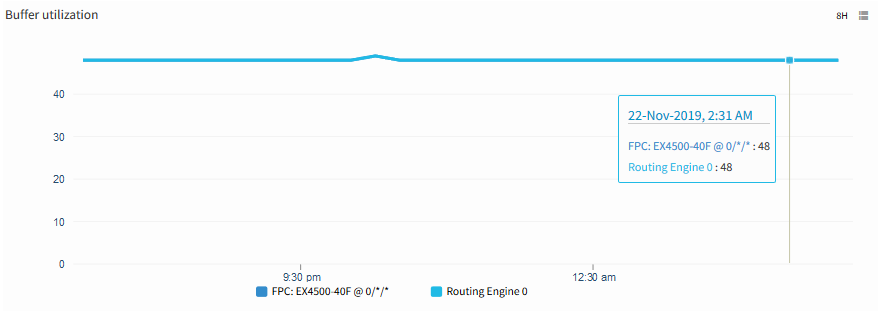
Buffer Utilization
juniper.buffer.free
Metric Details
| Applicable for | Device |
| SNMP OID | NULL |
| Expression | (1-(jnxFabricOperatingBuffer/100))*(jnxFabricOperatingMemory*1000000) |
| Description | Monitors the buffer pool free. |
| Category | SNMP monitors |
| Collector Type | Gateway |
| Monitor Name | Juniper QFabric - Memory |
| Unit | Bytes |
Possible Inputs
| Metric | Input Value | Range of Values |
|---|---|---|
| Frequency | 15 | 1 – 1440 (mins) |
| Filter | Name Regex no match | |
| Warning Operator | ||
| Warning Threshold | ||
| Warning Repeat Count | ||
| Critical Operator | ||
| Critical Threshold | ||
| Critical Repeat Count | ||
| Alert | No | Yes/No |
| Graph (Yes/No) | Yes | Yes/No |
Sample Output
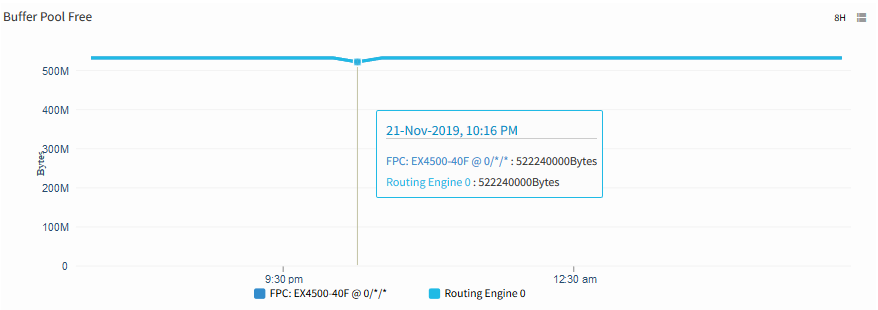
Buffer Pool free
cpu.utilization
Metric Details
| Applicable for | Device |
| SNMP OID | 1.3.6.1.4.1.2636.3.42.2.2.5.1.8 |
| Expression | NULL |
| Description | Monitors the CPU usage. Zero if unavailable or inapplicable |
| Category | SNMP monitors |
| Collector Type | Gateway |
| Monitor Name | Juniper QFabric - CPU |
| Unit | % |
Possible Inputs
| Metric | Input Value | Range of Values |
|---|---|---|
| Frequency | 15 | 1 – 1440 (mins) |
| Filter | Name Regex no match | Warning Operator | GREATER_THAN_EQUAL | Ends with, ==, !=, >=, <=, >, <, In Range, Out of range, Equals, Not equals, Equals Ignore Case, Not Equals Ignore Case, Contains, Not contains, Regex match, Regex no match, In string list, Not in string list, In List, Not in list, Starts with |
| Warning Threshold | 80 | 0-100 |
| Warning Repeat Count | 2 | 1-12 |
| Critical Operator | GREATER_THAN_EQUAL | Ends with, ==, !=, >=, <=, >, <, In Range, Out of range, Equals, Not equals, Equals Ignore Case, Not Equals Ignore Case, Contains, Not contains, Regex match, Regex no match, In string list, Not in string list, In List, Not in list, Starts with |
| Critical Threshold | 90 | 0-100 |
| Critical Repeat Count | 2 | 1-12 |
| Alert | Yes | Yes/No |
| Graph (Yes/No) | Yes | Yes/No |
Sample Output
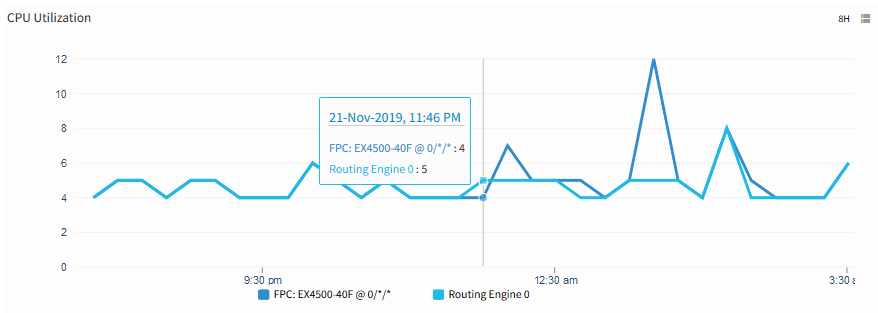
CPU Utilization
cpu.load
Metric Details
| Applicable for | Device |
| SNMP OID | 1.3.6.1.4.1.2636.3.42.2.2.5.1.21 |
| Expression | NULL |
| Description | Routing Engine load averages for the last 5 min. This value needs to be correlated with CPU usage. A value lesser than 100 indicates normal operation. A value in the range of 100-300 along with a CPU utilization of greater than 70% could require some investigation. |
| Category | SNMP monitors |
| Collector Type | Gateway |
| Monitor Name | Juniper QFabric - CPU |
| Unit | % |
Possible Inputs
| Metric | Input Value | Range of Values |
|---|---|---|
| Frequency | 15 | 1 – 1440 (mins) |
| Filter | Name Regex no match | |
| Warning Operator | GREATER_THAN_EQUAL | Ends with, ==, !=, >=, <=, >, <, In Range, Out of range, Equals, Not equals, Equals Ignore Case, Not Equals Ignore Case, Contains, Not contains, Regex match, Regex no match, In string list, Not in string list, In List, Not in list, Starts with |
| Warning Threshold | 100 | |
| Warning Repeat Count | 1 | 1-12 |
| Critical Operator | GREATER_THAN_EQUAL | Ends with, ==, !=, >=, <=, >, <, In Range, Out of range, Equals, Not equals, Equals Ignore Case, Not Equals Ignore Case, Contains, Not contains, Regex match, Regex no match, In string list, Not in string list, In List, Not in list, Starts with |
| Critical Threshold | 300 | |
| Critical Repeat Count | 1 | 1-12 |
| Alert | Yes | Yes/No |
| Graph (Yes/No) | Yes | Yes/No |
Sample Output
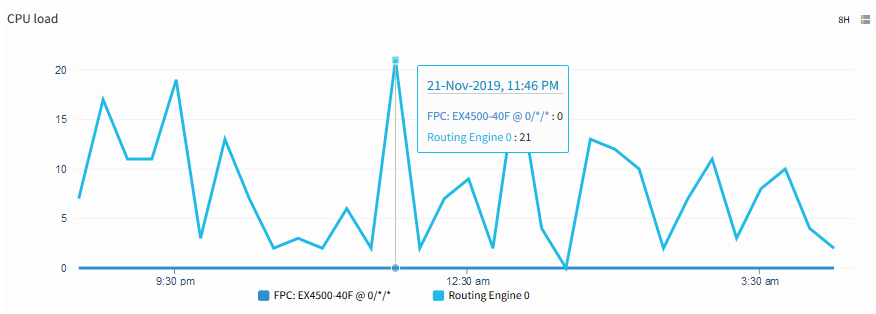
CPU load
system.temperature
Metric Details
| Applicable for | Device |
| SNMP OID | 1.3.6.1.4.1.2636.3.42.2.2.5.1.7 |
| Expression | NULL |
| Description | The temperature in Celsius (degrees C) of this subject. Zero if unavailable or inapplicable. |
| Category | SNMP monitors |
| Collector Type | Gateway |
| Monitor Name | Juniper QFabric - Temperature |
| Unit | C |
Possible Inputs
| Metric | Input Value | Range of Values |
|---|---|---|
| Frequency | 15 | 1 – 1440 (mins) |
| Filter | Name Regex no match | |
| Warning Operator | GREATER_THAN_EQUAL | Ends with, ==, !=, >=, <=, >, <, In Range, Out of range, Equals, Not equals, Equals Ignore Case, Not Equals Ignore Case, Contains, Not contains, Regex match, Regex no match, In string list, Not in string list, In List, Not in list, Starts with |
| Warning Threshold | 40 | 0 - 2147483647 |
| Warning Repeat Count | 1 | 1-12 |
| Critical Operator | GREATER_THAN_EQUAL | Ends with, ==, !=, >=, <=, >, <, In Range, Out of range, Equals, Not equals, Equals Ignore Case, Not Equals Ignore Case, Contains, Not contains, Regex match, Regex no match, In string list, Not in string list, In List, Not in list, Starts with |
| Critical Threshold | 44 | 0 - 2147483647 |
| Critical Repeat Count | 1 | 1-12 |
| Alert | Yes | Yes/No |
| Graph (Yes/No) | Yes | Yes/No |
Sample Output
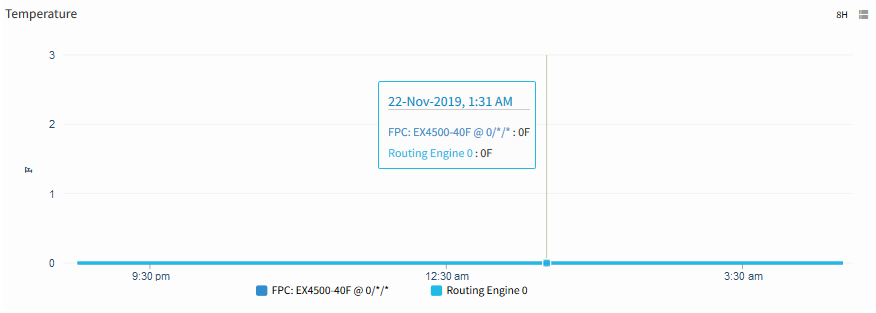
Temperature
juniper.operational.state
Metric Details
| Applicable for | Device |
| SNMP OID | 1.3.6.1.4.1.2636.3.42.2.2.5.1.6 |
| Expression | NULL |
| Description | Indicates the operating state of this subject. Possible values are 1- Unknown 2- Running 3- Ready 4- Reset 5- Running at full speed 6- Down 7- Standby. |
| Category | SNMP monitors |
| Collector Type | Gateway |
| Monitor Name | Juniper QFabric - Operating State |
| Unit |
Possible Inputs
| Metric | Input Value | Range of Values |
|---|---|---|
| Frequency | 15 | 1 – 1440 (mins) |
| Filter | NULL | Not Applicable |
| Warning Operator | IN_LIST | Ends with, ==, !=, >=, <=, >, <, In Range, Out of range, Equals, Not equals, Equals Ignore Case, Not Equals Ignore Case, Contains, Not contains, Regex match, Regex no match, In string list, Not in string list, In List, Not in list, Starts with |
| Warning Threshold | 1,4 | [{"1":"unknown"},{"2":"running"},{"3":"ready"},{"4":"reset"},{"5":"runningAtFullSpeed"},{"6":"down"},{"7":"standby"}] |
| Warning Repeat Count | 1 | 1-12 |
| Critical Operator | EQUAL | Ends with, ==, !=, >=, <=, >, <, In Range, Out of range, Equals, Not equals, Equals Ignore Case, Not Equals Ignore Case, Contains, Not contains, Regex match, Regex no match, In string list, Not in string list, In List, Not in list, Starts with |
| Critical Threshold | 6 | [{"1":"unknown"},{"2":"running"},{"3":"ready"},{"4":"reset"},{"5":"runningAtFullSpeed"},{"6":"down"},{"7":"standby"}] |
| Critical Repeat Count | 1 | 1-12 |
| Alert | Yes | Yes/No |
| Graph (Yes/No) | Yes | Yes/No |
Sample Output
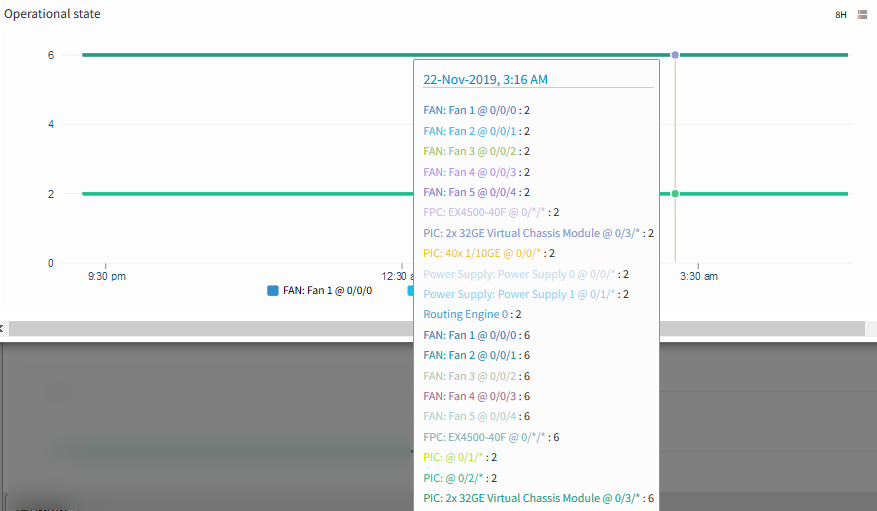
Operational State
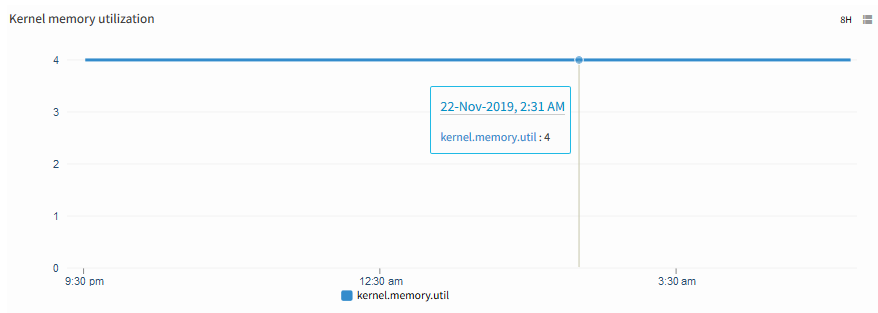
kernel.memory.util
Metric Details
| Applicable for | Device |
| SNMP OID | 1.3.6.1.4.1.2636.3.42.2.2.1.1.13 |
| Expression | NULL |
| Description | The percentage of kernel memory used of this subject. 0 if unavailable or inapplicable. |
| Category | SNMP monitors |
| Collector Type | Gateway |
| Monitor Name | Juniper QFabric - Kernel Memory Utilization |
| Unit | % |
Possible Inputs
| Metric | Input Value | Range of Values |
|---|---|---|
| Frequency | 15 | 1 – 1440 (mins) |
| Filter | NULL | Not Applicable |
| Warning Operator | GREATER_THAN_EQUAL | Ends with, ==, !=, >=, <=, >, <, In Range, Out of range, Equals, Not equals, Equals Ignore Case, Not Equals Ignore Case, Contains, Not contains, Regex match, Regex no match, In string list, Not in string list, In List, Not in list, Starts with |
| Warning Threshold | 80 | 0-100 |
| Warning Repeat Count | 1 | 1-12 |
| Critical Operator | GREATER_THAN_EQUAL | Ends with, ==, !=, >=, <=, >, <, In Range, Out of range, Equals, Not equals, Equals Ignore Case, Not Equals Ignore Case, Contains, Not contains, Regex match, Regex no match, In string list, Not in string list, In List, Not in list, Starts with |
| Critical Threshold | 90 | 0-100 |
| Critical Repeat Count | 1 | 1-12 |
| Alert | Yes | Yes/No |
| Graph (Yes/No) | Yes | Yes/No |
Sample Output