Description
This template is applicable for aggregate resources. This template monitors aggregate metrics.
Prerequisites
The device should be added using integrations. The corresponding resource should exist. Gateway should be up and running. Storage Array should be reachable from Gateway. Storage Array and its resources should be in managed state.
Metric Parameters
| Parameter | Description |
|---|---|
| Frequency | Warning Threshold | If the metric value satisfies the condition defined along with Warning Threshold value, then a notification is sent to the user. |
| Critical Threshold | If the metric value satisfies the condition defined along with Critical Threshold value, then a notification is sent to the user. |
| Alert | The alert value can be set to either Yes or No. If it is Yes, then an alert message is sent to the user. |
Metrics
netapp.cluster.aggregate.state
Metric Details
| Applicable for | Device |
| Description | Aggregate state. |
| Category | Netapp Cluster |
| Collector Type | Gateway |
| Monitor Name | Netapp Cluster Aggregate Monitor |
| Unit | NULL |
Possible Inputs
| Metric | Input Value | Range of Values |
|---|---|---|
| Frequency | 5 | 1 – 1440 (mins) |
| Filter | ||
| Warning Operator | ||
| Warning Threshold | ||
| Warning Repeat Count | ||
| Critical Operator | INS | Ends with, ==, !=, >=, <=, >, <, In Range, Out of range, Equals, Not equals, Equals Ignore Case, Not Equals Ignore Case, Contains, Not contains, Regex match, Regex no match, In string list, Not in string list, In List, Not in list, Starts with |
| Critical Threshold | destroying, failed, frozen, inconsistent | [{"creating":"1"},{"destroying":"2"},{"failed":"3"},{"frozen":"4"},{"inconsistent":"5"},{"iron_restricted":"6"},{"mounting":"7"},{"online":"8"},{"offline":"9"},{"partial":"10"},{"quiesced":"11"},{"quiescing":"12"},{"restricted":"13"},{"reverted":"14"},{"unknown":"15"},{"unmounted":"16"},{"unmounting":"17"},{"relocating":"18"},{"undefined":"19"}] |
| Critical Repeat Count | 1 | 1-12 |
| Alert | Yes | Yes/No |
| Graph (Yes/No) | Yes | Yes/No |
Sample Output
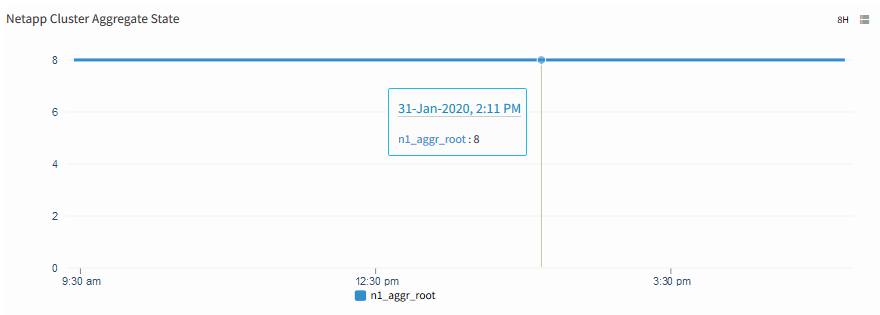
Netapp Cluster Aggregate State
netapp.cluster.aggregate.percent-used-capacity
Metric Details
| Applicable for | Device |
| Description | Percentage of aggregate used. |
| Category | Netapp Cluster |
| Collector Type | Gateway |
| Monitor Name | Netapp Cluster Aggregate Monitor |
| Unit | % |
Possible Inputs
| Metric | Input Value | Range of Values |
|---|---|---|
| Frequency | 5 | 1 – 1440 (mins) |
| Filter | ||
| Warning Operator | GREATER_THAN_EQUAL | Ends with, ==, !=, >=, <=, >, <, In Range, Out of range, Equals, Not equals, Equals Ignore Case, Not Equals Ignore Case, Contains, Not contains, Regex match, Regex no match, In string list, Not in string list, In List, Not in list, Starts with |
| Warning Threshold | 80 | 0-100 |
| Warning Repeat Count | 1 | 1-12 |
| Critical Operator | GREATER_THAN_EQUAL | Ends with, ==, !=, >=, <=, >, <, In Range, Out of range, Equals, Not equals, Equals Ignore Case, Not Equals Ignore Case, Contains, Not contains, Regex match, Regex no match, In string list, Not in string list, In List, Not in list, Starts with |
| Critical Threshold | 90 | 0-100 |
| Critical Repeat Count | 1 | 1-12 |
| Alert | Yes | Yes/No |
| Graph (Yes/No) | Yes | Yes/No |
Sample Output
No graph
netapp.cluster.aggregate.raid-status
Metric Details
| Applicable for | Device |
| Description | Raid status. |
| Category | Netapp Cluster |
| Collector Type | Gateway |
| Monitor Name | Netapp Cluster Aggregate Monitor |
| Unit | NULL |
Possible Inputs
| Metric | Input Value | Range of Values |
|---|---|---|
| Frequency | 5 | 1 – 1440 (mins) |
| Filter | ||
| Warning Operator | ||
| Warning Threshold | ||
| Warning Repeat Count | ||
| Critical Operator | ||
| Critical Threshold | ||
| Critical Repeat Count | ||
| Alert | No | Yes/No |
| Graph (Yes/No) | Yes | Yes/No |
Sample Output
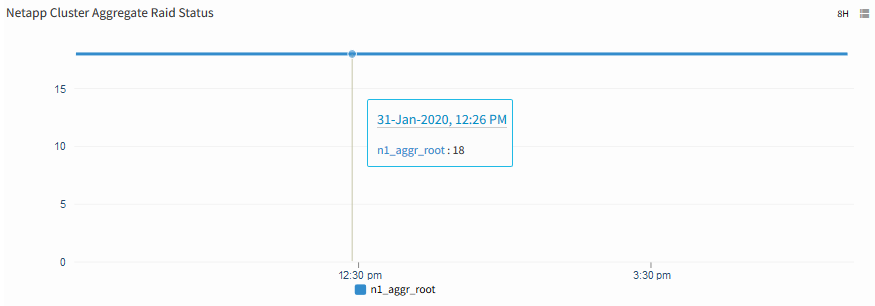
Netapp Cluster Aggregate Raid Status
netapp.cluster.aggregate.total_transfers
Metric Details
| Applicable for | Device |
| Description | Total number of transfers per second serviced by the aggregate. |
| Category | Netapp Cluster |
| Collector Type | Gateway |
| Monitor Name | Netapp Cluster Aggregate Monitor |
| Unit | s |
Possible Inputs
| Metric | Input Value | Range of Values |
|---|---|---|
| Frequency | 5 | 1 – 1440 (mins) |
| Filter | ||
| Warning Operator | ||
| Warning Threshold | ||
| Warning Repeat Count | ||
| Critical Operator | ||
| Critical Threshold | ||
| Critical Repeat Count | ||
| Alert | No | Yes/No |
| Graph (Yes/No) | Yes | Yes/No |
Sample Output
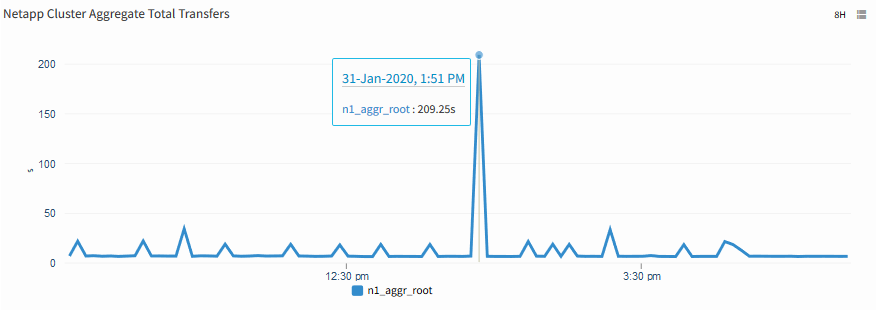
Netapp Cluster Aggregate Total Transfers
netapp.cluster.aggregate.user_reads
Metric Details
| Applicable for | Device |
| Description | Number of user reads per second to the aggregate. |
| Category | Netapp Cluster |
| Collector Type | Gateway |
| Monitor Name | Netapp Cluster Aggregate Monitor |
| Unit | s |
Possible Inputs
| Metric | Input Value | Range of Values |
|---|---|---|
| Frequency | 5 | 1 – 1440 (mins) |
| Filter | ||
| Warning Operator | ||
| Warning Threshold | ||
| Warning Repeat Count | ||
| Critical Operator | ||
| Critical Threshold | ||
| Critical Repeat Count | ||
| Alert | No | Yes/No |
| Graph (Yes/No) | Yes | Yes/No |
Sample Output
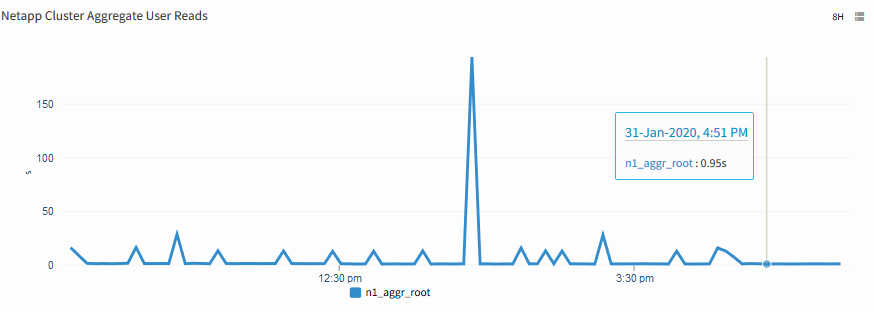
Netapp Cluster Aggregate User Reads
netapp.cluster.aggregate.user_writes
Metric Details
| Applicable for | Device |
| Description | Number of user writes per second to the aggregate. |
| Category | Netapp Cluster |
| Collector Type | Gateway |
| Monitor Name | Netapp Cluster Aggregate Monitor |
| Unit | s |
Possible Inputs
| Metric | Input Value | Range of Values |
|---|---|---|
| Frequency | 5 | 1 – 1440 (mins) |
| Filter | ||
| Warning Operator | ||
| Warning Threshold | ||
| Warning Repeat Count | ||
| Critical Operator | ||
| Critical Threshold | ||
| Critical Repeat Count | ||
| Alert | No | Yes/No |
| Graph (Yes/No) | Yes | Yes/No |
Sample Output
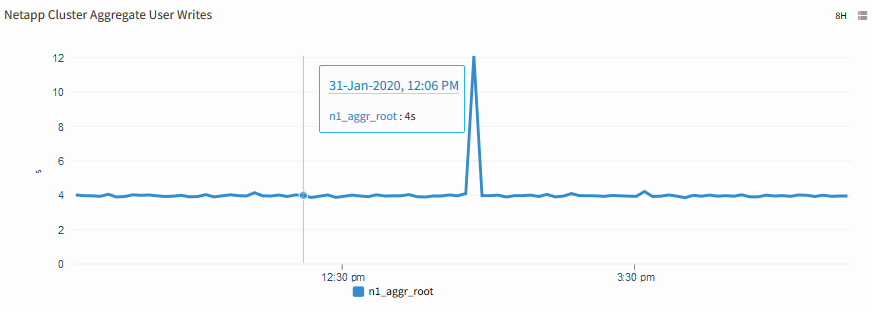
Netapp Cluster Aggregate User Writes
netapp.cluster.aggregate.size-available
Metric Details
| Applicable for | Device |
| Description | Available size in the aggregate. |
| Category | Netapp Cluster |
| Collector Type | Gateway |
| Monitor Name | Netapp Cluster Aggregate Monitor |
| Unit | GB |
Possible Inputs
| Metric | Input Value | Range of Values |
|---|---|---|
| Frequency | 5 | 1 – 1440 (mins) |
| Filter | ||
| Warning Operator | ||
| Warning Threshold | ||
| Warning Repeat Count | ||
| Critical Operator | ||
| Critical Threshold | ||
| Critical Repeat Count | ||
| Alert | No | Yes/No |
| Graph (Yes/No) | Yes | Yes/No |
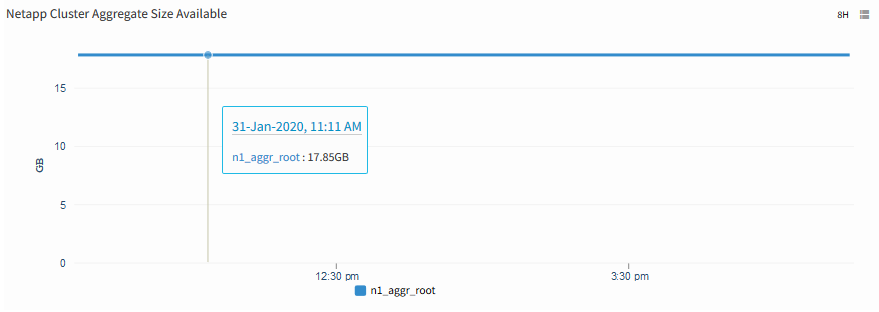
Sample Output
