Description
Template for NetApp storage devices. Monitors Hardware components like Disk, FAN, Power Supply, Temperature, NVRAM battery status including the Global status like Volume, CPU, Fabric port & switch details.
Prerequisites
SNMP should be enabled in end device and device should support NETAPP-MIB OIDs and SNMP credentials should be attached against the device in portal.
How to Apply: This template is All instance selection based. It will not ask user to select any instance(s) while assigning it to a device.
Metric Parameters
| Parameter | Description |
|---|---|
| Frequency | Warning Threshold | If the metric value satisfies the condition defined along with Warning Threshold value, then a notification is sent to the user. |
| Critical Threshold | If the metric value satisfies the condition defined along with Critical Threshold value, then a notification is sent to the user. |
| Alert | The alert value can be set to either Yes or No. If it is Yes, then an alert message is sent to the user. |
Metrics
system.uptime
Metric Details
| Applicable for | Device |
| SNMP OID | 1.3.6.1.2.1.1.3.0 |
| Expression | sysUpTime/100 |
| Description | The time since the SNMP agent in the system was last re-initialized.[OID : 1.3.6.1.2.1.1.3.0] |
| Category | SNMP monitors |
| Collector Type | Gateway |
| Monitor Name | System Uptime |
| Unit | s |
Possible Inputs
| Metric | Input Value | Range of Values |
|---|---|---|
| Frequency | 5 | 1 – 1440 (mins) |
| Filter | ||
| Warning Operator | ||
| Warning Threshold | ||
| Warning Repeat Count | ||
| Critical Operator | LESS_THAN_EQUAL | Ends with, ==, !=, >=, <=, >, <, In Range, Out of range, Equals, Not equals, Equals Ignore Case, Not Equals Ignore Case, Contains, Not contains, Regex match, Regex no match, In string list, Not in string list, In List, Not in list, Starts with |
| Critical Threshold | 1800 | |
| Critical Repeat Count | 1 | 1-12 |
| Alert | Yes | Yes/No |
| Graph (Yes/No) | Yes | Yes/No |
Sample Output
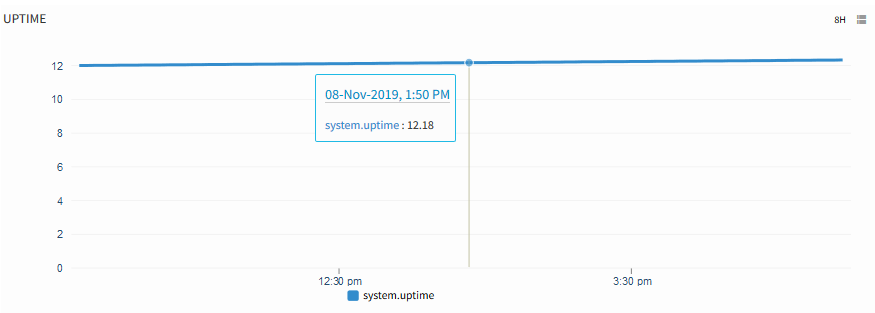
UPTIME
netapp.cpu.utilization
Metric Details
| Applicable for | Device |
| SNMP OID | 1.3.6.1.4.1.789.1.2.1.3.0 |
| Expression | NULL |
| Description | Monitors the NetApp CPU utilization in Percentage(%). [OID: 1.3.6.1.4.1.789.1.2.1.3.0]. |
| Category | SNMP monitors |
| Collector Type | Gateway |
| Monitor Name | NetApp CPU utilization |
| Unit | % |
Possible Inputs
| Metric | Input Value | Range of Values |
|---|---|---|
| Frequency | 5 | 1 – 1440 (mins) |
| Filter | ||
| Warning Operator | GREATER_THAN_EQUAL | Ends with, ==, !=, >=, <=, >, <, In Range, Out of range, Equals, Not equals, Equals Ignore Case, Not Equals Ignore Case, Contains, Not contains, Regex match, Regex no match, In string list, Not in string list, In List, Not in list, Starts with |
| Warning Threshold | 80 | 0-100 |
| Warning Repeat Count | 2 | 1-12 |
| Critical Operator | GREATER_THAN_EQUAL | Ends with, ==, !=, >=, <=, >, <, In Range, Out of range, Equals, Not equals, Equals Ignore Case, Not Equals Ignore Case, Contains, Not contains, Regex match, Regex no match, In string list, Not in string list, In List, Not in list, Starts with |
| Critical Threshold | 90 | 0-100 |
| Critical Repeat Count | 2 | 1-12 |
| Alert | Yes | Yes/No |
| Graph (Yes/No) | Yes | Yes/No |
Sample Output
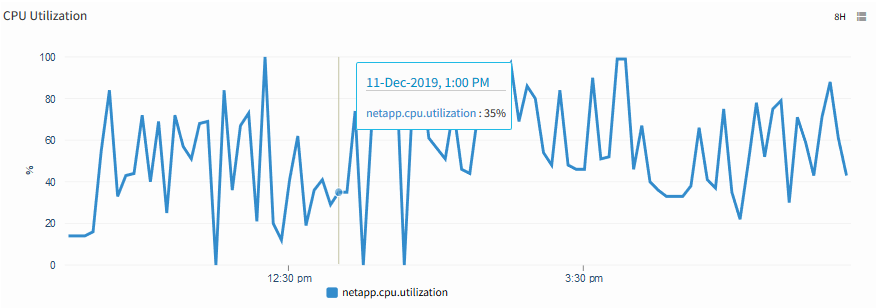
CPU Utilization
netapp.cpu.idle.time
Metric Details
| Applicable for | Device |
| SNMP OID | 1.3.6.1.4.1.789.1.2.1.5.0 |
| Expression | NULL |
| Description | Displays the NetApp CPU Idle time in Percentage (%). [OID: 1.3.6.1.4.1.789.1.2.1.5.0]. |
| Category | SNMP monitors |
| Collector Type | Gateway |
| Monitor Name | NetApp CPU utilization |
| Unit | % |
Possible Inputs
| Metric | Input Value | Range of Values |
|---|---|---|
| Frequency | 5 | 1 – 1440 (mins) |
| Filter | ||
| Warning Operator | ||
| Warning Threshold | ||
| Warning Repeat Count | ||
| Critical Operator | ||
| Critical Threshold | ||
| Critical Repeat Count | ||
| Alert | No | Yes/No |
| Graph (Yes/No) | Yes | Yes/No |
Sample Output
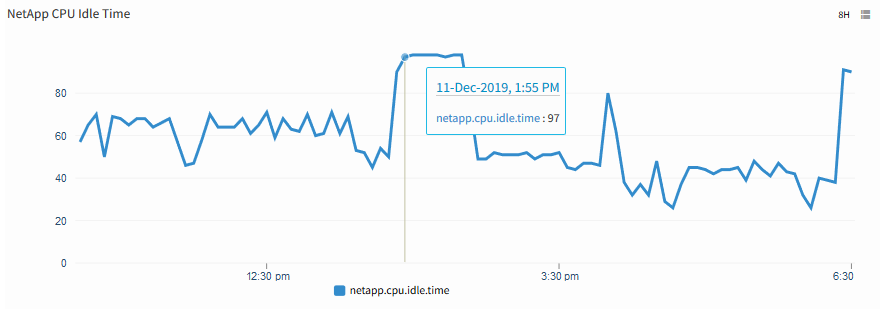
NetApp CPU Idle Time
netapp.port.status
Metric Details
| Applicable for | Device |
| SNMP OID | 1.3.6.1.4.1.789.1.11.4.1.4, 1.3.6.1.4.1.789.1.11.4.1.7 |
| Expression | portState |
| Description | Provides the current state of the port which is connected to Fabric. [OID: 1.3.6.1.4.1.789.1.11.4.1.2, 1.3.6.1.4.1.789.1.11.4.1.7]. |
| Category | SNMP monitors |
| Collector Type | Gateway |
| Monitor Name | NetApp Fabric Port Status |
| Unit |
Possible Inputs
| Metric | Input Value | Range of Values |
|---|---|---|
| Frequency | 5 | 1 – 1440 (mins) |
| Filter | NULL | Not Applicable |
| Warning Operator | IN_LIST | Ends with, ==, !=, >=, <=, >, <, In Range, Out of range, Equals, Not equals, Equals Ignore Case, Not Equals Ignore Case, Contains, Not contains, Regex match, Regex no match, In string list, Not in string list, In List, Not in list, Starts with |
| Warning Threshold | 2,4 | [{"1":"Online"},{"2":"Offline"},{"3":"Testing"},{"4":"Faulty"},{"5":"Unknown"}] |
| Warning Repeat Count | 1 | 1-12 |
| Critical Operator | IN_LIST | Ends with, ==, !=, >=, <=, >, <, In Range, Out of range, Equals, Not equals, Equals Ignore Case, Not Equals Ignore Case, Contains, Not contains, Regex match, Regex no match, In string list, Not in string list, In List, Not in list, Starts with |
| Critical Threshold | 3,5 | [{"1":"Online"},{"2":"Offline"},{"3":"Testing"},{"4":"Faulty"},{"5":"Unknown"}] |
| Critical Repeat Count | 1 | 1-12 |
| Alert | Yes | Yes/No |
| Graph (Yes/No) | Yes | Yes/No |
Sample Output
No graph
netapp.fabric.status
Metric Details
| Applicable for | Device |
| SNMP OID | 1.3.6.1.4.1.789.1.11.2.1.2, 1.3.6.1.4.1.789.1.11.2.1.3 |
| Expression | fabricStatus |
| Description | Provides the overall status of the SAN Fabric, indicates the WWN (world wide name) of the fabric along with the status message. [OID: 1.3.6.1.4.1.789.1.11.2.1.4, 1.3.6.1.4.1.789.1.11.2.1.3, 1.3.6.1.4.1.789.1.11.2.1.2] |
| Category | SNMP monitors |
| Collector Type | Gateway |
| Monitor Name | NetApp Fabric Status |
| Unit |
Possible Inputs
| Metric | Input Value | Range of Values |
|---|---|---|
| Frequency | 5 | 1 – 1440 (mins) |
| Filter | NULL | Not Applicable |
| Warning Operator | EQUAL | Ends with, ==, !=, >=, <=, >, <, In Range, Out of range, Equals, Not equals, Equals Ignore Case, Not Equals Ignore Case, Contains, Not contains, Regex match, Regex no match, In string list, Not in string list, In List, Not in list, Starts with |
| Warning Threshold | 3 | [{"1":"Ok"},{"2":"Faulty"},{"3":"Unknown"}] |
| Warning Repeat Count | 1 | 1-12 |
| Critical Operator | EQUAL | Ends with, ==, !=, >=, <=, >, <, In Range, Out of range, Equals, Not equals, Equals Ignore Case, Not Equals Ignore Case, Contains, Not contains, Regex match, Regex no match, In string list, Not in string list, In List, Not in list, Starts with |
| Critical Threshold | 2 | [{"1":"Ok"},{"2":"Faulty"},{"3":"Unknown"}] |
| Critical Repeat Count | 1 | 1-12 |
| Alert | Yes | Yes/No |
| Graph (Yes/No) | Yes | Yes/No |
Sample Output
No graph
netapp.fabric.switch.status
Metric Details
| Applicable for | Device |
| SNMP OID | 1.3.6.1.4.1.789.1.11.3.1.3, 1.3.6.1.4.1.789.1.11.3.1.7, 1.3.6.1.4.1.789.1.11.3.1.8, 1.3.6.1.4.1.789.1.11.3.1.4 |
| Expression | switchStatus |
| Description | Provides the current status and status message of the switch which is connected to fabric. [OID: 1.3.6.1.4.1.789.1.11.3.1.2, 1.3.6.1.4.1.789.1.11.3.1.7, 1.3.6.1.4.1.789.1.11.3.1.8]. |
| Category | SNMP monitors |
| Collector Type | Gateway |
| Monitor Name | NetApp Fabric Switch Status |
| Unit |
Possible Inputs
| Metric | Input Value | Range of Values |
|---|---|---|
| Frequency | 5 | 1 – 1440 (mins) |
| Filter | NULL | Not Applicable |
| Warning Operator | IN_LIST | Ends with, ==, !=, >=, <=, >, <, In Range, Out of range, Equals, Not equals, Equals Ignore Case, Not Equals Ignore Case, Contains, Not contains, Regex match, Regex no match, In string list, Not in string list, In List, Not in list, Starts with |
| Warning Threshold | 1,2,4 | [{"1":"Other"},{"2":"Unknown"},{"3":"Ok"},{"4":"nonCritical"},{"5":"Critical"},{"6":"nonRecoverable"}] |
| Warning Repeat Count | 1 | 1-12 |
| Critical Operator | IN_LIST | Ends with, ==, !=, >=, <=, >, <, In Range, Out of range, Equals, Not equals, Equals Ignore Case, Not Equals Ignore Case, Contains, Not contains, Regex match, Regex no match, In string list, Not in string list, In List, Not in list, Starts with |
| Critical Threshold | 5,6 | [{"1":"Other"},{"2":"Unknown"},{"3":"Ok"},{"4":"nonCritical"},{"5":"Critical"},{"6":"nonRecoverable"}] |
| Critical Repeat Count | 1 | 1-12 |
| Alert | Yes | Yes/No |
| Graph (Yes/No) | Yes | Yes/No |
Sample Output
No graph
netapp.global.status
Metric Details
| Applicable for | Device |
| SNMP OID | 1.3.6.1.4.1.789.1.2.2.4.0, 1.3.6.1.4.1.789.1.2.2.25.0 |
| Expression | miscGlobalStatus |
| Description | Provides the overall status of the appliance. The algorithm to determine the value uses both hardware status and volume status. [OID: 1.3.6.1.4.1.789.1.2.2.4.0, 1.3.6.1.4.1.789.1.2.2.25.0]. |
| Category | SNMP monitors |
| Collector Type | Gateway |
| Monitor Name | NetApp Global Status |
| Unit |
Possible Inputs
| Metric | Input Value | Range of Values |
|---|---|---|
| Frequency | 5 | 1 – 1440 (mins) |
| Filter | ||
| Warning Operator | IN_LIST | Ends with, ==, !=, >=, <=, >, <, In Range, Out of range, Equals, Not equals, Equals Ignore Case, Not Equals Ignore Case, Contains, Not contains, Regex match, Regex no match, In string list, Not in string list, In List, Not in list, Starts with |
| Warning Threshold | 1,2,4 | [{"1":"Other"},{"2":"Unknown"},{"3":"Ok"},{"4":"nonCritical"},{"5":"Critical"},{"6":"nonRecoverable"}] |
| Warning Repeat Count | 1 | 1-12 |
| Critical Operator | IN_LIST | Ends with, ==, !=, >=, <=, >, <, In Range, Out of range, Equals, Not equals, Equals Ignore Case, Not Equals Ignore Case, Contains, Not contains, Regex match, Regex no match, In string list, Not in string list, In List, Not in list, Starts with |
| Critical Threshold | 5,6 | [{"1":"Other"},{"2":"Unknown"},{"3":"Ok"},{"4":"nonCritical"},{"5":"Critical"},{"6":"nonRecoverable"}] |
| Critical Repeat Count | 1 | 1-12 |
| Alert | Yes | Yes/No |
| Graph (Yes/No) | Yes | Yes/No |
Sample Output
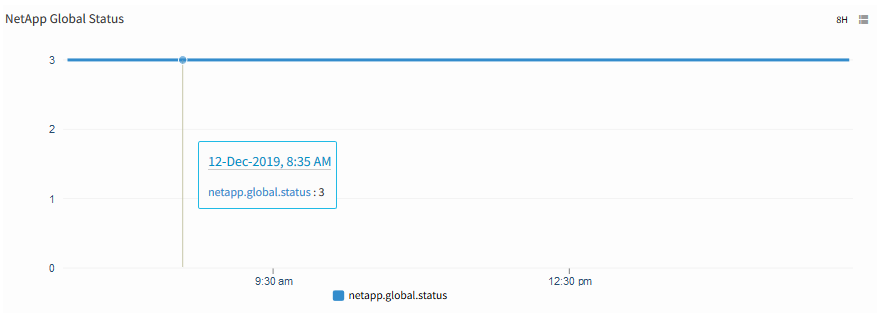
NetApp Global Status
netapp.failed.disk
Metric Details
| Applicable for | Device |
| SNMP OID | 1.3.6.1.4.1.789.1.6.4.7.0, 1.3.6.1.4.1.789.1.6.4.10.0 |
| Expression | diskFailedCount |
| Description | Provides the details on the number of disks which are currently broken or failed [OID: 1.3.6.1.4.1.789.1.6.4.7.0]. |
| Category | SNMP monitors |
| Collector Type | Gateway |
| Monitor Name | NetApp Hardware Monitors |
| Unit |
Possible Inputs
| Metric | Input Value | Range of Values |
|---|---|---|
| Frequency | 5 | 1 – 1440 (mins) |
| Filter | ||
| Warning Operator | ||
| Warning Threshold | ||
| Warning Repeat Count | ||
| Critical Operator | GREATER_THAN_EQUAL | Ends with, ==, !=, >=, <=, >, <, In Range, Out of range, Equals, Not equals, Equals Ignore Case, Not Equals Ignore Case, Contains, Not contains, Regex match, Regex no match, In string list, Not in string list, In List, Not in list, Starts with |
| Critical Threshold | 1 | |
| Critical Repeat Count | 1 | 1-12 |
| Alert | Yes | Yes/No |
| Graph (Yes/No) | Yes | Yes/No |
Sample Output
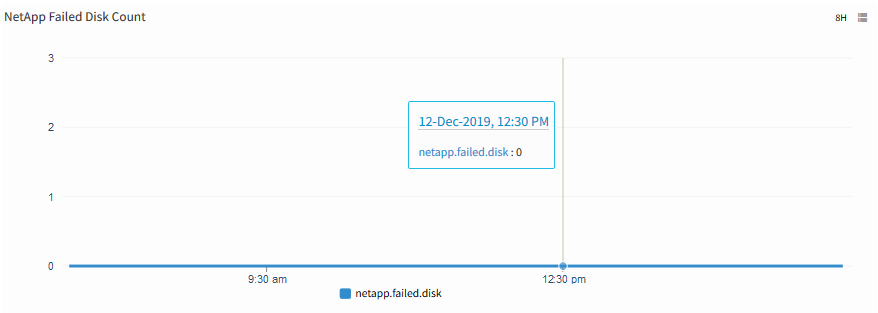
NetApp Failed Disk Count
netapp.failed.fan
Metric Details
| Applicable for | Device |
| SNMP OID | 1.3.6.1.4.1.789.1.2.4.2.0, 1.3.6.1.4.1.789.1.2.4.3.0 |
| Expression | envFailedFanCount |
| Description | Provides the count of the number of chassis fans which are not operating within the recommended RPM range. [OID: 1.3.6.1.4.1.789.1.2.4.2.0, 1.3.6.1.4.1.789.1.2.4.3.0]. |
| Category | SNMP monitors |
| Collector Type | Gateway |
| Monitor Name | NetApp Hardware Monitors |
| Unit |
Possible Inputs
| Metric | Input Value | Range of Values |
|---|---|---|
| Frequency | 5 | 1 – 1440 (mins) |
| Filter | ||
| Warning Operator | ||
| Warning Threshold | ||
| Warning Repeat Count | ||
| Critical Operator | GREATER_THAN_EQUAL | Ends with, ==, !=, >=, <=, >, <, In Range, Out of range, Equals, Not equals, Equals Ignore Case, Not Equals Ignore Case, Contains, Not contains, Regex match, Regex no match, In string list, Not in string list, In List, Not in list, Starts with |
| Critical Threshold | 1 | |
| Critical Repeat Count | 1 | 1-12 |
| Alert | Yes | Yes/No |
| Graph (Yes/No) | Yes | Yes/No |
Sample Output
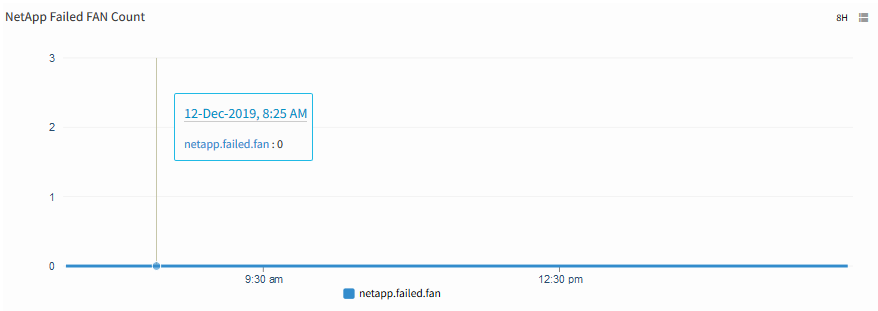
NetApp Failed Fan Count
netapp.failed.powersupply
Metric Details
| Applicable for | Device |
| SNMP OID | 1.3.6.1.4.1.789.1.2.4.4.0, 1.3.6.1.4.1.789.1.2.4.5.0 |
| Expression | envFailedPowerSupplyCount |
| Description | Provides the count of the number of power supplies which are in degraded mode. [OID: 1.3.6.1.4.1.789.1.2.4.4.0, 1.3.6.1.4.1.789.1.2.4.5.0] |
| Category | SNMP monitors |
| Collector Type | Gateway |
| Monitor Name | NetApp Hardware Monitors |
| Unit |
Possible Inputs
| Metric | Input Value | Range of Values |
|---|---|---|
| Frequency | 5 | 1 – 1440 (mins) |
| Filter | ||
| Warning Operator | ||
| Warning Threshold | ||
| Warning Repeat Count | ||
| Critical Operator | GREATER_THAN_EQUAL | Ends with, ==, !=, >=, <=, >, <, In Range, Out of range, Equals, Not equals, Equals Ignore Case, Not Equals Ignore Case, Contains, Not contains, Regex match, Regex no match, In string list, Not in string list, In List, Not in list, Starts with |
| Critical Threshold | 1 | |
| Critical Repeat Count | 1 | 1-12 |
| Alert | Yes | Yes/No |
| Graph (Yes/No) | Yes | Yes/No |
Sample Output
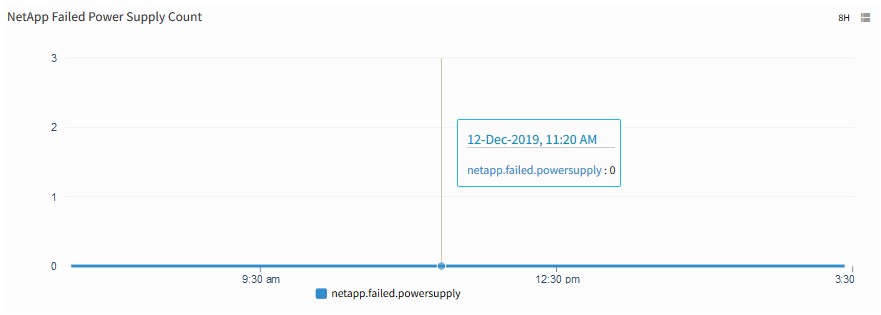
NetApp Failed Power Supply Count
netapp.nvram.battery.status
Metric Details
| Applicable for | Device |
| SNMP OID | 1.3.6.1.4.1.789.1.2.5.1.0 |
| Expression | NULL |
| Description | Provides the current status of the NVRAM battery [OID: 1.3.6.1.4.1.789.1.2.5.1.0]. |
| Category | SNMP monitors |
| Collector Type | Gateway |
| Monitor Name | NetApp Hardware Monitors |
| Unit |
Possible Inputs
| Metric | Input Value | Range of Values |
|---|---|---|
| Frequency | 5 | 1 – 1440 (mins) |
| Filter | ||
| Warning Operator | ||
| Warning Threshold | ||
| Warning Repeat Count | ||
| Critical Operator | NOT_IN_LIST | Ends with, ==, !=, >=, <=, >, <, In Range, Out of range, Equals, Not equals, Equals Ignore Case, Not Equals Ignore Case, Contains, Not contains, Regex match, Regex no match, In string list, Not in string list, In List, Not in list, Starts with |
| Critical Threshold | 1,4,9 | [{"1":"Ok"},{"2":"PartiallyDischarged"},{"3":"FullyDischarged"},{"4":"NotPresent"},{"5":"NearEndOfLife"},{"6":"AtEndOfLife"},{"7":"Unknown"},{"8":"OverCharged"},{"9":"FullyCharged"}] |
| Critical Repeat Count | 1 | 1-12 |
| Alert | Yes | Yes/No |
| Graph (Yes/No) | Yes | Yes/No |
Sample Output
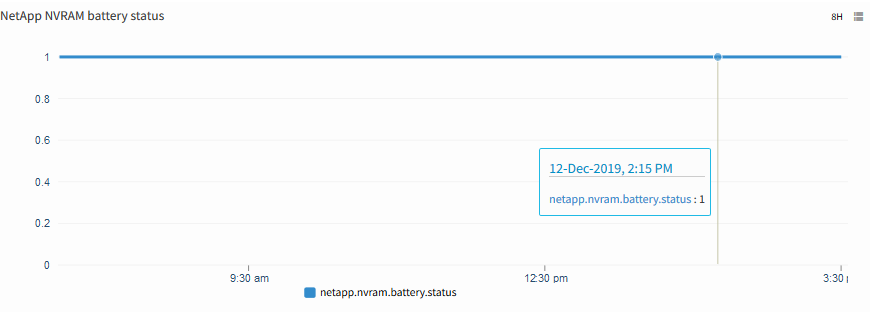
NetApp NVRAM Battery Status
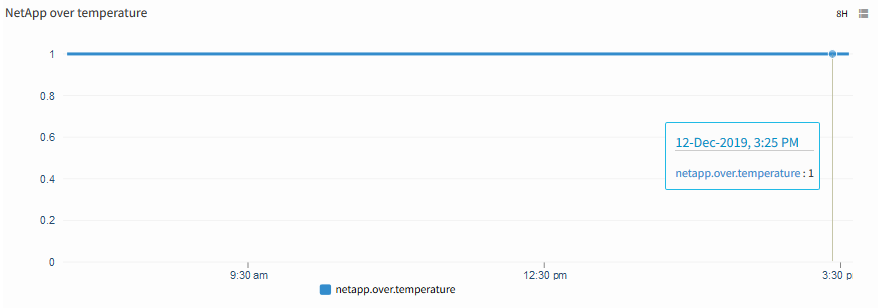
netapp.over.temperature
Metric Details
| Applicable for | Device |
| SNMP OID | 1.3.6.1.4.1.789.1.2.4.1.0 |
| Expression | NULL |
| Description | Provides an indication of whether the hardware is currently operating outside of its recommended temperature range. The hardware will shutdown if the temperature exceeds critical thresholds. [OID: 1.3.6.1.4.1.789.1.2.4.1.0]. |
| Category | SNMP monitors |
| Collector Type | Gateway |
| Monitor Name | NetApp Hardware Monitors |
| Unit |
Possible Inputs
| Metric | Input Value | Range of Values |
|---|---|---|
| Frequency | 5 | 1 – 1440 (mins) |
| Filter | ||
| Warning Operator | ||
| Warning Threshold | ||
| Warning Repeat Count | ||
| Critical Operator | EQUAL | Ends with, ==, !=, >=, <=, >, <, In Range, Out of range, Equals, Not equals, Equals Ignore Case, Not Equals Ignore Case, Contains, Not contains, Regex match, Regex no match, In string list, Not in string list, In List, Not in list, Starts with |
| Critical Threshold | 2 | [{"1":"No"},{"2":"Yes"}] |
| Critical Repeat Count | 1 | 1-12 |
| Alert | Yes | Yes/No |
| Graph (Yes/No) | Yes | Yes/No |
Sample Output