Description
Template to monitor Palo Alto M-100 appliance. It monitors the parameters like the number of Active Sessions (TCP, UDP and ICMP), Session Utilization Percentage, Maximum Sessions, Fan and Temperature Status, Log Collector Log Rate and Log Collector Disk Usage, vSys Session Utilization, Global Protect Gateway Active Tunnels, GlobalProtect Gateway utilization percentage, Panorama connection status and SSL proxy Session utilization percentage.
Prerequisites
SNMP should be enabled in end device and device should support PAN-COMMON-MIB, ENTITY-SENSOR-MIB and SNMP credentials should be attached against the device in portal.
How to Apply: This template is All instance selection based. It will not ask user to select any instance(s) while assigning it to a device.
Metric Parameters
| Parameter | Description |
|---|---|
| Frequency | Warning Threshold | If the metric value satisfies the condition defined along with Warning Threshold value, then a notification is sent to the user. |
| Critical Threshold | If the metric value satisfies the condition defined along with Critical Threshold value, then a notification is sent to the user. |
| Alert | The alert value can be set to either Yes or No. If it is Yes, then an alert message is sent to the user. |
Metrics
paloalto.global.protect.gateway.active.tunnels
Metric Details
| Applicable for | Device |
| SNMP OID | 1.3.6.1.4.1.25461.2.1.2.5.1.3.0 |
| Expression | NULL |
| Description | Provides the number of active tunnels. [OID: 1.3.6.1.4.1.25461.2.1.2.5.1.3] |
| Category | SNMP monitors |
| Collector Type | Gateway |
| Monitor Name | PA-FW - Global Protect Gateway Active tunnels |
| Unit | None |
Possible Inputs
| Metric | Input Value | Range of Values |
|---|---|---|
| Frequency | 15 | 1 – 1440 (mins) |
| Filter | ||
| Warning Operator | ||
| Warning Threshold | ||
| Warning Repeat Count | ||
| Critical Operator | ||
| Critical Threshold | ||
| Critical Repeat Count | ||
| Alert | No | Yes/No |
| Graph (Yes/No) | Yes | Yes/No |
Sample Output
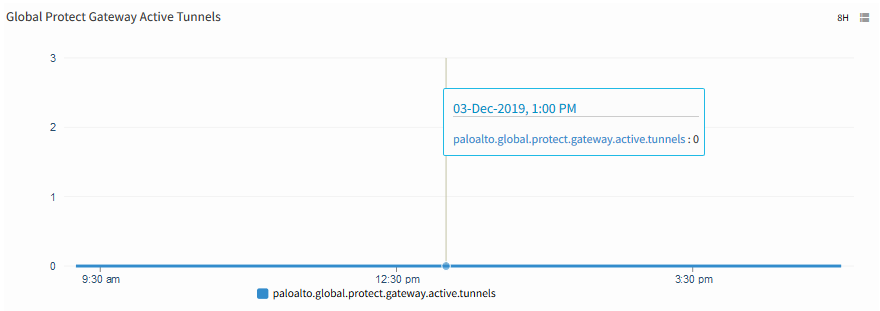
Global Protect Gateway Active Tunnels
paloalto.connection.status.to.panorama.server
Metric Details
| Applicable for | Device |
| SNMP OID | 1.3.6.1.4.1.25461.2.1.2.4.1.0 |
| Expression | NULL |
| Description | Provides the current connection status to Panorama Server. Possible status values are connected and not-connected. [OID: 1.3.6.1.4.1.25461.2.1.2.4.1.0] |
| Category | SNMP monitors |
| Collector Type | Gateway |
| Monitor Name | PA-FW - Panorama Server Connection Status |
| Unit |
Possible Inputs
| Metric | Input Value | Range of Values |
|---|---|---|
| Frequency | 15 | 1 – 1440 (mins) |
| Filter | ||
| Warning Operator | ||
| Warning Threshold | ||
| Warning Repeat Count | ||
| Critical Operator | EQUALS_IGNORE_CASE | Ends with, ==, !=, >=, <=, >, <, In Range, Out of range, Equals, Not equals, Equals Ignore Case, Not Equals Ignore Case, Contains, Not contains, Regex match, Regex no match, In string list, Not in string list, In List, Not in list, Starts with |
| Critical Threshold | not-Connected | 0..255 |
| Critical Repeat Count | 1 | 1-12 |
| Alert | Yes | Yes/No |
| Graph (Yes/No) | No | Yes/No |
Sample Output
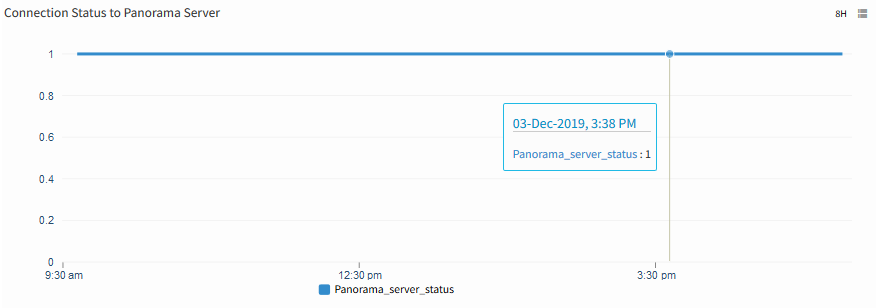
Connection Status to Panorama Server
paloalto.connection.status.to.panorama2.server
Metric Details
| Applicable for | Device |
| SNMP OID | 1.3.6.1.4.1.25461.2.1.2.4.2.0 |
| Expression | NULL |
| Description | Provides the current connection status to Panorama 2 Server. Possible status values are connected and not-connected. [OID: 1.3.6.1.4.1.25461.2.1.2.4.2.0] |
| Category | SNMP monitors |
| Collector Type | Gateway |
| Monitor Name | PA-FW - Panorama Server Connection Status |
| Unit |
Possible Inputs
| Metric | Input Value | Range of Values |
|---|---|---|
| Frequency | 15 | 1 – 1440 (mins) |
| Filter | ||
| Warning Operator | ||
| Warning Threshold | ||
| Warning Repeat Count | ||
| Critical Operator | ||
| Critical Threshold | ||
| Critical Repeat Count | ||
| Alert | No | Yes/No |
| Graph (Yes/No) | No | Yes/No |
Sample Output
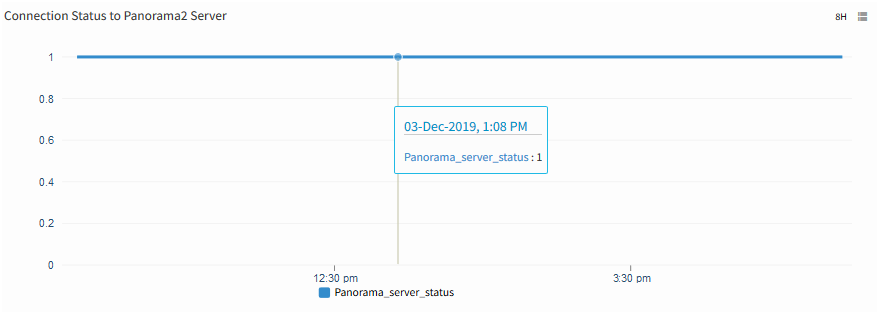
Connection Status to Panorama2 Server
paloalto.session.utilization
Metric Details
| Applicable for | Device |
| SNMP OID | 1.3.6.1.4.1.25461.2.1.2.3.1.0 |
| Expression | NULL |
| Description | Provides the session table utilization percentage. Values should be between 0 and 100. [OID: 1.3.6.1.4.1.25461.2.1.2.3.1] |
| Category | SNMP monitors |
| Collector Type | Gateway |
| Monitor Name | PA-FW - Session Utilization |
| Unit | % |
Possible Inputs
| Metric | Input Value | Range of Values |
|---|---|---|
| Frequency | 15 | 1 – 1440 (mins) |
| Filter | ||
| Warning Operator | GREATER_THAN_EQUAL | Ends with, ==, !=, >=, <=, >, <, In Range, Out of range, Equals, Not equals, Equals Ignore Case, Not Equals Ignore Case, Contains, Not contains, Regex match, Regex no match, In string list, Not in string list, In List, Not in list, Starts with |
| Warning Threshold | 80 | 0-100 |
| Warning Repeat Count | 2 | 1-12 |
| Critical Operator | GREATER_THAN_EQUAL | Ends with, ==, !=, >=, <=, >, <, In Range, Out of range, Equals, Not equals, Equals Ignore Case, Not Equals Ignore Case, Contains, Not contains, Regex match, Regex no match, In string list, Not in string list, In List, Not in list, Starts with |
| Critical Threshold | 90 | 0-100 |
| Critical Repeat Count | 2 | 1-12 |
| Alert | Yes | Yes/No |
| Graph (Yes/No) | Yes | Yes/No |
Sample Output
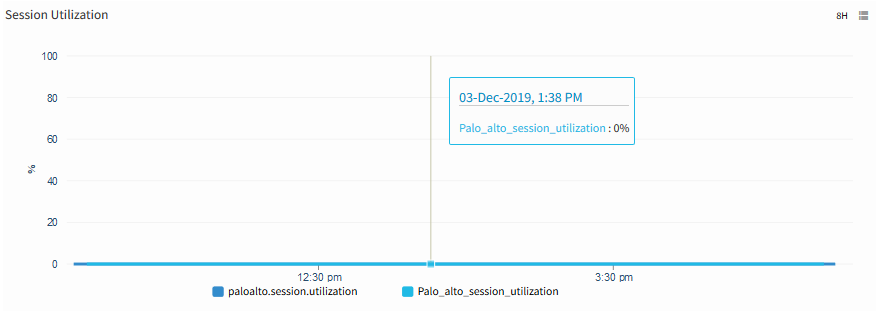
Session Utilization
paloalto.session.active.tcp
Metric Details
| Applicable for | Device |
| SNMP OID | 1.3.6.1.4.1.25461.2.1.2.3.4.0 |
| Expression | NULL |
| Description | Total number of active TCP sessions. [OID: 1.3.6.1.4.1.25461.2.1.2.3.4.0] |
| Category | SNMP monitors |
| Collector Type | Gateway |
| Monitor Name | PA-FW - Session Utilization |
| Unit |
Possible Inputs
| Metric | Input Value | Range of Values |
|---|---|---|
| Frequency | 15 | 1 – 1440 (mins) |
| Filter | ||
| Warning Operator | ||
| Warning Threshold | ||
| Warning Repeat Count | ||
| Critical Operator | ||
| Critical Threshold | ||
| Critical Repeat Count | ||
| Alert | No | Yes/No |
| Graph (Yes/No) | Yes | Yes/No |
Sample Output
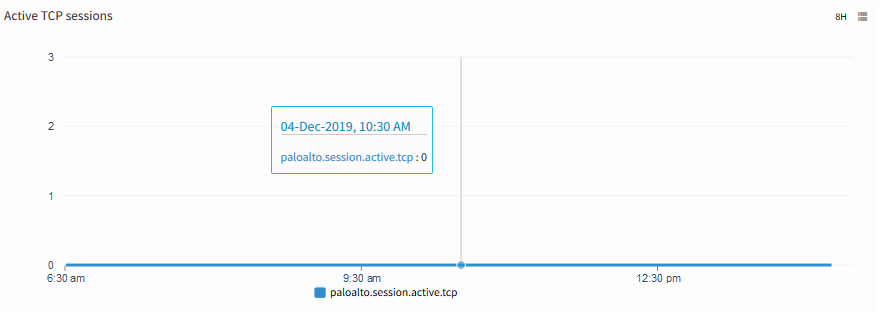
Active TCP Sessions
paloalto.session.active.udp
Metric Details
| Applicable for | Device |
| SNMP OID | 1.3.6.1.4.1.25461.2.1.2.3.5.0 |
| Expression | NULL |
| Description | Total number of active UDP sessions. [OID: 1.3.6.1.4.1.25461.2.1.2.3.5.0] |
| Category | SNMP monitors |
| Collector Type | Gateway |
| Monitor Name | PA-FW - Session Utilization |
| Unit |
Possible Inputs
| Metric | Input Value | Range of Values |
|---|---|---|
| Frequency | 15 | 1 – 1440 (mins) |
| Filter | ||
| Warning Operator | ||
| Warning Threshold | ||
| Warning Repeat Count | ||
| Critical Operator | ||
| Critical Threshold | ||
| Critical Repeat Count | ||
| Alert | No | Yes/No |
| Graph (Yes/No) | Yes | Yes/No |
Sample Output
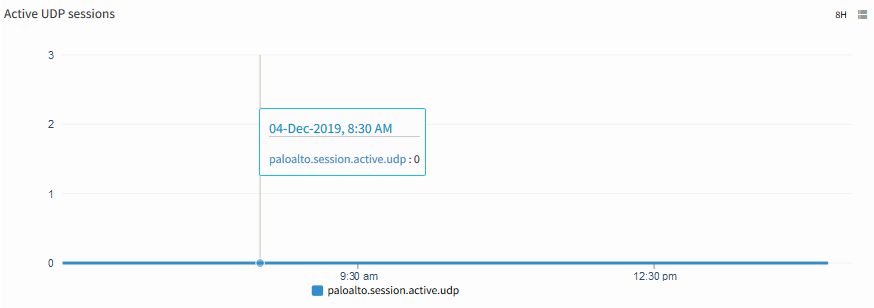
Active UDP Sessions
paloalto.session.active.icmp
Metric Details
| Applicable for | Device |
| SNMP OID | 1.3.6.1.4.1.25461.2.1.2.3.6.0 |
| Expression | NULL |
| Description | Total number of active ICMP sessions. [OID: 1.3.6.1.4.1.25461.2.1.2.3.6.0] |
| Category | SNMP monitors |
| Collector Type | Gateway |
| Monitor Name | PA-FW - Session Utilization |
| Unit |
Possible Inputs
| Metric | Input Value | Range of Values |
|---|---|---|
| Frequency | 15 | 1 – 1440 (mins) |
| Filter | ||
| Warning Operator | ||
| Warning Threshold | ||
| Warning Repeat Count | ||
| Critical Operator | ||
| Critical Threshold | ||
| Critical Repeat Count | ||
| Alert | No | Yes/No |
| Graph (Yes/No) | Yes | Yes/No |
Sample Output
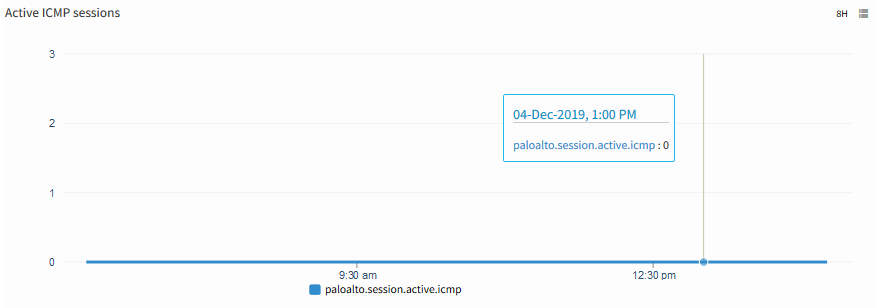
Active ICMP Sessions
paloalto.session.active
Metric Details
| Applicable for | Device |
| SNMP OID | 1.3.6.1.4.1.25461.2.1.2.3.3.0 |
| Expression | NULL |
| Description | Total number of active sessions (including tcp, udp and icmp sessions). [OID: 1.3.6.1.4.1.25461.2.1.2.3.3.0] |
| Category | SNMP monitors |
| Collector Type | Gateway |
| Monitor Name | PA-FW - Session Utilization |
| Unit |
Possible Inputs
| Metric | Input Value | Range of Values |
|---|---|---|
| Frequency | 15 | 1 – 1440 (mins) |
| Filter | ||
| Warning Operator | ||
| Warning Threshold | ||
| Warning Repeat Count | ||
| Critical Operator | ||
| Critical Threshold | ||
| Critical Repeat Count | ||
| Alert | No | Yes/No |
| Graph (Yes/No) | Yes | Yes/No |
Sample Output
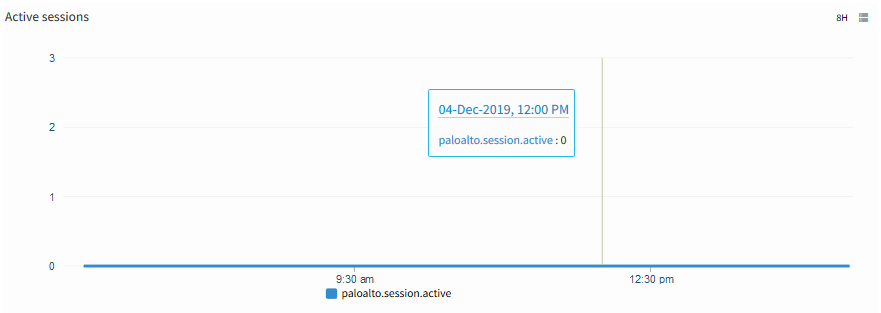
Active Sessions
paloalto.ssl.proxy.utilization
Metric Details
| Applicable for | Device |
| SNMP OID | 1.3.6.1.4.1.25461.2.1.2.3.8.0, 1.3.6.1.4.1.25461.2.1.2.3.7.0 |
| Expression | panSessionSsslProxyUtilization |
| Description | Provides the SSL proxy Session utilization percentage. Values should be between 0 and 100. [OID: 1.3.6.1.4.1.25461.2.1.2.3.8] |
| Category | SNMP monitors |
| Collector Type | Gateway |
| Monitor Name | PA-FW - Session Utilization |
| Unit | % |
Possible Inputs
| Metric | Input Value | Range of Values |
|---|---|---|
| Frequency | 15 | 1 – 1440 (mins) |
| Filter | ||
| Warning Operator | GREATER_THAN_EQUAL | Ends with, ==, !=, >=, <=, >, <, In Range, Out of range, Equals, Not equals, Equals Ignore Case, Not Equals Ignore Case, Contains, Not contains, Regex match, Regex no match, In string list, Not in string list, In List, Not in list, Starts with |
| Warning Threshold | 80 | 0-100 |
| Warning Repeat Count | 2 | 1-12 |
| Critical Operator | GREATER_THAN_EQUAL | Ends with, ==, !=, >=, <=, >, <, In Range, Out of range, Equals, Not equals, Equals Ignore Case, Not Equals Ignore Case, Contains, Not contains, Regex match, Regex no match, In string list, Not in string list, In List, Not in list, Starts with |
| Critical Threshold | 90 | 0-100 |
| Critical Repeat Count | 2 | 1-12 |
| Alert | Yes | Yes/No |
| Graph (Yes/No) | Yes | Yes/No |
Sample Output
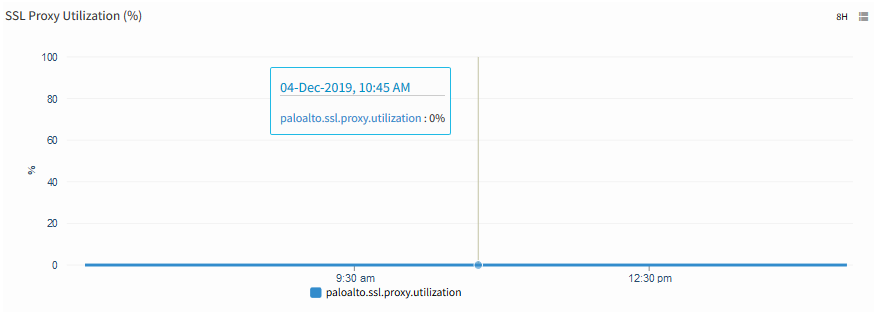
SSL Proxy Utilization
paloalto.session.max
Metric Details
| Applicable for | Device |
| SNMP OID | 1.3.6.1.4.1.25461.2.1.2.3.2.0 |
| Expression | NULL |
| Description | Total number of sessions supported. [1.3.6.1.4.1.25461.2.1.2.3.2.0] |
| Category | SNMP monitors |
| Collector Type | Gateway |
| Monitor Name | PA-FW - Session Utilization |
| Unit |
Possible Inputs
| Metric | Input Value | Range of Values |
|---|---|---|
| Frequency | 15 | 1 – 1440 (mins) |
| Filter | ||
| Warning Operator | ||
| Warning Threshold | ||
| Warning Repeat Count | ||
| Critical Operator | ||
| Critical Threshold | ||
| Critical Repeat Count | ||
| Alert | No | Yes/No |
| Graph (Yes/No) | Yes | Yes/No |
Sample Output
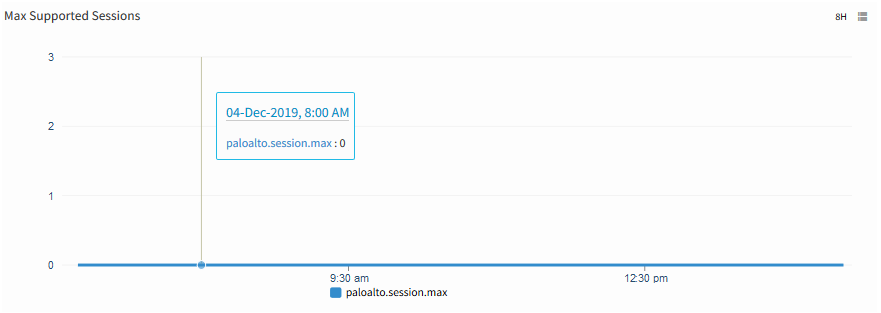
Max Supported Sessions
paloalto.vsys.session.utilization
Metric Details
| Applicable for | Device |
| SNMP OID | 1.3.6.1.4.1.25461.2.1.2.3.9.1.3, 1.3.6.1.4.1.25461.2.1.2.3.9.1.4 |
| Expression | panVsysSessionUtilizationPct |
| Description | Vsys utilization percentage, if session limit is configured. If session limit is not configured, this value is '0' |
| Category | SNMP monitors |
| Collector Type | Gateway |
| Monitor Name | PA-FW - Vsys Session Utilization |
| Unit | % |
Possible Inputs
| Metric | Input Value | Range of Values |
|---|---|---|
| Frequency | 15 | 1 – 1440 (mins) |
| Filter | NULL | Not Applicable |
| Warning Operator | GREATER_THAN_EQUAL | Ends with, ==, !=, >=, <=, >, <, In Range, Out of range, Equals, Not equals, Equals Ignore Case, Not Equals Ignore Case, Contains, Not contains, Regex match, Regex no match, In string list, Not in string list, In List, Not in list, Starts with |
| Warning Threshold | 80 | 0-100 |
| Warning Repeat Count | 2 | 1-12 |
| Critical Operator | GREATER_THAN_EQUAL | Ends with, ==, !=, >=, <=, >, <, In Range, Out of range, Equals, Not equals, Equals Ignore Case, Not Equals Ignore Case, Contains, Not contains, Regex match, Regex no match, In string list, Not in string list, In List, Not in list, Starts with |
| Critical Threshold | 90 | 0-100 |
| Critical Repeat Count | 2 | 1-12 |
| Alert | Yes | Yes/No |
| Graph (Yes/No) | Yes | Yes/No |
Sample Output
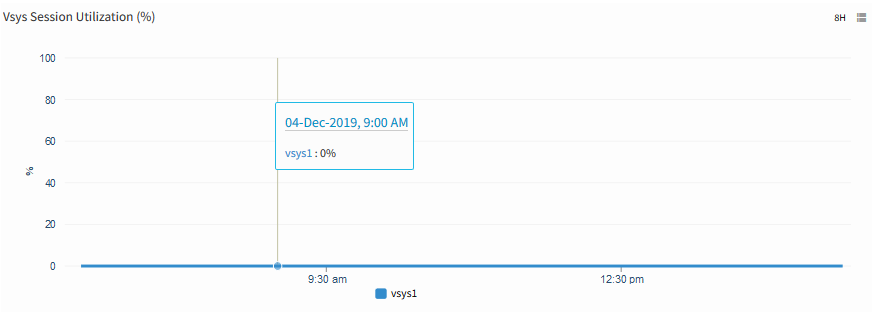
Vsys Session Utilization
paloalto.global.protect.gateway.utilization
Metric Details
| Applicable for | Device |
| SNMP OID | 1.3.6.1.4.1.25461.2.1.2.5.1.1.0 |
| Expression | NULL |
| Description | GlobalProtect Gateway utilization percentage |
| Category | SNMP monitors |
| Collector Type | Gateway |
| Monitor Name | PA-FW - Global Protect Gateway Utilization |
| Unit | % |
Possible Inputs
| Metric | Input Value | Range of Values |
|---|---|---|
| Frequency | 15 | 1 – 1440 (mins) |
| Filter | ||
| Warning Operator | GREATER_THAN_EQUAL | Ends with, ==, !=, >=, <=, >, <, In Range, Out of range, Equals, Not equals, Equals Ignore Case, Not Equals Ignore Case, Contains, Not contains, Regex match, Regex no match, In string list, Not in string list, In List, Not in list, Starts with |
| Warning Threshold | 80 | 0-100 |
| Warning Repeat Count | 1 | 1-12 |
| Critical Operator | GREATER_THAN_EQUAL | Ends with, ==, !=, >=, <=, >, <, In Range, Out of range, Equals, Not equals, Equals Ignore Case, Not Equals Ignore Case, Contains, Not contains, Regex match, Regex no match, In string list, Not in string list, In List, Not in list, Starts with |
| Critical Threshold | 90 | 0-100 |
| Critical Repeat Count | 1 | 1-12 |
| Alert | Yes | Yes/No |
| Graph (Yes/No) | Yes | Yes/No |
Sample Output
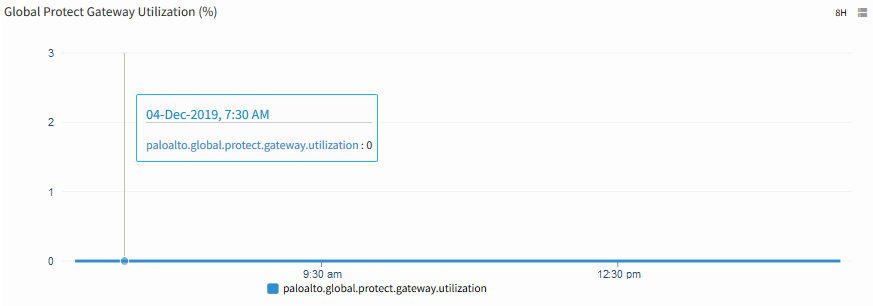
Global Protect Gateway Utilization
paloalto.lc.disk.usage
Metric Details
| Applicable for | Device |
| SNMP OID | 1.3.6.1.4.1.25461.2.1.2.6.1.3.1.2 |
| Expression | NULL |
| Description | The Log disk usage on the Log Collector. [OID: 1.3.6.1.4.1.25461.2.1.2.6.1.3.1.2] |
| Category | SNMP monitors |
| Collector Type | Gateway |
| Monitor Name | PA-FW - Log Collector Disk Usage |
| Unit | MB |
Possible Inputs
| Metric | Input Value | Range of Values |
|---|---|---|
| Frequency | 15 | 1 – 1440 (mins) |
| Filter | NULL | Not Applicable |
| Warning Operator | ||
| Warning Threshold | ||
| Warning Repeat Count | ||
| Critical Operator | ||
| Critical Threshold | ||
| Critical Repeat Count | ||
| Alert | No | Yes/No |
| Graph (Yes/No) | Yes | Yes/No |
Sample Output
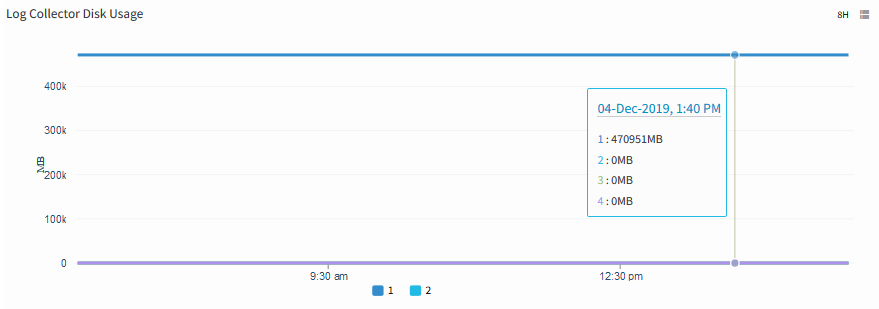
Log Collector Disk Usage
paloalto.lc.log.rate
Metric Details
| Applicable for | Device |
| SNMP OID | 1.3.6.1.4.1.25461.2.1.2.6.1.1.0 |
| Expression | NULL |
| Description | Represents the write rate in logs/s on the Log Collection. [OID: 1.3.6.1.4.1.25461.2.1.2.6.1.1.0] |
| Category | SNMP monitors |
| Collector Type | Gateway |
| Monitor Name | PA-FW - Log Collector Log Rate |
| Unit | psec |
Possible Inputs
| Metric | Input Value | Range of Values |
|---|---|---|
| Frequency | 15 | 1 – 1440 (mins) |
| Filter | ||
| Warning Operator | ||
| Warning Threshold | ||
| Warning Repeat Count | ||
| Critical Operator | ||
| Critical Threshold | ||
| Critical Repeat Count | ||
| Alert | No | Yes/No |
| Graph (Yes/No) | Yes | Yes/No |
Sample Output
No graph
Note: Few metrics (panGPGatewayUtilization, panGPGWUtilizationActiveTunnels, panVsysSessionUtilizationPct) only work in PAN OS 6.0.
https://live.paloaltonetworks.com/t5/tkb/articleprintpage/tkb-id/Management-TKB/article-id/1596