Description
Monitors the disk statistics like disk read accesses, writes access, total read write accesses, read bytes, write bytes, total bytes and also monitors system statistics like active connections, current running processes count.
Prerequisites
SNMP should be enabled in end device and device should support UCD-DISKIO-MIB, TCP-MIB, HOST-RESOURCES-MIB and SNMP credentials should be attached against the device in portal.
How to Apply: This template is All instance selection based and Automatic select instance based. It will not ask user to select any instance (s) while assigning it to a device.
Metric Parameters
| Parameter | Description |
|---|---|
| Frequency | Warning Threshold | If the metric value satisfies the condition defined along with Warning Threshold value, then a notification is sent to the user. |
| Critical Threshold | If the metric value satisfies the condition defined along with Critical Threshold value, then a notification is sent to the user. |
| Alert | The alert value can be set to either Yes or No. If it is Yes, then an alert message is sent to the user. |
Metrics
system.uptime
Metric Details
| Applicable for | Device |
| SNMP OID | 1.3.6.1.6.3.10.2.1.3.0 |
| Expression | NULL |
| Description | The number of seconds since the value of the snmpEngineBoots object last changed. [OID : 1.3.6.1.6.3.10.2.1.3.0] |
| Category | SNMP monitors |
| Collector Type | Gateway |
| Monitor Name | SNMP Engine Uptime |
| Unit | s |
Possible Inputs
| Metric | Input Value | Range of Values |
|---|---|---|
| Frequency | 10 | 1 – 1440 (mins) |
| Filter | ||
| Warning Operator | ||
| Warning Threshold | ||
| Warning Repeat Count | ||
| Critical Operator | LESS_THAN_EQUAL | Ends with, ==, !=, >=, <=, >, <, In Range, Out of range, Equals, Not equals, Equals Ignore Case, Not Equals Ignore Case, Contains, Not contains, Regex match, Regex no match, In string list, Not in string list, In List, Not in list, Starts with |
| Critical Threshold | 1800 | 0 - 4294967295 |
| Critical Repeat Count | 1 | 1-12 |
| Alert | Yes | Yes/No |
| Graph (Yes/No) | Yes | Yes/No |
Sample Output
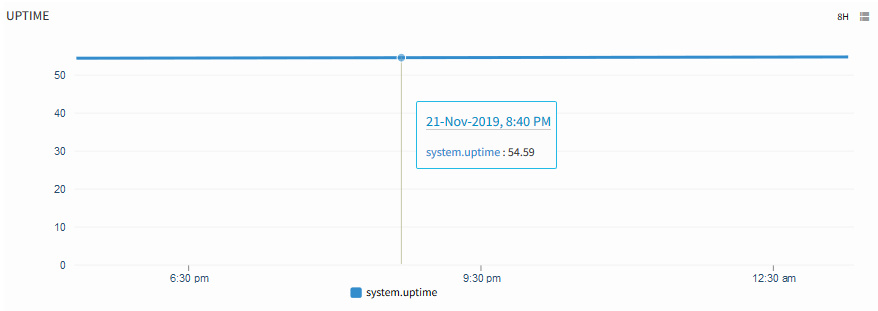
Uptime
system.unix.memory
Metric Details
| Applicable for | Device |
| SNMP OID | 1.3.6.1.4.1.2021.4.6.0, 1.3.6.1.4.1.2021.4.5.0, 1.3.6.1.4.1.2021.4.15.0 |
| Expression | ((memTotalReal - (memAvailReal + memCached))/memTotalReal)*100 |
| Description | Monitors the Unix Real Memory utilization. [OIDs: 1.3.6.1.4.1.2021.4.6.0, 1.3.6.1.4.1.2021.4.5.0, 1.3.6.1.4.1.2021.4.15.0] |
| Category | SNMP monitors |
| Collector Type | Gateway |
| Monitor Name | Memory Utilization - UCD-SNMP-MIB |
| Unit | % |
Possible Inputs
| Metric | Input Value | Range of Values |
|---|---|---|
| Frequency | 10 | 1 – 1440 (mins) |
| Filter | ||
| Warning Operator | GREATER_THAN_EQUAL | Ends with, ==, !=, >=, <=, >, <, In Range, Out of range, Equals, Not equals, Equals Ignore Case, Not Equals Ignore Case, Contains, Not contains, Regex match, Regex no match, In string list, Not in string list, In List, Not in list, Starts with |
| Warning Threshold | 75 | 0-100 |
| Warning Repeat Count | 2 | 1-12 |
| Critical Operator | GREATER_THAN_EQUAL | Ends with, ==, !=, >=, <=, >, <, In Range, Out of range, Equals, Not equals, Equals Ignore Case, Not Equals Ignore Case, Contains, Not contains, Regex match, Regex no match, In string list, Not in string list, In List, Not in list, Starts with |
| Critical Threshold | 85 | 0-100 |
| Critical Repeat Count | 2 | 1-12 |
| Alert | Yes | Yes/No |
| Graph (Yes/No) | Yes | Yes/No |
Sample Output
No graph
system.unix.memory.swap
Metric Details
| Applicable for | Device |
| SNMP OID | 1.3.6.1.4.1.2021.4.3.0, 1.3.6.1.4.1.2021.4.4.0 |
| Expression | if(memTotalSwap == 0,0,((memTotalSwap-memAvailSwap)/memTotalSwap)*100) |
| Description | Monitors the Unix Swap Memory Utilization. [OIDs: 1.3.6.1.4.1.2021.4.3.0, 1.3.6.1.4.1.2021.4.4.0] |
| Category | SNMP monitors |
| Collector Type | Gateway |
| Monitor Name | Memory Utilization - UCD-SNMP-MIB |
| Unit | % |
Possible Inputs
| Metric | Input Value | Range of Values |
|---|---|---|
| Frequency | 10 | 1 – 1440 (mins) |
| Filter | ||
| Warning Operator | GREATER_THAN_EQUAL | Ends with, ==, !=, >=, <=, >, <, In Range, Out of range, Equals, Not equals, Equals Ignore Case, Not Equals Ignore Case, Contains, Not contains, Regex match, Regex no match, In string list, Not in string list, In List, Not in list, Starts with |
| Warning Threshold | 65 | 0-100 |
| Warning Repeat Count | 2 | 1-12 |
| Critical Operator | GREATER_THAN_EQUAL | Ends with, ==, !=, >=, <=, >, <, In Range, Out of range, Equals, Not equals, Equals Ignore Case, Not Equals Ignore Case, Contains, Not contains, Regex match, Regex no match, In string list, Not in string list, In List, Not in list, Starts with |
| Critical Threshold | 75 | 0-100 |
| Critical Repeat Count | 2 | 1-12 |
| Alert | Yes | Yes/No |
| Graph (Yes/No) | Yes | Yes/No |
Sample Output
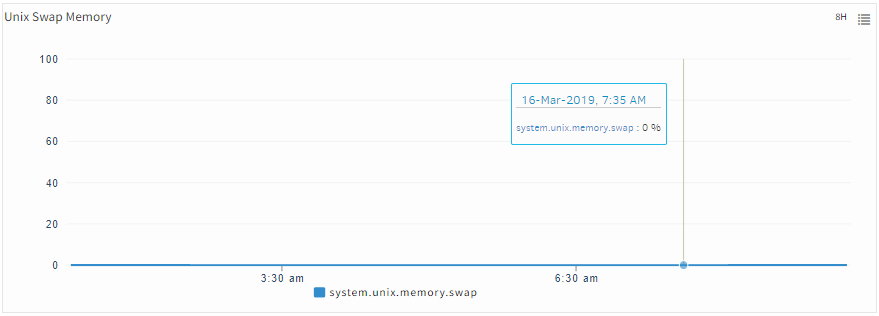
Unix Swap Memory
system.unix.memory.free
Metric Details
| Applicable for | Device |
| SNMP OID | 1.3.6.1.4.1.2021.4.14 |
| Expression | memCached + memBuffer+ memAvailReal |
| Description | Monitors the UNIX free memory. [OIDs: 1.3.6.1.4.1.2021.4.14, 1.3.6.1.4.1.2021.4.15, 1.3.6.1.4.1.2021.4.6] |
| Category | SNMP monitors |
| Collector Type | Gateway |
| Monitor Name | Memory Utilization - UCD-SNMP-MIB |
| Unit | KB |
Possible Inputs
| Metric | Input Value | Range of Values |
|---|---|---|
| Frequency | 10 | 1 – 1440 (mins) |
| Filter | ||
| Warning Operator | ||
| Warning Threshold | ||
| Warning Repeat Count | ||
| Critical Operator | ||
| Critical Threshold | ||
| Critical Repeat Count | ||
| Alert | No | Yes/No |
| Graph (Yes/No) | Yes | Yes/No |
Sample Output
No graph
system.unix.memory.used
Metric Details
| Applicable for | Device |
| SNMP OID | NULL |
| Expression | memTotalReal-(memCached + memBuffered + memAvailReal) |
| Description | Monitors the UNIX used memory. |
| Category | SNMP monitors |
| Collector Type | Gateway |
| Monitor Name | Memory Utilization - UCD-SNMP-MIB |
| Unit | KB |
Possible Inputs
| Metric | Input Value | Range of Values |
|---|---|---|
| Frequency | 10 | 1 – 1440 (mins) |
| Filter | ||
| Warning Operator | ||
| Warning Threshold | ||
| Warning Repeat Count | ||
| Critical Operator | ||
| Critical Threshold | ||
| Critical Repeat Count | ||
| Alert | No | Yes/No |
| Graph (Yes/No) | Yes | Yes/No |
Sample Output
No graph
system.unix.memory.swap.used
Metric Details
| Applicable for | Device |
| SNMP OID | NULL |
| Expression | memTotalSwap-memAvailSwap |
| Description | Monitors the amount of used swap memory. [OIDs: 1.3.6.1.4.1.2021.4.3.0, 1.3.6.1.4.1.2021.4.4.0] |
| Category | SNMP monitors |
| Collector Type | Gateway |
| Monitor Name | Memory Utilization - UCD-SNMP-MIB |
| Unit | KB |
Possible Inputs
| Metric | Input Value | Range of Values |
|---|---|---|
| Frequency | 10 | 1 – 1440 (mins) |
| Filter | ||
| Warning Operator | ||
| Warning Threshold | ||
| Warning Repeat Count | ||
| Critical Operator | ||
| Critical Threshold | ||
| Critical Repeat Count | ||
| Alert | No | Yes/No |
| Graph (Yes/No) | Yes | Yes/No |
Sample Output
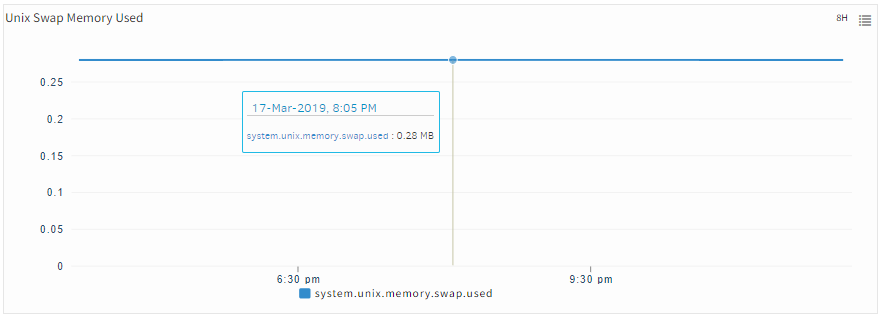
Unix Swap Memory Used
system.unix.memory.swap.total
Metric Details
| Applicable for | Device |
| SNMP OID | NULL |
| Expression | memTotalSwap |
| Description | Monitors the total amount of swap space configured for this host. [OID: 1.3.6.1.4.1.2021.4.3.0] |
| Category | SNMP monitors |
| Collector Type | Gateway |
| Monitor Name | Memory Utilization - UCD-SNMP-MIB |
| Unit | KB |
Possible Inputs
| Metric | Input Value | Range of Values |
|---|---|---|
| Frequency | 10 | 1 – 1440 (mins) |
| Filter | ||
| Warning Operator | ||
| Warning Threshold | ||
| Warning Repeat Count | ||
| Critical Operator | ||
| Critical Threshold | ||
| Critical Repeat Count | ||
| Alert | No | Yes/No |
| Graph (Yes/No) | Yes | Yes/No |
Sample Output
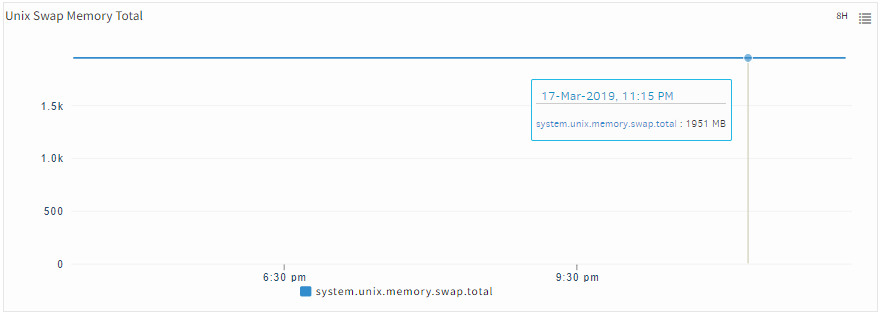
Unix Swap Memory Total
system.disk.util.percent
Metric Details
| Applicable for | Device |
| SNMP OID | 1.3.6.1.2.1.25.2.3.1.5, 1.3.6.1.2.1.25.2.3.1.6, 1.3.6.1.2.1.25.2.3.1.4 |
| Expression | (hrStorageUsed / hrStorageSize) * 100 |
| Description | Monitors the disk utilization. [OIDs: 1.3.6.1.2.1.25.2.3.1.4, 1.3.6.1.2.1.25.2.3.1.5, 1.3.6.1.2.1.25.2.3.1.6] |
| Category | SNMP monitors |
| Collector Type | Gateway |
| Monitor Name | Storage Utilization - HR-MIB |
| Unit | % |
Possible Inputs
| Metric | Input Value | Range of Values |
|---|---|---|
| Frequency | 10 | 1 – 1440 (mins) |
| Filter | hrStorageType Equals 1.3.6.1.2.1.25.2.1.4 | |
| Warning Operator | GREATER_THAN_EQUAL | Ends with, ==, !=, >=, <=, >, <, In Range, Out of range, Equals, Not equals, Equals Ignore Case, Not Equals Ignore Case, Contains, Not contains, Regex match, Regex no match, In string list, Not in string list, In List, Not in list, Starts with |
| Warning Threshold | 80 | 0-100 |
| Warning Repeat Count | 1 | 1-12 |
| Critical Operator | GREATER_THAN_EQUAL | Ends with, ==, !=, >=, <=, >, <, In Range, Out of range, Equals, Not equals, Equals Ignore Case, Not Equals Ignore Case, Contains, Not contains, Regex match, Regex no match, In string list, Not in string list, In List, Not in list, Starts with |
| Critical Threshold | 90 | 0-100 |
| Critical Repeat Count | 1 | 1-12 |
| Alert | Yes | Yes/No |
| Graph (Yes/No) | Yes | Yes/No |
Sample Output
No graph
system.unix.cpu.util.percent
Metric Details
| Applicable for | Device |
| SNMP OID | 1.3.6.1.4.1.2021.11.11.0 |
| Expression | 100 - ssCpuIdle |
| Description | CPU utilization is a key performance metric. It is the percentage of time the processor spends doing work (as opposed to being idle). It can be used to track CPU performance regressions or improvements. [OID: 1.3.6.1.4.1.2021.11.11.0] |
| Category | SNMP monitors |
| Collector Type | Gateway |
| Monitor Name | CPU Utilization - UCD-SNMP-MIB |
| Unit | % |
Possible Inputs
| Metric | Input Value | Range of Values |
|---|---|---|
| Frequency | 10 | 1 – 1440 (mins) |
| Filter | ||
| Warning Operator | GREATER_THAN_EQUAL | Ends with, ==, !=, >=, <=, >, <, In Range, Out of range, Equals, Not equals, Equals Ignore Case, Not Equals Ignore Case, Contains, Not contains, Regex match, Regex no match, In string list, Not in string list, In List, Not in list, Starts with |
| Warning Threshold | 90 | 0-100 |
| Warning Repeat Count | 2 | 1-12 |
| Critical Operator | GREATER_THAN_EQUAL | Ends with, ==, !=, >=, <=, >, <, In Range, Out of range, Equals, Not equals, Equals Ignore Case, Not Equals Ignore Case, Contains, Not contains, Regex match, Regex no match, In string list, Not in string list, In List, Not in list, Starts with |
| Critical Threshold | 95 | 0-100 |
| Critical Repeat Count | 2 | 1-12 |
| Alert | Yes | Yes/No |
| Graph (Yes/No) | Yes | Yes/No |
Sample Output
No graph
tcp.current.established.conn
Metric Details
| Applicable for | Device |
| SNMP OID | 1.3.6.1.2.1.6.9.0 |
| Expression | NULL |
| Description | The number of TCP connections for which the current state is either ESTABLISHED or CLOSE-WAIT. [OID: 1.3.6.1.2.1.6.9.0] |
| Category | SNMP monitors |
| Collector Type | Gateway |
| Monitor Name | TCP Statistics |
| Unit | None |
Possible Inputs
| Metric | Input Value | Range of Values |
|---|---|---|
| Frequency | 10 | 1 – 1440 (mins) |
| Filter | ||
| Warning Operator | ||
| Warning Threshold | ||
| Warning Repeat Count | ||
| Critical Operator | ||
| Critical Threshold | ||
| Critical Repeat Count | ||
| Alert | No | Yes/No |
| Graph (Yes/No) | Yes | Yes/No |
Sample Output
No graph
system.disk.allocation.failures
Metric Details
| Applicable for | Device |
| SNMP OID | 1.3.6.1.2.1.25.2.3.1.7 |
| Expression | NULL |
| Description | Monitors the number of requests for storage that could not be honored due to not enough storage. [OID: 1.3.6.1.2.1.25.2.3.1.7] |
| Category | SNMP monitors |
| Collector Type | Gateway |
| Monitor Name | Storage Allocation Failures - HR-MIB |
| Unit |
Possible Inputs
| Metric | Input Value | Range of Values |
|---|---|---|
| Frequency | 10 | 1 – 1440 (mins) |
| Filter | hrStorageType Equals 1.3.6.1.2.1.25.2.1.4 | |
| Warning Operator | ||
| Warning Threshold | ||
| Warning Repeat Count | ||
| Critical Operator | ||
| Critical Threshold | ||
| Critical Repeat Count | ||
| Alert | No | Yes/No |
| Graph (Yes/No) | Yes | Yes/No |
Sample Output
No graph
system.current.processes
Metric Details
| Applicable for | Device |
| SNMP OID | 1.3.6.1.2.1.25.1.6.0 |
| Expression | NULL |
| Description | The number of process contexts currently loaded or running on this system. [OID: 1.3.6.1.2.1.25.1.6.0] |
| Category | SNMP monitors |
| Collector Type | Gateway |
| Monitor Name | Current Processes - HR-MIB |
| Unit | None |
Possible Inputs
| Metric | Input Value | Range of Values |
|---|---|---|
| Frequency | 10 | 1 – 1440 (mins) |
| Filter | ||
| Warning Operator | ||
| Warning Threshold | ||
| Warning Repeat Count | ||
| Critical Operator | ||
| Critical Threshold | ||
| Critical Repeat Count | ||
| Alert | No | Yes/No |
| Graph (Yes/No) | Yes | Yes/No |
Sample Output
No graph
ucd.disk.io.read.accesses
Metric Details
| Applicable for | Device |
| SNMP OID | 1.3.6.1.4.1.2021.13.15.1.1.5 |
| Expression | NULL |
| Description | Monitors the number of disk IO read accesses per second. [OIDs: 1.3.6.1.4.1.2021.13.15.1.1.2, 1.3.6.1.4.1.2021.13.15.1.1.5] |
| Category | SNMP monitors |
| Collector Type | Gateway |
| Monitor Name | Disk IO Stats - UCD-DISKIO-MIB |
| Unit | psec |
Possible Inputs
| Metric | Input Value | Range of Values |
|---|---|---|
| Frequency | 10 | 1 – 1440 (mins) |
| Filter | NULL | Not Applicable |
| Warning Operator | ||
| Warning Threshold | ||
| Warning Repeat Count | ||
| Critical Operator | ||
| Critical Threshold | ||
| Critical Repeat Count | ||
| Alert | No | Yes/No |
| Graph (Yes/No) | Yes | Yes/No |
Sample Output
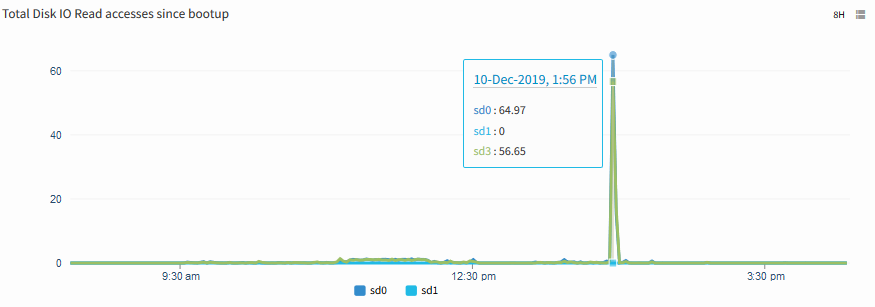
Total disk IO read accesses since bootup
ucd.disk.io.write.accesses
Metric Details
| Applicable for | Device |
| SNMP OID | 1.3.6.1.4.1.2021.13.15.1.1.6 |
| Expression | NULL |
| Description | Monitors the number of disk IO write accesses per second. [OIDs: 1.3.6.1.4.1.2021.13.15.1.1.2, 1.3.6.1.4.1.2021.13.15.1.1.6] |
| Category | SNMP monitors |
| Collector Type | Gateway |
| Monitor Name | Disk IO Stats - UCD-DISKIO-MIB |
| Unit | psec |
Possible Inputs
| Metric | Input Value | Range of Values |
|---|---|---|
| Frequency | 10 | 1 – 1440 (mins) |
| Filter | NULL | Not Applicable |
| Warning Operator | ||
| Warning Threshold | ||
| Warning Repeat Count | ||
| Critical Operator | ||
| Critical Threshold | ||
| Critical Repeat Count | ||
| Alert | No | Yes/No |
| Graph (Yes/No) | Yes | Yes/No |
Sample Output
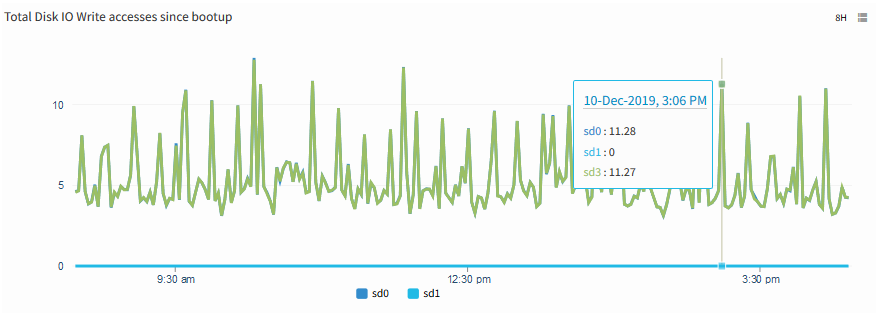
Total disk IO Write accesses since bootup
ucd.disk.io.readwrite.accesses
Metric Details
| Applicable for | Device |
| SNMP OID | NULL |
| Expression | diskIOReads + diskIOWrites |
| Description | Monitors the number of disk IO read and write accesses per second (read accesses + write accesses). |
| Category | SNMP monitors |
| Collector Type | Gateway |
| Monitor Name | Disk IO Stats - UCD-DISKIO-MIB |
| Unit | psec |
Possible Inputs
| Metric | Input Value | Range of Values |
|---|---|---|
| Frequency | 10 | 1 – 1440 (mins) |
| Filter | NULL | Not Applicable |
| Warning Operator | ||
| Warning Threshold | ||
| Warning Repeat Count | ||
| Critical Operator | ||
| Critical Threshold | ||
| Critical Repeat Count | ||
| Alert | No | Yes/No |
| Graph (Yes/No) | Yes | Yes/No |
Sample Output
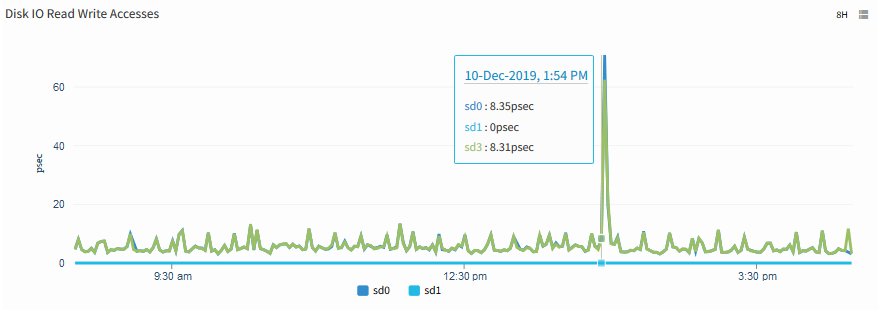
Disk IO Read Write Accesses
ucd.disk.io.total.bytes
Metric Details
| Applicable for | Device |
| SNMP OID | NULL |
| Expression | ucd.disk.io.write.bytes + ucd.disk.io.read.bytes |
| Description | Monitors the disk IO total (read + write) number of bytes per second. |
| Category | SNMP monitors |
| Collector Type | Gateway |
| Monitor Name | Disk IO Stats - UCD-DISKIO-MIB |
| Unit | Bps |
Possible Inputs
| Metric | Input Value | Range of Values |
|---|---|---|
| Frequency | 10 | 1 – 1440 (mins) |
| Filter | NULL | Not Applicable |
| Warning Operator | ||
| Warning Threshold | ||
| Warning Repeat Count | ||
| Critical Operator | ||
| Critical Threshold | ||
| Critical Repeat Count | ||
| Alert | No | Yes/No |
| Graph (Yes/No) | Yes | Yes/No |
Sample Output
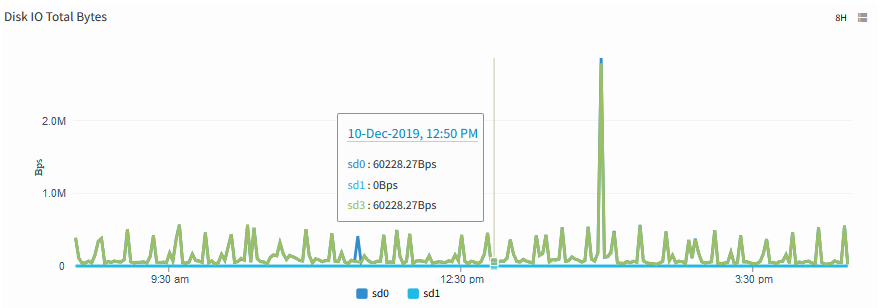
Disk IO Total Bytes
ucd.disk.io.read.bytes
Metric Details
| Applicable for | Device |
| SNMP OID | 1.3.6.1.4.1.2021.13.15.1.1.12, 1.3.6.1.4.1.2021.13.15.1.1.3 |
| Expression | if(isDef(diskIONReadX),diskIONReadX,diskIONRead) |
| Description | Monitors the number of bytes read per second from disk IO device. [OID: 1.3.6.1.4.1.2021.13.15.1.1.12] |
| Category | SNMP monitors |
| Collector Type | Gateway |
| Monitor Name | Disk IO Stats - UCD-DISKIO-MIB |
| Unit | Bps |
Possible Inputs
| Metric | Input Value | Range of Values |
|---|---|---|
| Frequency | 10 | 1 – 1440 (mins) |
| Filter | NULL | Not Applicable |
| Warning Operator | ||
| Warning Threshold | ||
| Warning Repeat Count | ||
| Critical Operator | ||
| Critical Threshold | ||
| Critical Repeat Count | ||
| Alert | No | Yes/No |
| Graph (Yes/No) | Yes | Yes/No |
Sample Output
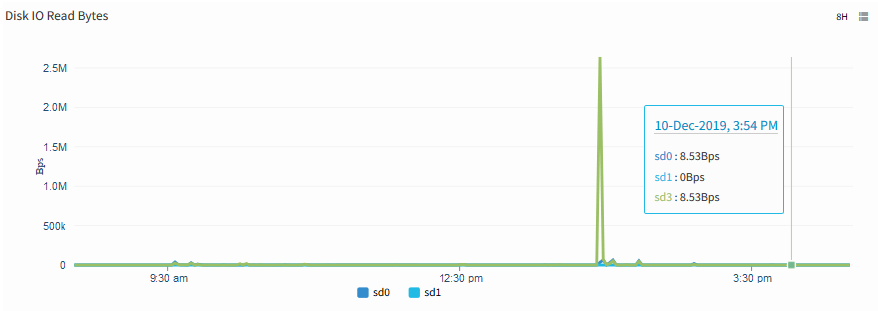
Disk IO Read Bytes
ucd.disk.io.write.bytes
Metric Details
| Applicable for | Device |
| SNMP OID | 1.3.6.1.4.1.2021.13.15.1.1.13, 1.3.6.1.4.1.2021.13.15.1.1.4 |
| Expression | if(isDef(diskIONWrittenX),diskIONWrittenX,diskIONWritten) |
| Description | Monitors the number of bytes written per second to disk IO device. [OID: 1.3.6.1.4.1.2021.13.15.1.1.13] |
| Category | SNMP monitors |
| Collector Type | Gateway |
| Monitor Name | Disk IO Stats - UCD-DISKIO-MIB |
| Unit | Bps |
Possible Inputs
| Metric | Input Value | Range of Values |
|---|---|---|
| Frequency | 10 | 1 – 1440 (mins) |
| Filter | NULL | Not Applicable |
| Warning Operator | ||
| Warning Threshold | ||
| Warning Repeat Count | ||
| Critical Operator | ||
| Critical Threshold | ||
| Critical Repeat Count | ||
| Alert | No | Yes/No |
| Graph (Yes/No) | Yes | Yes/No |
Sample Output
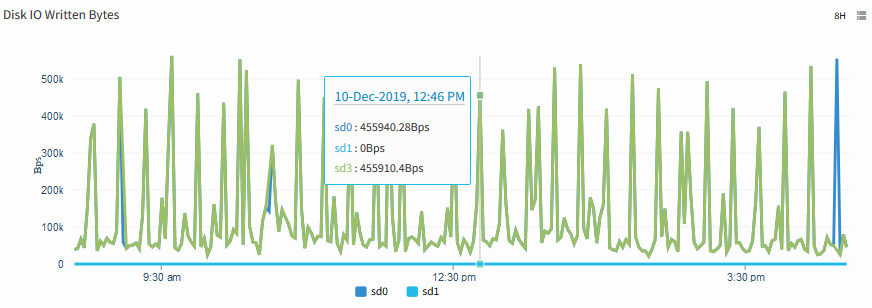
Disk IO Written Bytes
ucd.disk.io.app.load.avg.5
Metric Details
| Applicable for | Device |
| SNMP OID | 1.3.6.1.4.1.2021.13.15.1.1.10 |
| Expression | NULL |
| Description | Monitors the 5 minute average load of disk (%). [OID: 1.3.6.1.4.1.2021.13.15.1.1.10] |
| Category | SNMP monitors |
| Collector Type | Gateway |
| Monitor Name | Disk IO Stats - UCD-DISKIO-MIB |
| Unit | % |
Possible Inputs
| Metric | Input Value | Range of Values |
|---|---|---|
| Frequency | 10 | 1 – 1440 (mins) |
| Filter | NULL | Not Applicable |
| Warning Operator | GREATER_THAN_EQUAL | Ends with, ==, !=, >=, <=, >, <, In Range, Out of range, Equals, Not equals, Equals Ignore Case, Not Equals Ignore Case, Contains, Not contains, Regex match, Regex no match, In string list, Not in string list, In List, Not in list, Starts with |
| Warning Threshold | 80 | 0-100 |
| Warning Repeat Count | 2 | 1-12 |
| Critical Operator | GREATER_THAN_EQUAL | Ends with, ==, !=, >=, <=, >, <, In Range, Out of range, Equals, Not equals, Equals Ignore Case, Not Equals Ignore Case, Contains, Not contains, Regex match, Regex no match, In string list, Not in string list, In List, Not in list, Starts with |
| Critical Threshold | 90 | 0-100 |
| Critical Repeat Count | 2 | 1-12 |
| Alert | Yes | Yes/No |
| Graph (Yes/No) | Yes | Yes/No |
Sample Output
No graph
ucd.disk.io.app.load.avg.15
Metric Details
| Applicable for | Device |
| SNMP OID | 1.3.6.1.4.1.2021.13.15.1.1.11 |
| Expression | NULL |
| Description | Monitors the 15 minute average load of disk (%). [OID: 1.3.6.1.4.1.2021.13.15.1.1.11] |
| Category | SNMP monitors |
| Collector Type | Gateway |
| Monitor Name | Disk IO Stats - UCD-DISKIO-MIB |
| Unit | % |
Possible Inputs
| Metric | Input Value | Range of Values |
|---|---|---|
| Frequency | 10 | 1 – 1440 (mins) |
| Filter | NULL | Not Applicable |
| Warning Operator | ||
| Warning Threshold | ||
| Warning Repeat Count | ||
| Critical Operator | ||
| Critical Threshold | ||
| Critical Repeat Count | ||
| Alert | No | Yes/No |
| Graph (Yes/No) | Yes | Yes/No |
Sample Output
No graph