Description
Validated on Synology DSM 5.2-5592 version and RS3614xs+ model devices. Monitors the Synology System Status, Power Status, System Temperature, System Fan Status, CPU Fan Status, Disk Status, Disk Temperature and Raid Status. [Using: SYNOLOGY-DISK-MIB, SYNOLOGY-SYSTEM-MIB, SYNOLOGY-RAID-MIB]
Prerequisites
SNMP should be enabled in end device and device should support SYNOLOGY-DISK-MIB, SYNOLOGY-SYSTEM-MIB, SYNOLOGY-RAID-MIB and SNMP credentials should be attached against the device in portal.
How to Apply: This template is All instance selection based. It will not ask user to select any instance(s) while assigning it to a device.
Metric Parameters
| Parameter | Description |
|---|---|
| Frequency | Warning Threshold | If the metric value satisfies the condition defined along with Warning Threshold value, then a notification is sent to the user. |
| Critical Threshold | If the metric value satisfies the condition defined along with Critical Threshold value, then a notification is sent to the user. |
| Alert | The alert value can be set to either Yes or No. If it is Yes, then an alert message is sent to the user. |
Metrics
synology.disk.status
Metric Details
| Applicable for | Device |
| SNMP OID | 1.3.6.1.4.1.6574.2.1.1.3, 1.3.6.1.4.1.6574.2.1.1.5 |
| Expression | diskStatus |
| Description | Monitors the Synology disk status. Meanings of status represented are described below: Normal(1): The hard disk functions normally. Initialized(2): The hard disk has system partition but no data. NotInitialized(3): The hard disk does not have system in system partition. SystemPartitionFailed(4): The system partitions on the hard disks are damaged. Crashed(5): The hard disk has damaged. [OIDs: 1.3.6.1.4.1.6574.2.1.1.2, 1.3.6.1.4.1.6574.2.1.1.3, 1.3.6.1.4.1.6574.2.1.1.5] |
| Category | SNMP monitors |
| Collector Type | Gateway |
| Monitor Name | Synology Disk Health |
| Unit |
Possible Inputs
| Metric | Input Value | Range of Values |
|---|---|---|
| Frequency | 5 | 1 – 1440 (mins) |
| Filter | NULL | Not Applicable |
| Warning Operator | ||
| Warning Threshold | ||
| Warning Repeat Count | ||
| Critical Operator | NOT_EQUAL | Ends with, ==, !=, >=, <=, >, <, In Range, Out of range, Equals, Not equals, Equals Ignore Case, Not Equals Ignore Case, Contains, Not contains, Regex match, Regex no match, In string list, Not in string list, In List, Not in list, Starts with |
| Critical Threshold | 1 | [{"1":"Normal"},{"2":"Initialized"},{"3":"NotInitialized"},{"4":"SystemPartitionFailed"},{"5":"Crashed"}] |
| Critical Repeat Count | 1 | 1-12 |
| Alert | Yes | Yes/No |
| Graph (Yes/No) | Yes | Yes/No |
Sample Output
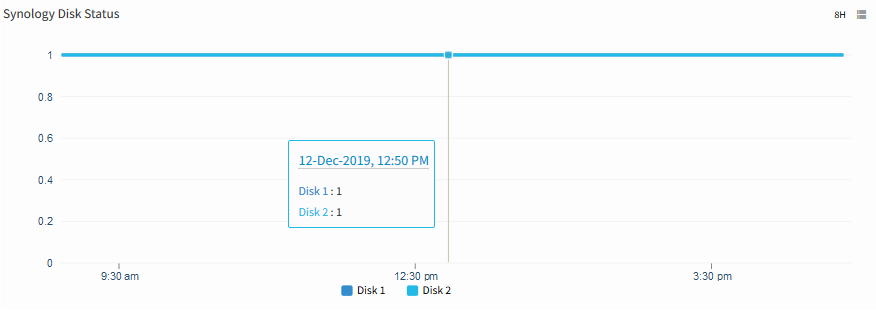
Synology Disk Status
synology.disk.temperature
Metric Details
| Applicable for | Device |
| SNMP OID | 1.3.6.1.4.1.6574.2.1.1.6 |
| Expression | NULL |
| Description | Provides the synology disk temperature details. [OIDs: 1.3.6.1.4.1.6574.2.1.1.2, 1.3.6.1.4.1.6574.2.1.1.3, 1.3.6.1.4.1.6574.2.1.1.6] |
| Category | SNMP monitors |
| Collector Type | Gateway |
| Monitor Name | Synology Disk Health |
| Unit | C |
Possible Inputs
| Metric | Input Value | Range of Values |
|---|---|---|
| Frequency | 5 | 1 – 1440 (mins) |
| Filter | NULL | Not Applicable |
| Warning Operator | GREATER_THAN | Ends with, ==, !=, >=, <=, >, <, In Range, Out of range, Equals, Not equals, Equals Ignore Case, Not Equals Ignore Case, Contains, Not contains, Regex match, Regex no match, In string list, Not in string list, In List, Not in list, Starts with |
| Warning Threshold | 45 | 0 - 2147483647 |
| Warning Repeat Count | 1 | 1-12 |
| Critical Operator | GREATER_THAN | Ends with, ==, !=, >=, <=, >, <, In Range, Out of range, Equals, Not equals, Equals Ignore Case, Not Equals Ignore Case, Contains, Not contains, Regex match, Regex no match, In string list, Not in string list, In List, Not in list, Starts with |
| Critical Threshold | 50 | 0 - 2147483647 |
| Critical Repeat Count | 1 | 1-12 |
| Alert | Yes | Yes/No |
| Graph (Yes/No) | Yes | Yes/No |
Sample Output
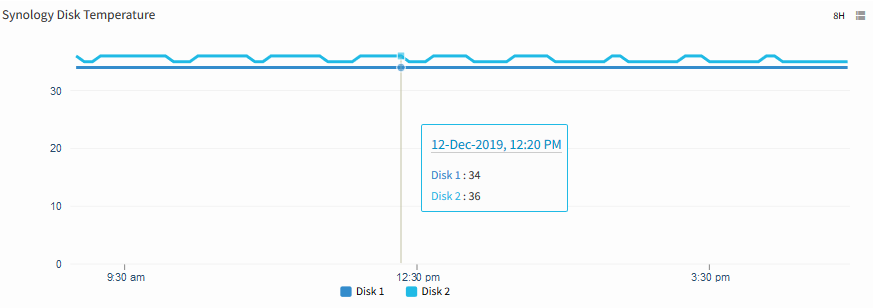
Synology Disk Temperature
synology.raid.status
Metric Details
| Applicable for | Device |
| SNMP OID | 1.3.6.1.4.1.6574.3.1.1.3 |
| Expression | NULL |
| Description | Monitors the Synology Raid status. Meanings of status represented are described below. Normal(1): The raid functions normally. Degrade(11): Degrade happens when a tolerable failure of disk(s) occurs. Crashed(12): Raid has crashed and just uses for read-only operation. Note: Other status will be showed when creating or deleting raids, including below status, Repairing(2), Migrating(3), Expanding(4), Deleting(5), Creating(6), RaidSyncing(7), RaidParityChecking(8), RaidAssembling(9) and Canceling(10). [OID: 1.3.6.1.4.1.6574.3.1.1.3] |
| Category | SNMP monitors |
| Collector Type | Gateway |
| Monitor Name | Synology Raid Status |
| Unit |
Possible Inputs
| Metric | Input Value | Range of Values |
|---|---|---|
| Frequency | 5 | 1 – 1440 (mins) |
| Filter | NULL | Not Applicable |
| Warning Operator | IN_LIST | Ends with, ==, !=, >=, <=, >, <, In Range, Out of range, Equals, Not equals, Equals Ignore Case, Not Equals Ignore Case, Contains, Not contains, Regex match, Regex no match, In string list, Not in string list, In List, Not in list, Starts with |
| Warning Threshold | 2,3,4,5,6,7,8,9,10 | [{"1":"Normal"},{"2":"Repairing"},{"3":"Migrating"},{"4":"Expanding"},{"5":"Deleting"},{"6":"Creating"},{"7":"RaidSyncing"},{"8":"RaidParityChecking"},{"9":"RaidAssembling"},{"10":"Canceling"},{"11":"Degrade"},{"12":"Crashed"}] |
| Warning Repeat Count | 1 | 1-12 |
| Critical Operator | IN_LIST | Ends with, ==, !=, >=, <=, >, <, In Range, Out of range, Equals, Not equals, Equals Ignore Case, Not Equals Ignore Case, Contains, Not contains, Regex match, Regex no match, In string list, Not in string list, In List, Not in list, Starts with |
| Critical Threshold | 11,12 | [{"1":"Normal"},{"2":"Repairing"},{"3":"Migrating"},{"4":"Expanding"},{"5":"Deleting"},{"6":"Creating"},{"7":"RaidSyncing"},{"8":"RaidParityChecking"},{"9":"RaidAssembling"},{"10":"Canceling"},{"11":"Degrade"},{"12":"Crashed"}] |
| Critical Repeat Count | 1 | 1-12 |
| Alert | Yes | Yes/No |
| Graph (Yes/No) | Yes | Yes/No |
Sample Output
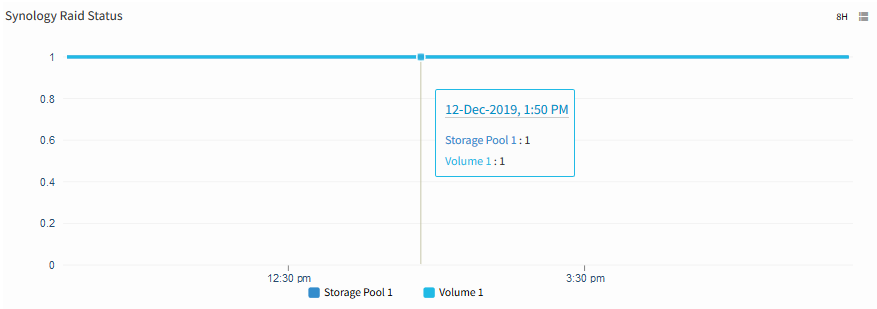
Synology Raid Status
synology.system.status
Metric Details
| Applicable for | Device |
| SNMP OID | 1.3.6.1.4.1.6574.1.1.0 |
| Expression | NULL |
| Description | Provides the Synology system/volume status. Possible status values are Normal(1) - System functions normally, Failed(2) - Volume has crashed. [OID: 1.3.6.1.4.1.6574.1.1.0] |
| Category | SNMP monitors |
| Collector Type | Gateway |
| Monitor Name | Synology System Health |
| Unit |
Possible Inputs
| Metric | Input Value | Range of Values |
|---|---|---|
| Frequency | 5 | 1 – 1440 (mins) |
| Filter | ||
| Warning Operator | ||
| Warning Threshold | ||
| Warning Repeat Count | ||
| Critical Operator | EQUAL | Ends with, ==, !=, >=, <=, >, <, In Range, Out of range, Equals, Not equals, Equals Ignore Case, Not Equals Ignore Case, Contains, Not contains, Regex match, Regex no match, In string list, Not in string list, In List, Not in list, Starts with |
| Critical Threshold | 2 | [{"1":"Normal"},{"2":"Failed"}] |
| Critical Repeat Count | 1 | 1-12 |
| Alert | Yes | Yes/No |
| Graph (Yes/No) | Yes | Yes/No |
Sample Output
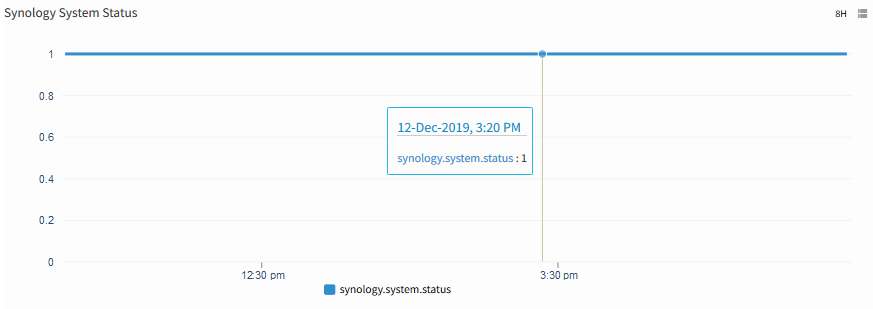
Synology System Status
synology.system.temperature
Metric Details
| Applicable for | Device |
| SNMP OID | 1.3.6.1.4.1.6574.1.2.0 |
| Expression | NULL |
| Description | Provides the Synology temperature details. [OID: 1.3.6.1.4.1.6574.1.2.0] |
| Category | SNMP monitors |
| Collector Type | Gateway |
| Monitor Name | Synology System Health |
| Unit | C |
Possible Inputs
| Metric | Input Value | Range of Values |
|---|---|---|
| Frequency | 5 | 1 – 1440 (mins) |
| Filter | ||
| Warning Operator | GREATER_THAN | Ends with, ==, !=, >=, <=, >, <, In Range, Out of range, Equals, Not equals, Equals Ignore Case, Not Equals Ignore Case, Contains, Not contains, Regex match, Regex no match, In string list, Not in string list, In List, Not in list, Starts with |
| Warning Threshold | 45 | 0 - 2147483647 |
| Warning Repeat Count | 1 | 1-12 |
| Critical Operator | GREATER_THAN | Ends with, ==, !=, >=, <=, >, <, In Range, Out of range, Equals, Not equals, Equals Ignore Case, Not Equals Ignore Case, Contains, Not contains, Regex match, Regex no match, In string list, Not in string list, In List, Not in list, Starts with |
| Critical Threshold | 50 | 0 - 2147483647 |
| Critical Repeat Count | 1 | 1-12 |
| Alert | Yes | Yes/No |
| Graph (Yes/No) | Yes | Yes/No |
Sample Output
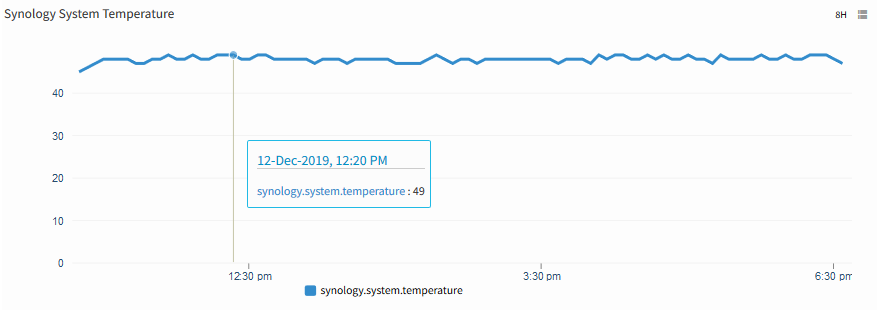
Synology System Temperature
synology.power.status
Metric Details
| Applicable for | Device |
| SNMP OID | 1.3.6.1.4.1.6574.1.3.0 |
| Expression | NULL |
| Description | Provides the Synology power status. Possible status values are Normal(1) - All power supplies functional normally, Failed(2) - One of power supply has failed. [OID: 1.3.6.1.4.1.6574.1.3.0] |
| Category | SNMP monitors |
| Collector Type | Gateway |
| Monitor Name | Synology System Health |
| Unit |
Possible Inputs
| Metric | Input Value | Range of Values |
|---|---|---|
| Frequency | 5 | 1 – 1440 (mins) |
| Filter | ||
| Warning Operator | ||
| Warning Threshold | ||
| Warning Repeat Count | ||
| Critical Operator | EQUAL | Ends with, ==, !=, >=, <=, >, <, In Range, Out of range, Equals, Not equals, Equals Ignore Case, Not Equals Ignore Case, Contains, Not contains, Regex match, Regex no match, In string list, Not in string list, In List, Not in list, Starts with |
| Critical Threshold | 2 | [{"1":"Normal"},{"2":"Failed"}] |
| Critical Repeat Count | 1 | 1-12 |
| Alert | Yes | Yes/No |
| Graph (Yes/No) | Yes | Yes/No |
Sample Output
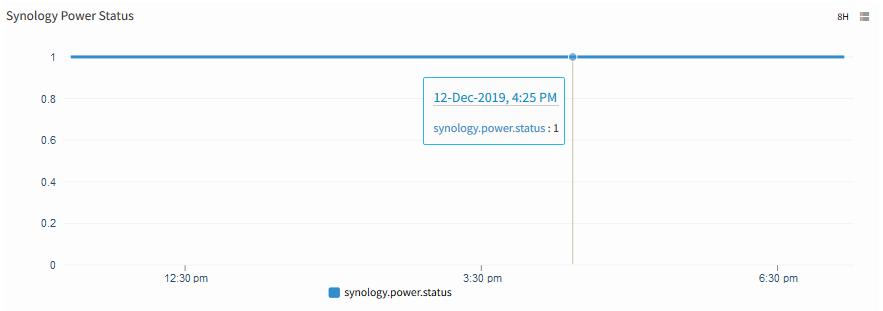
Synology Power Status
synology.system.fan.status
Metric Details
| Applicable for | Device |
| SNMP OID | 1.3.6.1.4.1.6574.1.4.1.0 |
| Expression | NULL |
| Description | Provides the Synology system fan status. Possible status values are Normal(1) - All Internal fans functional normally, Failed(2) - One of internal fan stopped. [OID: 1.3.6.1.4.1.6574.1.4.1.0] |
| Category | SNMP monitors |
| Collector Type | Gateway |
| Monitor Name | Synology System Health |
| Unit |
Possible Inputs
| Metric | Input Value | Range of Values |
|---|---|---|
| Frequency | 5 | 1 – 1440 (mins) |
| Filter | ||
| Warning Operator | ||
| Warning Threshold | ||
| Warning Repeat Count | ||
| Critical Operator | EQUAL | Ends with, ==, !=, >=, <=, >, <, In Range, Out of range, Equals, Not equals, Equals Ignore Case, Not Equals Ignore Case, Contains, Not contains, Regex match, Regex no match, In string list, Not in string list, In List, Not in list, Starts with |
| Critical Threshold | 2 | [{"1":"Normal"},{"2":"Failed"}] |
| Critical Repeat Count | 1 | 1-12 |
| Alert | Yes | Yes/No |
| Graph (Yes/No) | Yes | Yes/No |
Sample Output
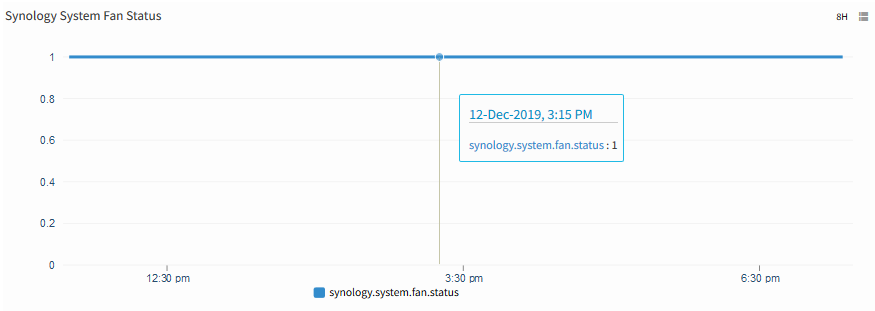
Synology System Fan Status
synology.cpu.fan.status
Metric Details
| Applicable for | Device |
| SNMP OID | 1.3.6.1.4.1.6574.1.4.2.0 |
| Expression | NULL |
| Description | Provides the Synology CPU fan status. Possible status values are Normal(1) - All CPU fans functional normally, Failed(2) - One of CPU fan stopped. [OID: 1.3.6.1.4.1.6574.1.4.2.0] |
| Category | SNMP monitors |
| Collector Type | Gateway |
| Monitor Name | Synology System Health |
| Unit |
Possible Inputs
| Metric | Input Value | Range of Values |
|---|---|---|
| Frequency | 5 | 1 – 1440 (mins) |
| Filter | ||
| Warning Operator | ||
| Warning Threshold | ||
| Warning Repeat Count | ||
| Critical Operator | EQUAL | Ends with, ==, !=, >=, <=, >, <, In Range, Out of range, Equals, Not equals, Equals Ignore Case, Not Equals Ignore Case, Contains, Not contains, Regex match, Regex no match, In string list, Not in string list, In List, Not in list, Starts with |
| Critical Threshold | 2 | [{"1":"Normal"},{"2":"Failed"}] |
| Critical Repeat Count | 1 | 1-12 |
| Alert | Yes | Yes/No |
| Graph (Yes/No) | Yes | Yes/No |
Sample Output
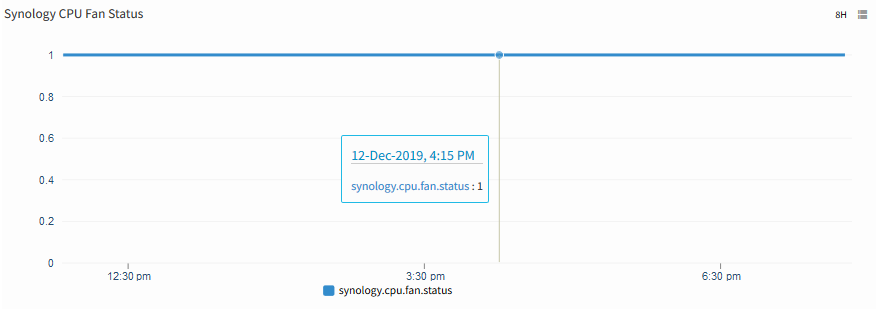
Synology CPU Fan Status
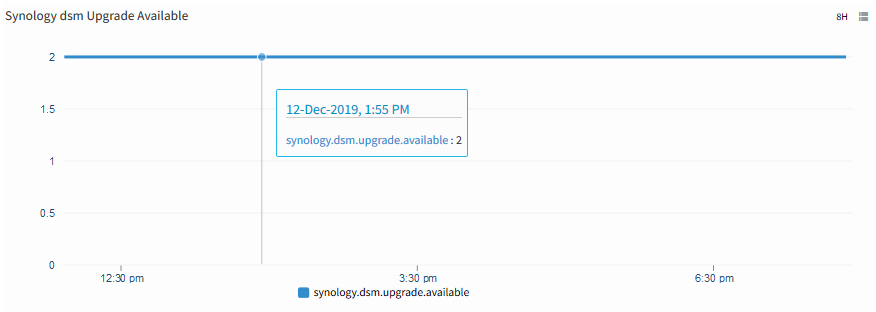
synology.dsm.upgrade.available
Metric Details
| Applicable for | Device |
| SNMP OID | 1.3.6.1.4.1.6574.1.5.4.0 |
| Expression | NULL |
| Description | Provides the Synology DSM upgrade availability status. Possible status values are Available(1) - There is version ready for download, Unavailable(2) - The DSM is latest version, Connecting(3) - Checking for the latest DSM, Disconnected(4) - Failed to connect to server, Others(5) - If DSM is upgrading or downloading, the status will show others. [OID: 1.3.6.1.4.1.6574.1.5.4.0] |
| Category | SNMP monitors |
| Collector Type | Gateway |
| Monitor Name | Synology System Health |
| Unit |
Possible Inputs
| Metric | Input Value | Range of Values |
|---|---|---|
| Frequency | 5 | 1 – 1440 (mins) |
| Filter | ||
| Warning Operator | IN_LIST | Ends with, ==, !=, >=, <=, >, <, In Range, Out of range, Equals, Not equals, Equals Ignore Case, Not Equals Ignore Case, Contains, Not contains, Regex match, Regex no match, In string list, Not in string list, In List, Not in list, Starts with |
| Warning Threshold | 1,4,5 | [{"1":"Available"},{"2":"Unavailable"},{"3":"Connecting"},{"4":"Disconnected"},{"5":"Others"}] |
| Warning Repeat Count | 1 | 1-12 |
| Critical Operator | ||
| Critical Threshold | ||
| Critical Repeat Count | ||
| Alert | Yes | Yes/No |
| Graph (Yes/No) | Yes | Yes/No |
Sample Output