Description
This template is used to capture the VMware host performance present in vCenter.
Prerequisites
Gateway should be up and running. vCenter device should be reachable from Gateway. vCenter’s host should be in managed state.
How to Apply: This template is All instance selection based. It will not ask user to select any instance (s) while assigning it to a device.
Metric Parameters
| Parameter | Description |
|---|---|
| Frequency | |
| Warning Threshold | If the metric value satisfies the condition defined along with Warning Threshold value, then a notification is sent to the user. |
| Critical Threshold | If the metric value satisfies the condition defined along with Critical Threshold value, then a notification is sent to the user. |
| Alert | The alert value can be set to either Yes or No. If it is Yes, then an alert message is sent to the user. |
Metrics
vmware.host.status.availability
Metric Details
| Applicable for | Device |
| Description | VMware Host availability status |
| Category | Vmware |
| Collector Type | Gateway |
| Monitor Name | VMware Host Performance |
| Unit | NULL |
Possible Inputs
| Metric | Input Value | Range of Values |
|---|---|---|
| Frequency | 5 | 1 – 1440 (mins) |
| Filter | NULL | Not Applicable |
| Warning Operator | Manual | Manual |
| Warning Threshold | Manual | Manual |
| Warning Repeat Count | Manual | Manual |
| Critical Operator | Manual | Manual |
| Critical Threshold | Manual | Manual |
| Critical Repeat Count | Manual | Manual |
| Alert | Yes | Yes/No |
| Graph (Yes/No) | Yes | Yes/No |
Sample Output
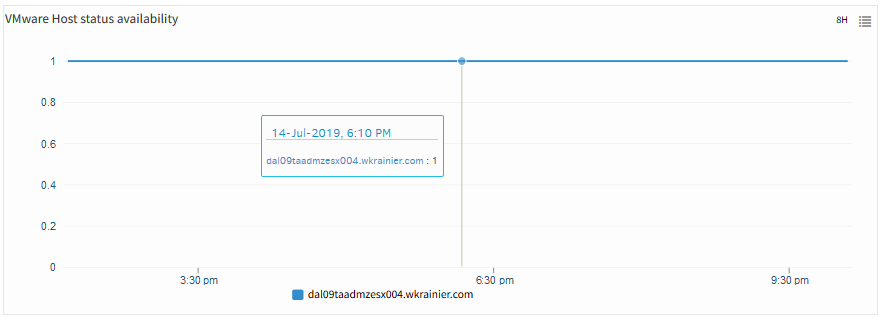
VMware Host Status Availability
vmware.cpu.usage.average
Metric Details
| Applicable for | Device |
| Description | cpu usage average |
| Category | Vmware |
| Collector Type | Gateway |
| Monitor Name | VMware Host Performance |
| Unit | % |
Possible Inputs
| Metric | Input Value | Range of Values |
|---|---|---|
| Frequency | 5 | 1 – 1440 (mins) |
| Filter | NULL | Not Applicable |
| Warning Operator | GREATER_THAN_EQUAL | Ends with, ==, !=, >=, <=, >, <, In Range, Out of range, Equals, Not equals, Equals Ignore Case, Not Equals Ignore Case, Contains, Not contains, Regex match, Regex no match, In string list, Not in string list, In List, Not in list, Starts with |
| Warning Threshold | 70 | Manual |
| Warning Repeat Count | Manual | Manual |
| Critical Operator | GREATER_THAN_EQUAL | Ends with, ==, !=, >=, <=, >, <, In Range, Out of range, Equals, Not equals, Equals Ignore Case, Not Equals Ignore Case, Contains, Not contains, Regex match, Regex no match, In string list, Not in string list, In List, Not in list, Starts with |
| Critical Threshold | 80 | Manual |
| Critical Repeat Count | Manual | Manual |
| Alert | Yes | Yes/No |
| Graph (Yes/No) | Yes | Yes/No |
Sample Output
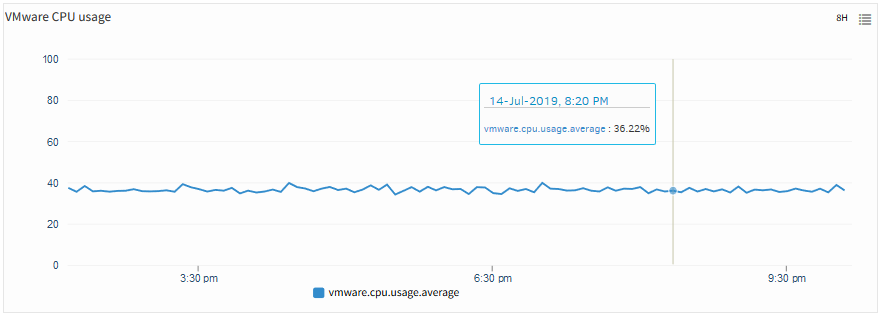
VMware CPU usage
vmware.mem.usage.average
Metric Details
| Applicable for | Device |
| Description | memory usage average |
| Category | Vmware |
| Collector Type | Gateway |
| Monitor Name | VMware Host Performance |
| Unit | % |
Possible Inputs
| Metric | Input Value | Range of Values |
|---|---|---|
| Frequency | 5 | 1 – 1440 (mins) |
| Filter | NULL | Not Applicable |
| Warning Operator | GREATER_THAN_EQUAL | Ends with, ==, !=, >=, <=, >, <, In Range, Out of range, Equals, Not equals, Equals Ignore Case, Not Equals Ignore Case, Contains, Not contains, Regex match, Regex no match, In string list, Not in string list, In List, Not in list, Starts with |
| Warning Threshold | 70 | Manual |
| Warning Repeat Count | Manual | Manual |
| Critical Operator | GREATER_THAN_EQUAL | Ends with, ==, !=, >=, <=, >, <, In Range, Out of range, Equals, Not equals, Equals Ignore Case, Not Equals Ignore Case, Contains, Not contains, Regex match, Regex no match, In string list, Not in string list, In List, Not in list, Starts with |
| Critical Threshold | 80 | Manual |
| Critical Repeat Count | Manual | Manual |
| Alert | Yes | Yes/No |
| Graph (Yes/No) | Yes | Yes/No |
Sample Output
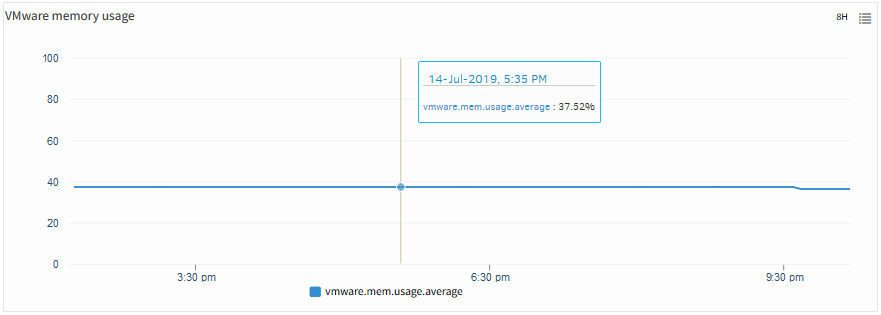
VMware memoryusage
vmware.disk.usage.average
Metric Details
| Applicable for | Device |
| Description | VMware disk usage average |
| Category | Vmware |
| Collector Type | Gateway |
| Monitor Name | VMware Host Performance |
| Unit | KBps |
Possible Inputs
| Metric | Input Value | Range of Values |
|---|---|---|
| Frequency | 5 | 1 – 1440 (mins) |
| Filter | NULL | Not Applicable |
| Warning Operator | Manual | Manual |
| Warning Threshold | Manual | Manual |
| Warning Repeat Count | Manual | Manual |
| Critical Operator | Manual | Manual |
| Critical Threshold | Manual | Manual |
| Critical Repeat Count | Manual | Manual |
| Alert | No | Yes/No |
| Graph (Yes/No) | Yes | Yes/No |
Sample Output
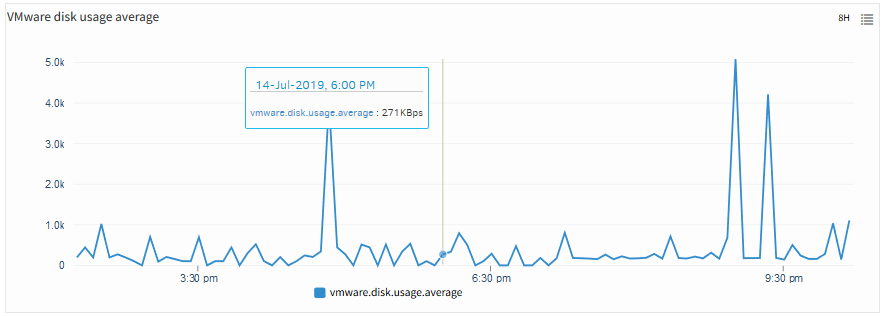
VMware disk usage average
vmware.net.usage.average
Metric Details
| Applicable for | Device |
| Description | net usage average |
| Category | Vmware |
| Collector Type | Gateway |
| Monitor Name | VMware Host Performance |
| Unit | KBps |
Possible Inputs
| Metric | Input Value | Range of Values |
|---|---|---|
| Frequency | 5 | 1 – 1440 (mins) |
| Filter | NULL | Not Applicable |
| Warning Operator | Manual | Manual |
| Warning Threshold | Manual | Manual |
| Warning Repeat Count | Manual | Manual |
| Critical Operator | Manual | Manual |
| Critical Threshold | Manual | Manual |
| Critical Repeat Count | Manual | Manual |
| Alert | No | Yes/No |
| Graph (Yes/No) | Yes | Yes/No |
Sample Output
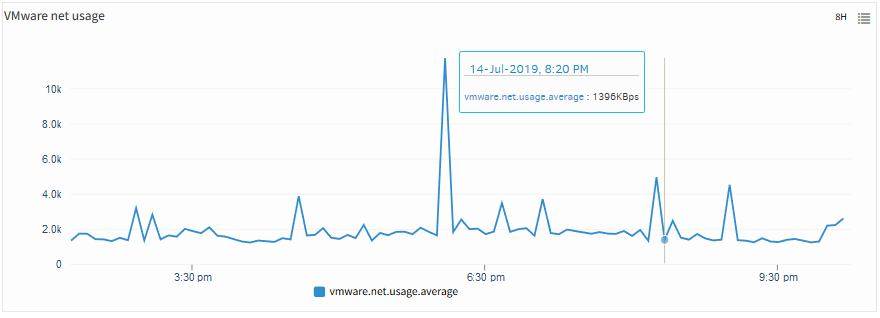
VMware net usage
vmware.datastore.totalReadLatency.average
Metric Details
| Applicable for | Device |
| Description | Datastore Read Latency |
| Category | Vmware |
| Collector Type | Gateway |
| Monitor Name | VMware Host Performance |
| Unit | ms |
Possible Inputs
| Metric | Input Value | Range of Values |
|---|---|---|
| Frequency | 5 | 1 – 1440 (mins) |
| Filter | NULL | Not Applicable |
| Warning Operator | Manual | Manual |
| Warning Threshold | Manual | Manual |
| Warning Repeat Count | Manual | Manual |
| Critical Operator | Manual | Manual |
| Critical Threshold | Manual | Manual |
| Critical Repeat Count | Manual | Manual |
| Alert | No | Yes/No |
| Graph (Yes/No) | Yes | Yes/No |
Sample Output
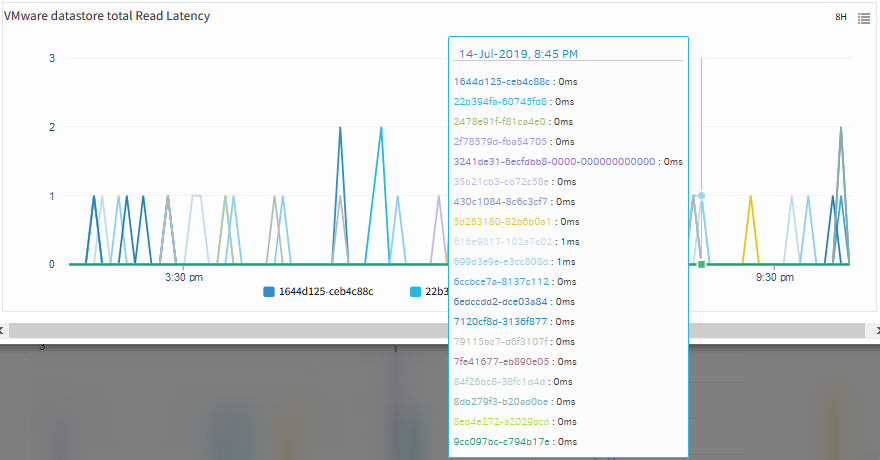
VMware datastore Read Latency
vmware.datastore.totalWriteLatency.average
Metric Details
| Applicable for | Device |
| Description | Datastore Write latency |
| Category | Vmware |
| Collector Type | Gateway |
| Monitor Name | VMware Host Performance |
| Unit | ms |
Possible Inputs
Sample Output
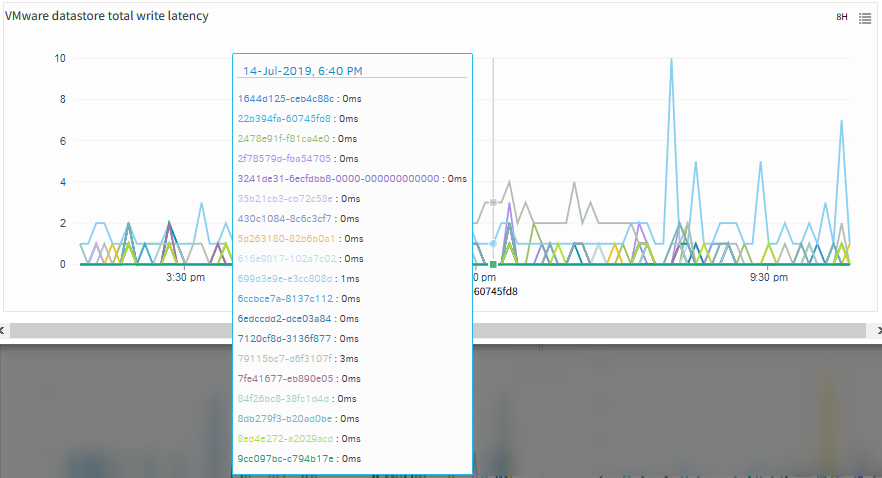
VMware datastore Write Latency
vmware.datastore.maxTotalLatency.latest
Metric Details
| Applicable for | Device |
| Description | datastore max totallatency latest |
| Category | Vmware |
| Collector Type | Gateway |
| Monitor Name | VMware Host Performance |
| Unit | ms |
Possible Inputs
| Metric | Input Value | Range of Values |
|---|---|---|
| Frequency | 5 | 1 – 1440 (mins) |
| Filter | NULL | Not Applicable |
| Warning Operator | Manual | Manual |
| Warning Threshold | Manual | Manual |
| Warning Repeat Count | Manual | Manual |
| Critical Operator | Manual | Manual |
| Critical Threshold | Manual | Manual |
| Critical Repeat Count | Manual | Manual |
| Alert | No | Yes/No |
| Graph (Yes/No) | Yes | Yes/No |
Sample Output
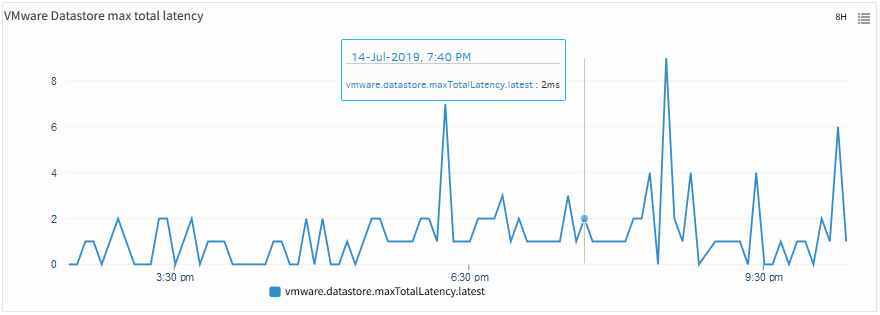
VMware datastore max total Latency
vmware.mem.consumed.average
Metric Details
| Applicable for | Device |
| Description | Memory consumed average |
| Category | Vmware |
| Collector Type | Gateway |
| Monitor Name | VMware Host Performance |
| Unit | GB |
Possible Inputs
| Metric | Input Value | Range of Values |
|---|---|---|
| Frequency | 5 | 1 – 1440 (mins) |
| Filter | NULL | Not Applicable |
| Warning Operator | Manual | Manual |
| Warning Threshold | Manual | Manual |
| Warning Repeat Count | Manual | Manual |
| Critical Operator | Manual | Manual |
| Critical Threshold | Manual | Manual |
| Critical Repeat Count | Manual | Manual |
| Alert | No | Yes/No |
| Graph (Yes/No) | Yes | Yes/No |
Sample Output
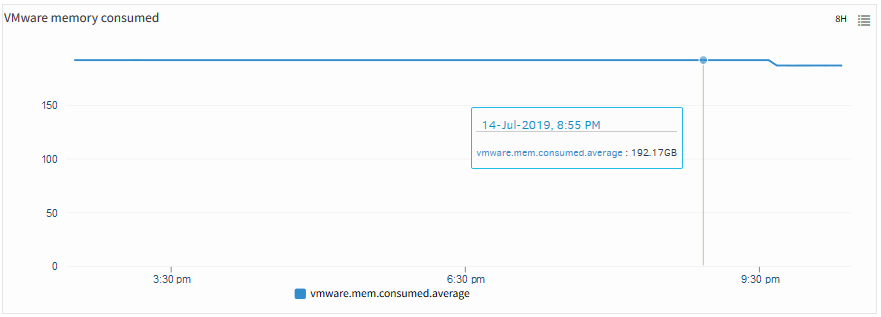
VMware memory consumed
vmware.vm.suspended.count
Metric Details
| Applicable for | Device |
| Description | VMware VM suspended count |
| Category | Vmware |
| Collector Type | Gateway |
| Monitor Name | VMware Host Performance |
| Unit | NULL |
Possible Inputs
| Metric | Input Value | Range of Values |
|---|---|---|
| Frequency | 5 | 1 – 1440 (mins) |
| Filter | NULL | Not Applicable |
| Warning Operator | Manual | Manual |
| Warning Threshold | Manual | Manual |
| Warning Repeat Count | Manual | Manual |
| Critical Operator | Manual | Manual |
| Critical Threshold | Manual | Manual |
| Critical Repeat Count | Manual | Manual |
| Alert | No | Yes/No |
| Graph (Yes/No) | Yes | Yes/No |
Sample Output
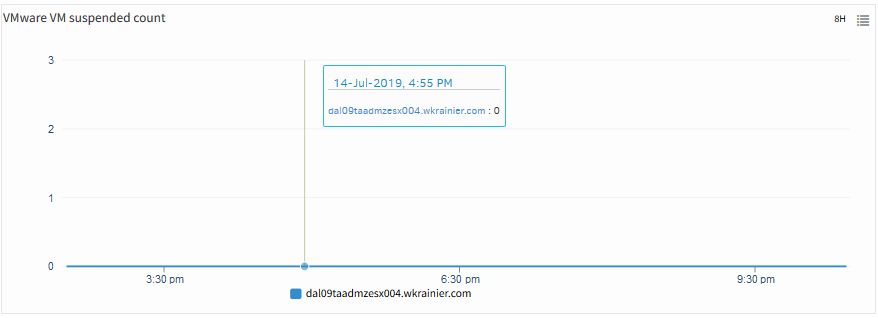
VMware VM suspended count
vmware.vm.poweroff.count
Metric Details
| Applicable for | Device |
| Description | VMware VM poweroff count |
| Category | Vmware |
| Collector Type | Gateway |
| Monitor Name | VMware Host Performance |
| Unit | NULL |
Possible Inputs
| Metric | Input Value | Range of Values |
|---|---|---|
| Frequency | 5 | 1 – 1440 (mins) |
| Filter | NULL | Not Applicable |
| Warning Operator | Manual | Manual |
| Warning Threshold | Manual | Manual |
| Warning Repeat Count | Manual | Manual |
| Critical Operator | Manual | Manual |
| Critical Threshold | Manual | Manual |
| Critical Repeat Count | Manual | Manual |
| Alert | No | Yes/No |
| Graph (Yes/No) | Yes | Yes/No |
Sample Output
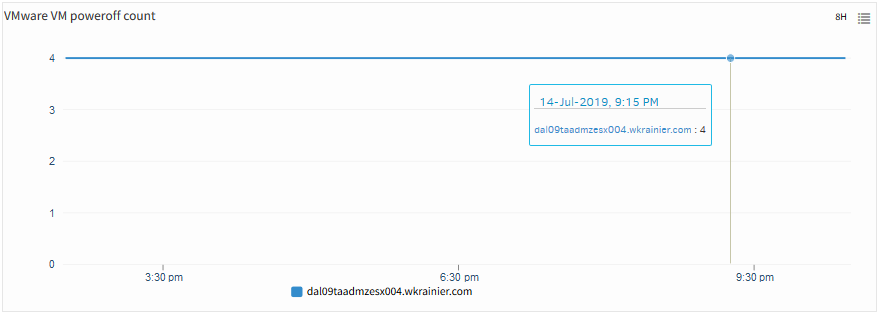
VMware VM poweroff count
vmware.vm.poweron.count
Metric Details
| Applicable for | Device |
| Description | VMware VM poweron count |
| Category | Vmware |
| Collector Type | Gateway |
| Monitor Name | VMware Host Performance |
| Unit | NULL |
Possible Inputs
| Metric | Input Value | Range of Values |
|---|---|---|
| Frequency | 5 | 1 – 1440 (mins) |
| Filter | NULL | Not Applicable |
| Warning Operator | Manual | Manual |
| Warning Threshold | Manual | Manual |
| Warning Repeat Count | Manual | Manual |
| Critical Operator | Manual | Manual |
| Critical Threshold | Manual | Manual |
| Critical Repeat Count | Manual | Manual |
| Alert | No | Yes/No |
| Graph (Yes/No) | Yes | Yes/No |
Sample Output
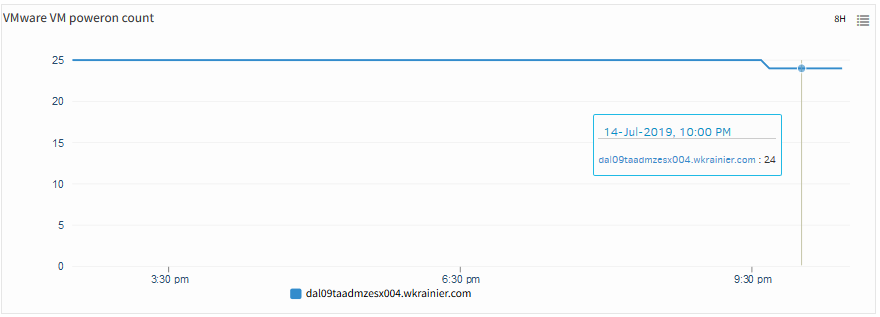
VMware VM poweron count
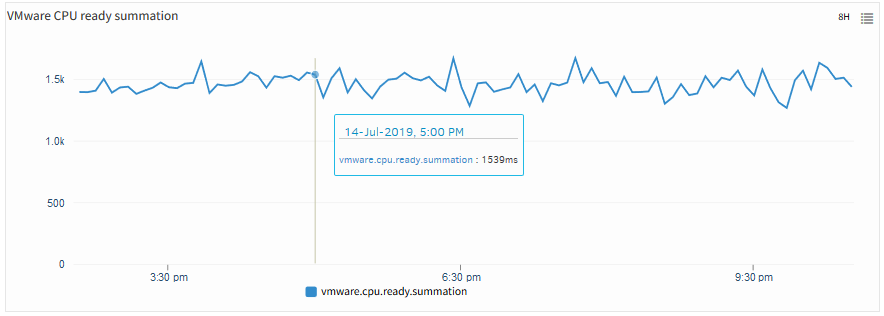
vmware.cpu.ready.summation
Metric Details
| Applicable for | Device |
| Description | Vmware CPU ready |
| Category | Vmware |
| Collector Type | Gateway |
| Monitor Name | VMware Host Performance |
| Unit | ms |
Possible Inputs
| Metric | Input Value | Range of Values |
|---|---|---|
| Frequency | 5 | 1 – 1440 (mins) |
| Filter | NULL | Not Applicable |
| Warning Operator | Manual | Manual |
| Warning Threshold | Manual | Manual |
| Warning Repeat Count | Manual | Manual |
| Critical Operator | Manual | Manual |
| Critical Threshold | Manual | Manual |
| Critical Repeat Count | Manual | Manual |
| Alert | No | Yes/No |
| Graph (Yes/No) | Yes | Yes/No |
Sample Output