Description
This template is used to capture the VMware events present in vCenter.
Prerequisites
Gateway should be up and running. vCenter device should be reachable from Gateway. vCenter device should be in managed state.
How to Apply: This template is All instance selection based. It will not ask user to select any instance (s) while assigning it to a device.
Metric Parameters
| Parameter | Description |
|---|---|
| Frequency | |
| Warning Threshold | If the metric value satisfies the condition defined along with Warning Threshold value, then a notification is sent to the user. |
| Critical Threshold | If the metric value satisfies the condition defined along with Critical Threshold value, then a notification is sent to the user. |
| Alert | The alert value can be set to either Yes or No. If it is Yes, then an alert message is sent to the user. |
Metrics
vmware.vcenter.event.count
Metric Details
| Applicable for | Device |
| Description | vcenter event count |
| Category | Vmware |
| Collector Type | Gateway |
| Monitor Name | VMware vCenter Events |
| Unit | NULL |
Possible Inputs
| Metric | Input Value | Range of Values |
|---|---|---|
| Frequency | 5 | 1 – 1440 (mins) |
| Filter | NULL | Not Applicable |
| Warning Operator | ||
| Warning Threshold | ||
| Warning Repeat Count | ||
| Critical Operator | ||
| Critical Threshold | ||
| Critical Repeat Count | ||
| Alert | No | Yes/No |
| Graph (Yes/No) | Yes | Yes/No |
Sample Output
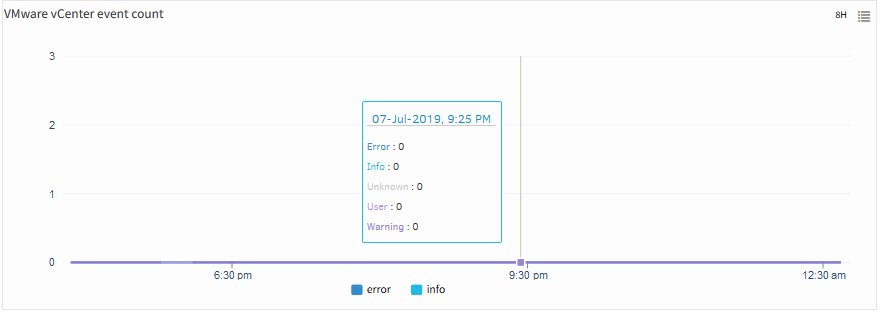
VMware Vcenter event count
com.vmware.vc.HA.HostUnconfiguredWithProtectedVms
Metric Details
| Applicable for | Device |
| Description | A disconnected host has vSphere HA protected VMs |
| Category | Vmware |
| Collector Type | Gateway |
| Monitor Name | VMware vCenter Events |
| Unit | NULL |
Possible Inputs
| Metric | Input Value | Range of Values |
|---|---|---|
| Frequency | 5 | 1 – 1440 (mins) |
| Filter | NULL | Not Applicable |
| Warning Operator | ||
| Warning Threshold | ||
| Warning Repeat Count | ||
| Critical Operator | ||
| Critical Threshold | ||
| Critical Repeat Count | ||
| Alert | Yes | Yes/No |
| Graph (Yes/No) | Yes | Yes/No |
Sample Output
No graph
esx.problem.net.connectivity.lost
Metric Details
| Applicable for | Device |
| Description | Lost Network Connectivity |
| Category | Vmware |
| Collector Type | Gateway |
| Monitor Name | VMware vCenter Events |
| Unit | NULL |
Possible Inputs
| Metric | Input Value | Range of Values |
|---|---|---|
| Frequency | 5 | 1 – 1440 (mins) |
| Filter | NULL | Not Applicable |
| Warning Operator | ||
| Warning Threshold | ||
| Warning Repeat Count | ||
| Critical Operator | ||
| Critical Threshold | ||
| Critical Repeat Count | ||
| Alert | Yes | Yes/No |
| Graph (Yes/No) | Yes | Yes/No |
Sample Output
No graph
esx.problem.net.dvport.connectivity.lost
Metric Details
| Applicable for | Device |
| Description | Lost Network Connectivity to DVPorts |
| Category | Vmware |
| Collector Type | Gateway |
| Monitor Name | VMware vCenter Events |
| Unit | NULL |
Possible Inputs
| Metric | Input Value | Range of Values |
|---|---|---|
| Frequency | 5 | 1 – 1440 (mins) |
| Filter | NULL | Not Applicable |
| Warning Operator | ||
| Warning Threshold | ||
| Warning Repeat Count | ||
| Critical Operator | ||
| Critical Threshold | ||
| Critical Repeat Count | ||
| Alert | Yes | Yes/No |
| Graph (Yes/No) | Yes | Yes/No |
Sample Output
No graph
esx.problem.net.dvport.redundancy.degraded
Metric Details
| Applicable for | Device |
| Description | Network Redundancy Degraded on DVPorts |
| Category | Vmware |
| Collector Type | Gateway |
| Monitor Name | VMware vCenter Events |
| Unit | NULL |
Possible Inputs
| Metric | Input Value | Range of Values |
|---|---|---|
| Frequency | 5 | 1 – 1440 (mins) |
| Filter | NULL | Not Applicable |
| Warning Operator | ||
| Warning Threshold | ||
| Warning Repeat Count | ||
| Critical Operator | ||
| Critical Threshold | ||
| Critical Repeat Count | ||
| Alert | Yes | Yes/No |
| Graph (Yes/No) | Yes | Yes/No |
Sample Output
No graph
esx.problem.net.dvport.redundancy.lost
Metric Details
| Applicable for | Device |
| Description | Lost Network Redundancy on DVPorts |
| Category | Vmware |
| Collector Type | Gateway |
| Monitor Name | VMware vCenter Events |
| Unit | NULL |
Possible Inputs
| Metric | Input Value | Range of Values |
|---|---|---|
| Frequency | 5 | 1 – 1440 (mins) |
| Filter | NULL | Not Applicable |
| Warning Operator | ||
| Warning Threshold | ||
| Warning Repeat Count | ||
| Critical Operator | ||
| Critical Threshold | ||
| Critical Repeat Count | ||
| Alert | Yes | Yes/No |
| Graph (Yes/No) | Yes | Yes/No |
Sample Output
No graph
esx.problem.net.vmnic.linkstate.down
Metric Details
| Applicable for | Device |
| Description | Link state down |
| Category | Vmware |
| Collector Type | Gateway |
| Monitor Name | VMware vCenter Events |
| Unit | NULL |
Possible Inputs
| Metric | Input Value | Range of Values |
|---|---|---|
| Frequency | 5 | 1 – 1440 (mins) |
| Filter | NULL | Not Applicable |
| Warning Operator | ||
| Warning Threshold | ||
| Warning Repeat Count | ||
| Critical Operator | ||
| Critical Threshold | ||
| Critical Repeat Count | ||
| Alert | Yes | Yes/No |
| Graph (Yes/No) | Yes | Yes/No |
Sample Output
No graph
esx.problem.net.vmnic.linkstate.flapping
Metric Details
| Applicable for | Device |
| Description | Link state unstable |
| Category | Vmware |
| Collector Type | Gateway |
| Monitor Name | VMware vCenter Events |
| Unit | NULL |
Possible Inputs
| Metric | Input Value | Range of Values |
|---|---|---|
| Frequency | 5 | 1 – 1440 (mins) |
| Filter | NULL | Not Applicable |
| Warning Operator | ||
| Warning Threshold | ||
| Warning Repeat Count | ||
| Critical Operator | ||
| Critical Threshold | ||
| Critical Repeat Count | ||
| Alert | Yes | Yes/No |
| Graph (Yes/No) | Yes | Yes/No |
Sample Output
No graph
esx.problem.storage.apd.timeout
Metric Details
| Applicable for | Device |
| Description | All Paths Down timed out, I/Os will be fast failed |
| Category | Vmware |
| Collector Type | Gateway |
| Monitor Name | VMware vCenter Events |
| Unit | NULL |
Possible Inputs
| Metric | Input Value | Range of Values |
|---|---|---|
| Frequency | 5 | 1 – 1440 (mins) |
| Filter | NULL | Not Applicable |
| Warning Operator | ||
| Warning Threshold | ||
| Warning Repeat Count | ||
| Critical Operator | ||
| Critical Threshold | ||
| Critical Repeat Count | ||
| Alert | Yes | Yes/No |
| Graph (Yes/No) | Yes | Yes/No |
Sample Output
No graph
esx.problem.storage.connectivity.lost
Metric Details
| Applicable for | Device |
| Description | Lost Storage Connectivity |
| Category | Vmware |
| Collector Type | Gateway |
| Monitor Name | VMware vCenter Events |
| Unit | NULL |
Possible Inputs
| Metric | Input Value | Range of Values |
|---|---|---|
| Frequency | 5 | 1 – 1440 (mins) |
| Filter | NULL | Not Applicable |
| Warning Operator | ||
| Warning Threshold | ||
| Warning Repeat Count | ||
| Critical Operator | ||
| Critical Threshold | ||
| Critical Repeat Count | ||
| Alert | Yes | Yes/No |
| Graph (Yes/No) | Yes | Yes/No |
Sample Output
No graph
com.vmware.vc.HA.HostAgentErrorEvent
Metric Details
| Applicable for | Device |
| Description | vSphere HA agent on a host has an error |
| Category | Vmware |
| Collector Type | Gateway |
| Monitor Name | VMware vCenter Events |
| Unit | NULL |
Possible Inputs
| Metric | Input Value | Range of Values |
|---|---|---|
| Frequency | 5 | 1 – 1440 (mins) |
| Filter | NULL | Not Applicable |
| Warning Operator | ||
| Warning Threshold | ||
| Warning Repeat Count | ||
| Critical Operator | ||
| Critical Threshold | ||
| Critical Repeat Count | ||
| Alert | Yes | Yes/No |
| Graph (Yes/No) | Yes | Yes/No |
Sample Output
No graph
esx.problem.storage.redundancy.degraded
Metric Details
| Applicable for | Device |
| Description | Degraded Storage Path Redundancy |
| Category | Vmware |
| Collector Type | Gateway |
| Monitor Name | VMware vCenter Events |
| Unit | NULL |
Possible Inputs
| Metric | Input Value | Range of Values |
|---|---|---|
| Frequency | 5 | 1 – 1440 (mins) |
| Filter | NULL | Not Applicable |
| Warning Operator | ||
| Warning Threshold | ||
| Warning Repeat Count | ||
| Critical Operator | ||
| Critical Threshold | ||
| Critical Repeat Count | ||
| Alert | Yes | Yes/No |
| Graph (Yes/No) | Yes | Yes/No |
Sample Output
No graph
HostConnectionLostEvent
Metric Details
| Applicable for | Device |
| Description | Host connection lost |
| Category | Vmware |
| Collector Type | Gateway |
| Monitor Name | VMware vCenter Events |
| Unit | NULL |
Possible Inputs
| Metric | Input Value | Range of Values |
|---|---|---|
| Frequency | 5 | 1 – 1440 (mins) |
| Filter | NULL | Not Applicable |
| Warning Operator | ||
| Warning Threshold | ||
| Warning Repeat Count | ||
| Critical Operator | ||
| Critical Threshold | ||
| Critical Repeat Count | ||
| Alert | Yes | Yes/No |
| Graph (Yes/No) | Yes | Yes/No |
Sample Output
No graph
esx.problem.net.redundancy.lost
Metric Details
| Applicable for | Device |
| Description | Lost Network Redundancy |
| Category | Vmware |
| Collector Type | Gateway |
| Monitor Name | VMware vCenter Events |
| Unit | NULL |
Possible Inputs
| Metric | Input Value | Range of Values |
|---|---|---|
| Frequency | 5 | 1 – 1440 (mins) |
| Filter | NULL | Not Applicable |
| Warning Operator | ||
| Warning Threshold | ||
| Warning Repeat Count | ||
| Critical Operator | ||
| Critical Threshold | ||
| Critical Repeat Count | ||
| Alert | Yes | Yes/No |
| Graph (Yes/No) | Yes | Yes/No |
Sample Output
No graph
esx.problem.net.vmknic.ip.duplicate
Metric Details
| Applicable for | Device |
| Description | A duplicate IP address was detected on a vmknic interface |
| Category | Vmware |
| Collector Type | Gateway |
| Monitor Name | VMware vCenter Events |
| Unit | NULL |
Possible Inputs
| Metric | Input Value | Range of Values |
|---|---|---|
| Frequency | 5 | 1 – 1440 (mins) |
| Filter | NULL | Not Applicable |
| Warning Operator | ||
| Warning Threshold | ||
| Warning Repeat Count | ||
| Critical Operator | ||
| Critical Threshold | ||
| Critical Repeat Count | ||
| Alert | Yes | Yes/No |
| Graph (Yes/No) | Yes | Yes/No |
Sample Output
No graph
com.vmware.vcHms.vmMissingReplicationConfigurationEvent
Metric Details
| Applicable for | Device |
| Description | Virtual machine is experiencing problems with vSphere Replication and must be reconfigured |
| Category | Vmware |
| Collector Type | Gateway |
| Monitor Name | VMware vCenter Events |
| Unit | NULL |
Possible Inputs
| Metric | Input Value | Range of Values |
|---|---|---|
| Frequency | 5 | 1 – 1440 (mins) |
| Filter | NULL | Not Applicable |
| Warning Operator | ||
| Warning Threshold | ||
| Warning Repeat Count | ||
| Critical Operator | ||
| Critical Threshold | ||
| Critical Repeat Count | ||
| Alert | Yes | Yes/No |
| Graph (Yes/No) | Yes | Yes/No |
Sample Output
No graph
com.vmware.vcHms.rpoViolatedEvent
Metric Details
| Applicable for | Device |
| Description | Virtual machine vSphere Replication RPO is violated by <x> minutes |
| Category | Vmware |
| Collector Type | Gateway |
| Monitor Name | VMware vCenter Events |
| Unit | NULL |
Possible Inputs
| Metric | Input Value | Range of Values |
|---|---|---|
| Frequency | 5 | 1 – 1440 (mins) |
| Filter | NULL | Not Applicable |
| Warning Operator | ||
| Warning Threshold | ||
| Warning Repeat Count | ||
| Critical Operator | ||
| Critical Threshold | ||
| Critical Repeat Count | ||
| Alert | Yes | Yes/No |
| Graph (Yes/No) | Yes | Yes/No |
Sample Output
No graph
com.vmware.vcHms.remoteSiteDownEvent
Metric Details
| Applicable for | Device |
| Description | Connection to the remote vSphere Replication site <siteName> is down |
| Category | Vmware |
| Collector Type | Gateway |
| Monitor Name | VMware vCenter Events |
| Unit | NULL |
Possible Inputs
| Metric | Input Value | Range of Values |
|---|---|---|
| Frequency | 5 | 1 – 1440 (mins) |
| Filter | NULL | Not Applicable |
| Warning Operator | ||
| Warning Threshold | ||
| Warning Repeat Count | ||
| Critical Operator | ||
| Critical Threshold | ||
| Critical Repeat Count | ||
| Alert | Yes | Yes/No |
| Graph (Yes/No) | Yes | Yes/No |
Sample Output
No graph
com.vmware.vcHms.datastoreInaccessibleEvent
Metric Details
| Applicable for | Device |
| Description | Datastore is not accessible for vSphere Replication Server |
| Category | Vmware |
| Collector Type | Gateway |
| Monitor Name | VMware vCenter Events |
| Unit | NULL |
Possible Inputs
| Metric | Input Value | Range of Values |
|---|---|---|
| Frequency | 5 | 1 – 1440 (mins) |
| Filter | NULL | Not Applicable |
| Warning Operator | ||
| Warning Threshold | ||
| Warning Repeat Count | ||
| Critical Operator | ||
| Critical Threshold | ||
| Critical Repeat Count | ||
| Alert | Yes | Yes/No |
| Graph (Yes/No) | Yes | Yes/No |
Sample Output
No graph
com.vmware.vcHms.failedResolvingStoragePolicyEvent
Metric Details
| Applicable for | Device |
| Description | Failed to resolve a specific storage policy for the provided storage profile ID <profile ID> and datastore with managed object ID <Moid> |
| Category | Vmware |
| Collector Type | Gateway |
| Monitor Name | VMware vCenter Events |
| Unit | NULL |
Possible Inputs
| Metric | Input Value | Range of Values |
|---|---|---|
| Frequency | 5 | 1 – 1440 (mins) |
| Filter | NULL | Not Applicable |
| Warning Operator | ||
| Warning Threshold | ||
| Warning Repeat Count | ||
| Critical Operator | ||
| Critical Threshold | ||
| Critical Repeat Count | ||
| Alert | Yes | Yes/No |
| Graph (Yes/No) | Yes | Yes/No |
Sample Output
No graph
hbr.primary.SystemPausedReplication
Metric Details
| Applicable for | Device |
| Description | vSphere Replication was paused as a result of a configuration change, such as a disk being added or reverting to a snapshot where disk states are different |
| Category | Vmware |
| Collector Type | Gateway |
| Monitor Name | VMware vCenter Events |
| Unit | NULL |
Possible Inputs
| Metric | Input Value | Range of Values |
|---|---|---|
| Frequency | 5 | 1 – 1440 (mins) |
| Filter | NULL | Not Applicable |
| Warning Operator | ||
| Warning Threshold | ||
| Warning Repeat Count | ||
| Critical Operator | ||
| Critical Threshold | ||
| Critical Repeat Count | ||
| Alert | Yes | Yes/No |
| Graph (Yes/No) | Yes | Yes/No |
Sample Output
No graph
hbr.primary.InvalidVmReplicationConfigurationEvent
Metric Details
| Applicable for | Device |
| Description | Invalid vSphere Replication configuration |
| Category | Vmware |
| Collector Type | Gateway |
| Monitor Name | VMware vCenter Events |
| Unit | NULL |
Possible Inputs
| Metric | Input Value | Range of Values |
|---|---|---|
| Frequency | 5 | 1 – 1440 (mins) |
| Filter | NULL | Not Applicable |
| Warning Operator | ||
| Warning Threshold | ||
| Warning Repeat Count | ||
| Critical Operator | ||
| Critical Threshold | ||
| Critical Repeat Count | ||
| Alert | Yes | Yes/No |
| Graph (Yes/No) | Yes | Yes/No |
Sample Output
No graph
hbr.primary.FailedToStartDeltaEvent
Metric Details
| Applicable for | Device |
| Description | Sync failed to startn |
| Category | Vmware |
| Collector Type | Gateway |
| Monitor Name | VMware vCenter Events |
| Unit | NULL |
Possible Inputs
| Metric | Input Value | Range of Values |
|---|---|---|
| Frequency | 5 | 1 – 1440 (mins) |
| Filter | NULL | Not Applicable |
| Warning Operator | ||
| Warning Threshold | ||
| Warning Repeat Count | ||
| Critical Operator | ||
| Critical Threshold | ||
| Critical Repeat Count | ||
| Alert | Yes | Yes/No |
| Graph (Yes/No) | Yes | Yes/No |
Sample Output
No graph
hbr.primary.FailedToStartSyncEvent
Metric Details
| Applicable for | Device |
| Description | Sync failed to start |
| Category | Vmware |
| Collector Type | Gateway |
| Monitor Name | VMware vCenter Events |
| Unit | NULL |
Possible Inputs
| Metric | Input Value | Range of Values |
|---|---|---|
| Frequency | 5 | 1 – 1440 (mins) |
| Filter | NULL | Not Applicable |
| Warning Operator | ||
| Warning Threshold | ||
| Warning Repeat Count | ||
| Critical Operator | ||
| Critical Threshold | ||
| Critical Repeat Count | ||
| Alert | Yes | Yes/No |
| Graph (Yes/No) | Yes | Yes/No |
Sample Output
No graph