Description
This template is used to capture the VMware VirtualMachine Performance metrics present in vCenter.
Prerequisites
Gateway should be up and running. vCenter device should be reachable from Gateway. vCenter device should be in managed state.
How to Apply: This template is All instance selection based. It will not ask user to select any instance (s) while assigning it to a device.
Metric Parameters
| Parameter | Description |
|---|---|
| Frequency | |
| Warning Threshold | If the metric value satisfies the condition defined along with Warning Threshold value, then a notification is sent to the user. |
| Critical Threshold | If the metric value satisfies the condition defined along with Critical Threshold value, then a notification is sent to the user. |
| Alert | The alert value can be set to either Yes or No. If it is Yes, then an alert message is sent to the user. |
Metrics
vmware.net.received.average
Metric Details
| Applicable for | Device |
| Description | It defines average of network packets received |
| Category | Vmware |
| Collector Type | Gateway |
| Monitor Name | VMware VirtualMachine Performance |
| Unit | KBps |
Possible Inputs
| Metric | Input Value | Range of Values |
|---|---|---|
| Frequency | 5 | 1 – 1440 (mins) |
| Filter | NULL | Not Applicable |
| Warning Operator | ||
| Warning Threshold | ||
| Warning Repeat Count | ||
| Critical Operator | ||
| Critical Threshold | ||
| Critical Repeat Count | ||
| Alert | No | Yes/No |
| Graph (Yes/No) | Yes | Yes/No |
Sample Output
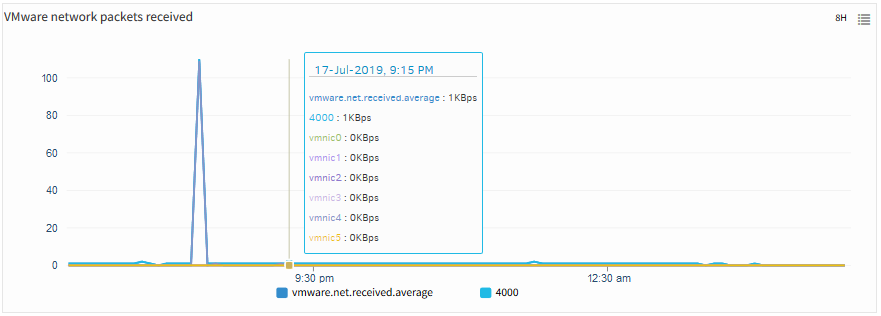
VMware network packets received
vmware.net.transmitted.average
Metric Details
| Applicable for | Device |
| Description | It defines average of network packets transmitted |
| Category | Vmware |
| Collector Type | Gateway |
| Monitor Name | VMware VirtualMachine Performance |
| Unit | KBps |
Possible Inputs
| Metric | Input Value | Range of Values |
|---|---|---|
| Frequency | 5 | 1 – 1440 (mins) |
| Filter | NULL | Not Applicable |
| Warning Operator | ||
| Warning Threshold | ||
| Warning Repeat Count | ||
| Critical Operator | ||
| Critical Threshold | ||
| Critical Repeat Count | ||
| Alert | No | Yes/No |
| Graph (Yes/No) | Yes | Yes/No |
Sample Output
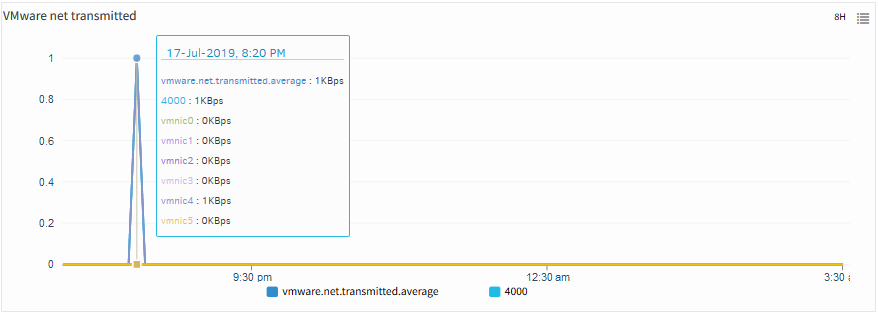
VMware net transmitted
vmware.net.usage.average
Metric Details
| Applicable for | Device |
| Description | It defines average of network packets usage |
| Category | Vmware |
| Collector Type | Gateway |
| Monitor Name | VMware VirtualMachine Performance |
| Unit | KBps |
Possible Inputs
| Metric | Input Value | Range of Values |
|---|---|---|
| Frequency | 5 | 1 – 1440 (mins) |
| Filter | NULL | Not Applicable |
| Warning Operator | ||
| Warning Threshold | ||
| Warning Repeat Count | ||
| Critical Operator | ||
| Critical Threshold | ||
| Critical Repeat Count | ||
| Alert | No | Yes/No |
| Graph (Yes/No) | Yes | Yes/No |
Sample Output
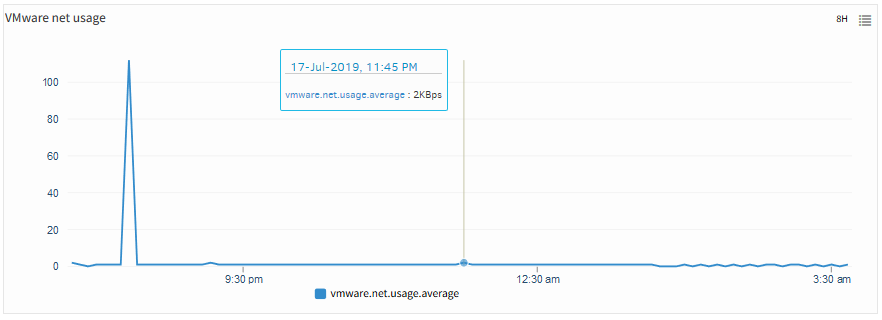
VMware net usage
vmware.mem.usage.average
Metric Details
| Applicable for | Device |
| Description | It defines average of memory usage |
| Category | Vmware |
| Collector Type | Gateway |
| Monitor Name | VMware VirtualMachine Performance |
| Unit | % |
Possible Inputs
| Metric | Input Value | Range of Values |
|---|---|---|
| Frequency | 5 | 1 – 1440 (mins) |
| Filter | NULL | Not Applicable |
| Warning Operator | ||
| Warning Threshold | ||
| Warning Repeat Count | ||
| Critical Operator | ||
| Critical Threshold | ||
| Critical Repeat Count | ||
| Alert | Yes | Yes/No |
| Graph (Yes/No) | Yes | Yes/No |
Sample Output
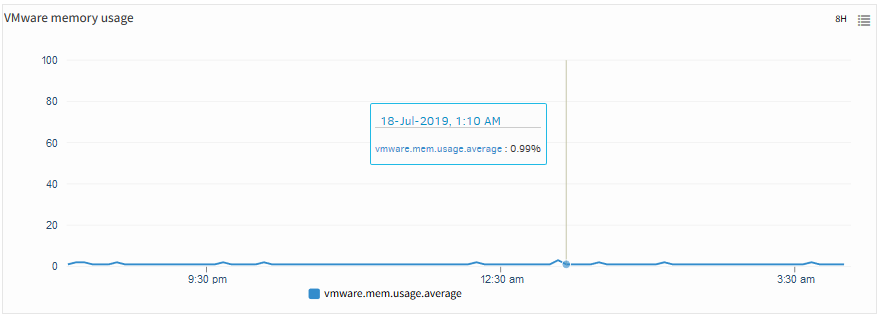
VMware memory usage
vmware.mem.consumed.average
Metric Details
| Applicable for | Device |
| Description | It defines average of memory consumed |
| Category | Vmware |
| Collector Type | Gateway |
| Monitor Name | VMware VirtualMachine Performance |
| Unit | GB |
Possible Inputs
| Metric | Input Value | Range of Values |
|---|---|---|
| Frequency | 5 | 1 – 1440 (mins) |
| Filter | NULL | Not Applicable |
| Warning Operator | ||
| Warning Threshold | ||
| Warning Repeat Count | ||
| Critical Operator | ||
| Critical Threshold | ||
| Critical Repeat Count | ||
| Alert | No | Yes/No |
| Graph (Yes/No) | Yes | Yes/No |
Sample Output
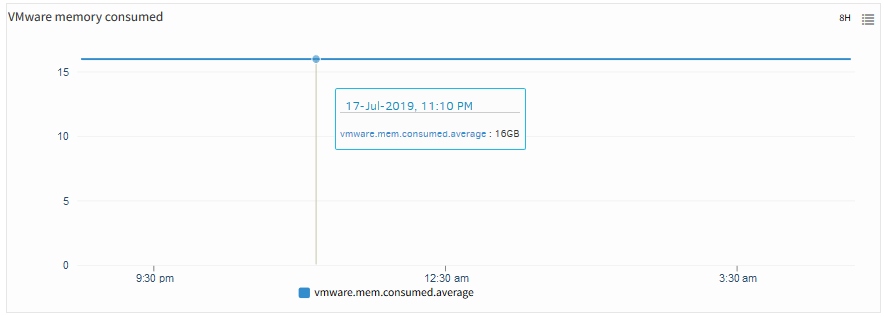
VMware memory consumed
vmware.mem.granted.average
Metric Details
| Applicable for | Device |
| Description | It defines average of memory granted |
| Category | Vmware |
| Collector Type | Gateway |
| Monitor Name | VMware VirtualMachine Performance |
| Unit | KB |
Possible Inputs
| Metric | Input Value | Range of Values |
|---|---|---|
| Frequency | 5 | 1 – 1440 (mins) |
| Filter | NULL | Not Applicable |
| Warning Operator | ||
| Warning Threshold | ||
| Warning Repeat Count | ||
| Critical Operator | ||
| Critical Threshold | ||
| Critical Repeat Count | ||
| Alert | No | Yes/No |
| Graph (Yes/No) | Yes | Yes/No |
Sample Output
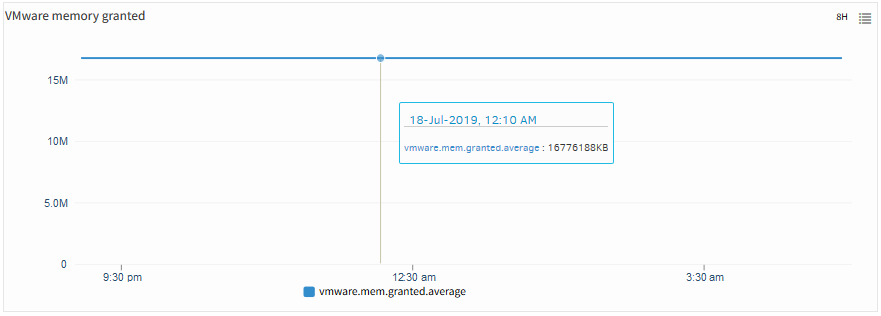
VMware memory granted
vmware.mem.active.average
Metric Details
| Applicable for | Device |
| Description | It defines average of active memory |
| Category | Vmware |
| Collector Type | Gateway |
| Monitor Name | VMware VirtualMachine Performance |
| Unit | KB |
Possible Inputs
| Metric | Input Value | Range of Values |
|---|---|---|
| Frequency | 5 | 1 – 1440 (mins) |
| Filter | NULL | Not Applicable |
| Warning Operator | ||
| Warning Threshold | ||
| Warning Repeat Count | ||
| Critical Operator | ||
| Critical Threshold | ||
| Critical Repeat Count | ||
| Alert | No | Yes/No |
| Graph (Yes/No) | Yes | Yes/No |
Sample Output
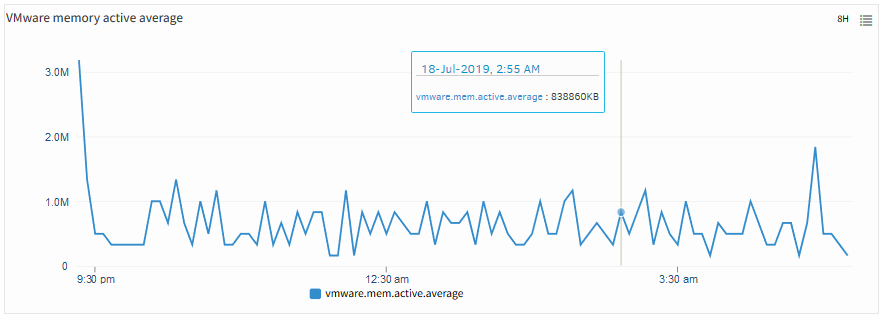
VMware memory active average
vmware.mem.entitlement.average
Metric Details
| Applicable for | Device |
| Description | It defines average of memory entitlement |
| Category | Vmware |
| Collector Type | Gateway |
| Monitor Name | VMware VirtualMachine Performance |
| Unit | KB |
Possible Inputs
| Metric | Input Value | Range of Values |
|---|---|---|
| Frequency | 5 | 1 – 1440 (mins) |
| Filter | NULL | Not Applicable |
| Warning Operator | ||
| Warning Threshold | ||
| Warning Repeat Count | ||
| Critical Operator | ||
| Critical Threshold | ||
| Critical Repeat Count | ||
| Alert | No | Yes/No |
| Graph (Yes/No) | Yes | Yes/No |
Sample Output
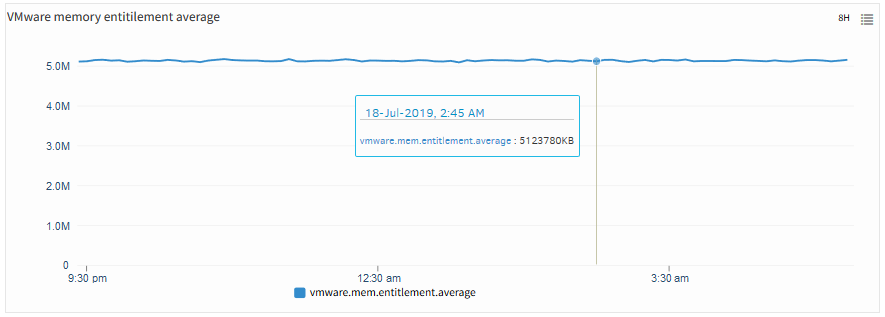
VMware memory entitilement average
vmware.mem.latency.average
Metric Details
| Applicable for | Device |
| Description | It defines average of memory latency |
| Category | Vmware |
| Collector Type | Gateway |
| Monitor Name | VMware VirtualMachine Performance |
| Unit | % |
Possible Inputs
| Metric | Input Value | Range of Values |
|---|---|---|
| Frequency | 5 | 1 – 1440 (mins) |
| Filter | NULL | Not Applicable |
| Warning Operator | ||
| Warning Threshold | ||
| Warning Repeat Count | ||
| Critical Operator | ||
| Critical Threshold | ||
| Critical Repeat Count | ||
| Alert | No | Yes/No |
| Graph (Yes/No) | Yes | Yes/No |
Sample Output
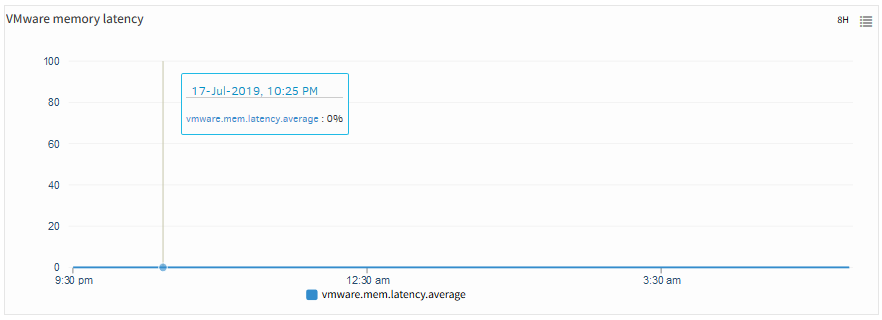
VMware memory latency
vmware.cpu.usage.average
Metric Details
| Applicable for | Device |
| Description | It defines average of CPU usage |
| Category | Vmware |
| Collector Type | Gateway |
| Monitor Name | VMware VirtualMachine Performance |
| Unit | % |
Possible Inputs
| Metric | Input Value | Range of Values |
|---|---|---|
| Frequency | 5 | 1 – 1440 (mins) |
| Filter | NULL | Not Applicable |
| Warning Operator | ||
| Warning Threshold | ||
| Warning Repeat Count | ||
| Critical Operator | ||
| Critical Threshold | ||
| Critical Repeat Count | ||
| Alert | Yes | Yes/No |
| Graph (Yes/No) | Yes | Yes/No |
Sample Output
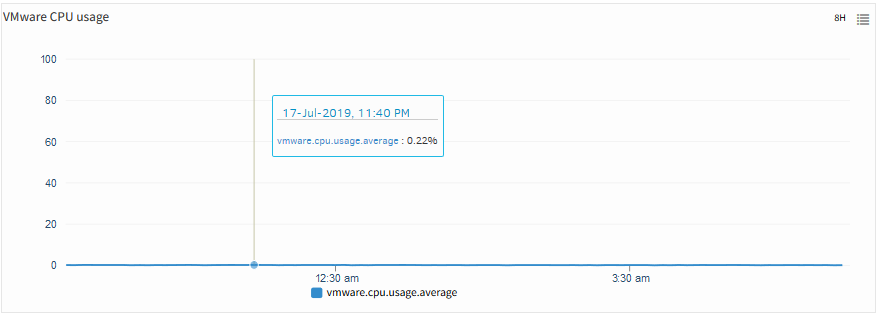
VMware CPU Usage
vmware.cpu.entitlement.latest
Metric Details
| Applicable for | Device |
| Description | CPU resources devoted by the ESX scheduler |
| Category | Vmware |
| Collector Type | Gateway |
| Monitor Name | VMware VirtualMachine Performance |
| Unit | MHz |
Possible Inputs
| Metric | Input Value | Range of Values |
|---|---|---|
| Frequency | 5 | 1 – 1440 (mins) |
| Filter | NULL | Not Applicable |
| Warning Operator | ||
| Warning Threshold | ||
| Warning Repeat Count | ||
| Critical Operator | ||
| Critical Threshold | ||
| Critical Repeat Count | ||
| Alert | No | Yes/No |
| Graph (Yes/No) | Yes | Yes/No |
Sample Output
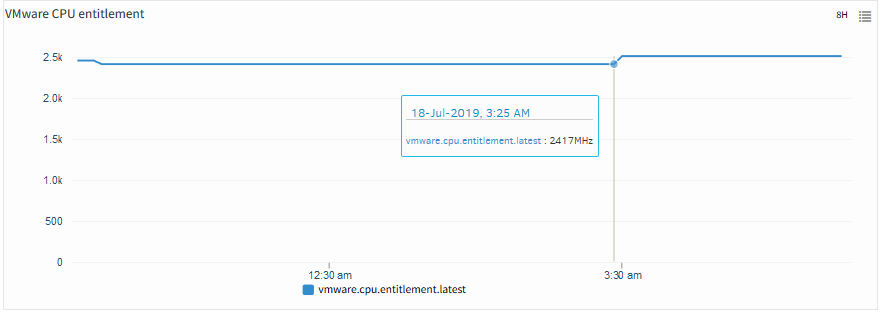
VMware CPU entitlement
vmware.cpu.latency.average
Metric Details
| Applicable for | Device |
| Description | It defines average of Vmware CPU latency |
| Category | Vmware |
| Collector Type | Gateway |
| Monitor Name | VMware VirtualMachine Performance |
| Unit | % |
Possible Inputs
| Metric | Input Value | Range of Values |
|---|---|---|
| Frequency | 5 | 1 – 1440 (mins) |
| Filter | NULL | Not Applicable |
| Warning Operator | ||
| Warning Threshold | ||
| Warning Repeat Count | ||
| Critical Operator | ||
| Critical Threshold | ||
| Critical Repeat Count | ||
| Alert | No | Yes/No |
| Graph (Yes/No) | Yes | Yes/No |
Sample Output
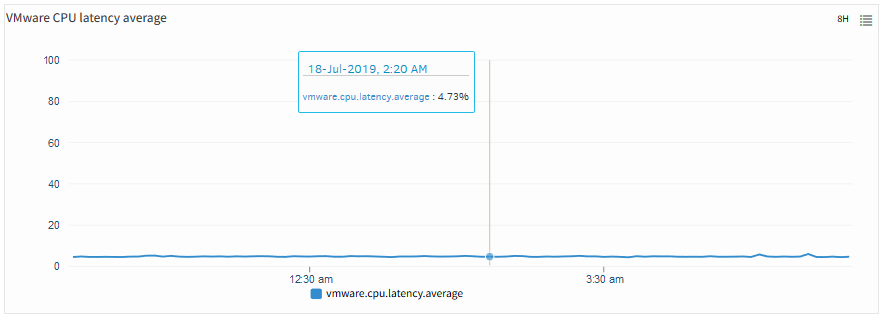
VMware CPU latency average
vmware.cpu.maxlimited.summation
Metric Details
| Applicable for | Device |
| Description | It defines VMware CPU max limited summation |
| Category | Vmware |
| Collector Type | Gateway |
| Monitor Name | VMware VirtualMachine Performance |
| Unit | ms |
Possible Inputs
| Metric | Input Value | Range of Values |
|---|---|---|
| Frequency | 5 | 1 – 1440 (mins) |
| Filter | NULL | Not Applicable |
| Warning Operator | ||
| Warning Threshold | ||
| Warning Repeat Count | ||
| Critical Operator | ||
| Critical Threshold | ||
| Critical Repeat Count | ||
| Alert | No | Yes/No |
| Graph (Yes/No) | Yes | Yes/No |
Sample Output
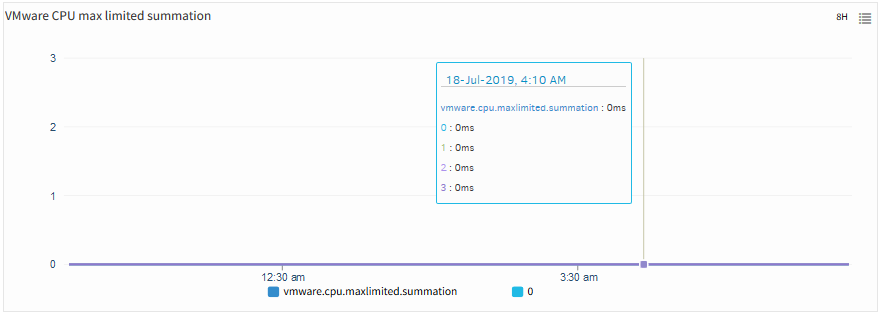
VMware CPU max limited summation
vmware.cpu.ready.summation
Metric Details
| Applicable for | Device |
| Description | It defines CPU ready summation |
| Category | Vmware |
| Collector Type | Gateway |
| Monitor Name | VMware VirtualMachine Performance |
| Unit | ms |
Possible Inputs
| Metric | Input Value | Range of Values |
|---|---|---|
| Frequency | 5 | 1 – 1440 (mins) |
| Filter | NULL | Not Applicable |
| Warning Operator | ||
| Warning Threshold | ||
| Warning Repeat Count | ||
| Critical Operator | ||
| Critical Threshold | ||
| Critical Repeat Count | ||
| Alert | No | Yes/No |
| Graph (Yes/No) | Yes | Yes/No |
Sample Output
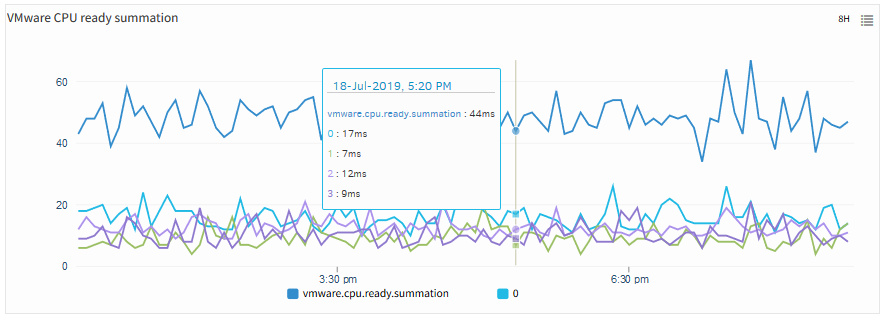
VMware CPU ready summation
vmware.cpu.capacity.demand.average
Metric Details
| Applicable for | Device |
| Description | It defines average of VMware CPU capacity demand |
| Category | Vmware |
| Collector Type | Gateway |
| Monitor Name | VMware VirtualMachine Performance |
| Unit | MHz |
Possible Inputs
| Metric | Input Value | Range of Values |
|---|---|---|
| Frequency | 5 | 1 – 1440 (mins) |
| Filter | NULL | Not Applicable |
| Warning Operator | ||
| Warning Threshold | ||
| Warning Repeat Count | ||
| Critical Operator | ||
| Critical Threshold | ||
| Critical Repeat Count | ||
| Alert | No | Yes/No |
| Graph (Yes/No) | Yes | Yes/No |
Sample Output
No graph
vmware.cpu.costop.summation
Metric Details
| Applicable for | Device |
| Description | It defines CPU Co-stop summation |
| Category | Vmware |
| Collector Type | Gateway |
| Monitor Name | VMware VirtualMachine Performance |
| Unit | ms |
Possible Inputs
| Metric | Input Value | Range of Values |
|---|---|---|
| Frequency | 5 | 1 – 1440 (mins) |
| Filter | NULL | Not Applicable |
| Warning Operator | ||
| Warning Threshold | ||
| Warning Repeat Count | ||
| Critical Operator | ||
| Critical Threshold | ||
| Critical Repeat Count | ||
| Alert | No | Yes/No |
| Graph (Yes/No) | Yes | Yes/No |
Sample Output
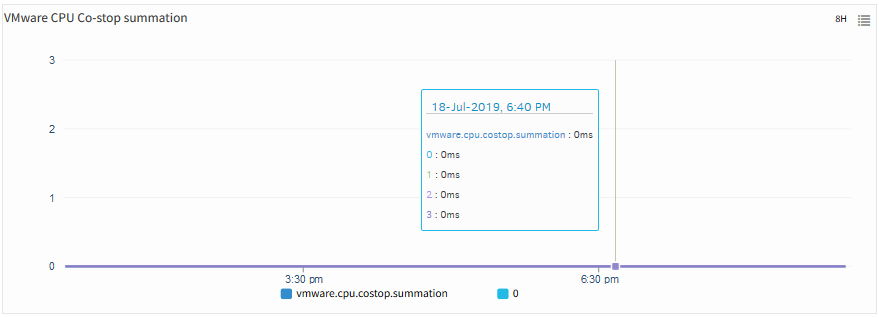
VMware CPU Co-stop summation
vmware.virtualDisk.totalReadLatency.average
Metric Details
| Applicable for | Device |
| Description | It defines average of Virtual disk total read latency |
| Category | Vmware |
| Collector Type | Gateway |
| Monitor Name | VMware VirtualMachine Performance |
| Unit | ms |
Possible Inputs
| Metric | Input Value | Range of Values |
|---|---|---|
| Frequency | 5 | 1 – 1440 (mins) |
| Filter | NULL | Not Applicable |
| Warning Operator | ||
| Warning Threshold | ||
| Warning Repeat Count | ||
| Critical Operator | ||
| Critical Threshold | ||
| Critical Repeat Count | ||
| Alert | No | Yes/No |
| Graph (Yes/No) | Yes | Yes/No |
Sample Output
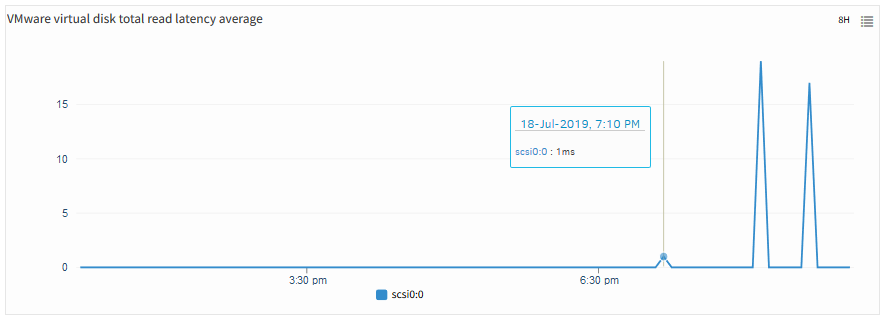
VVMware virtual disk total read latency average
vmware.virtualDisk.totalWriteLatency.average
Metric Details
| Applicable for | Device |
| Description | It defines average of Virtual disk total write latency |
| Category | Vmware |
| Collector Type | Gateway |
| Monitor Name | VMware VirtualMachine Performance |
| Unit | ms |
Possible Inputs
| Metric | Input Value | Range of Values |
|---|---|---|
| Frequency | 5 | 1 – 1440 (mins) |
| Filter | NULL | Not Applicable |
| Warning Operator | ||
| Warning Threshold | ||
| Warning Repeat Count | ||
| Critical Operator | ||
| Critical Threshold | ||
| Critical Repeat Count | ||
| Alert | No | Yes/No |
| Graph (Yes/No) | Yes | Yes/No |
Sample Output
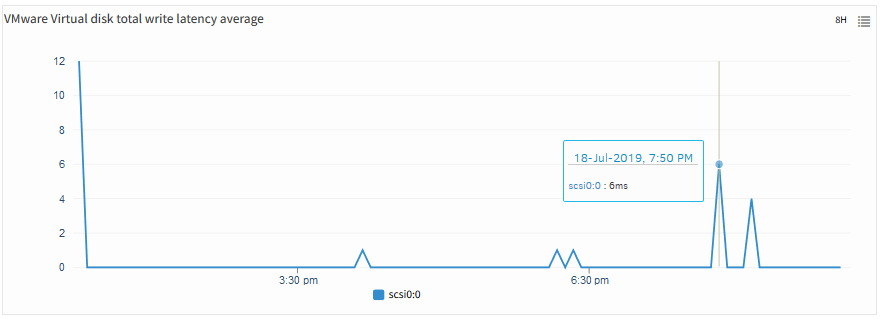
VMware virtual disk total write latency average
vmware.virtualDisk.numberReadAveraged.average
Metric Details
| Applicable for | Device |
| Description | It defines average of Virtual Disk number read |
| Category | Vmware |
| Collector Type | Gateway |
| Monitor Name | VMware VirtualMachine Performance |
| Unit | NULL |
Possible Inputs
| Metric | Input Value | Range of Values |
|---|---|---|
| Frequency | 5 | 1 – 1440 (mins) |
| Filter | NULL | Not Applicable |
| Warning Operator | ||
| Warning Threshold | ||
| Warning Repeat Count | ||
| Critical Operator | ||
| Critical Threshold | ||
| Critical Repeat Count | ||
| Alert | No | Yes/No |
| Graph (Yes/No) | Yes | Yes/No |
Sample Output
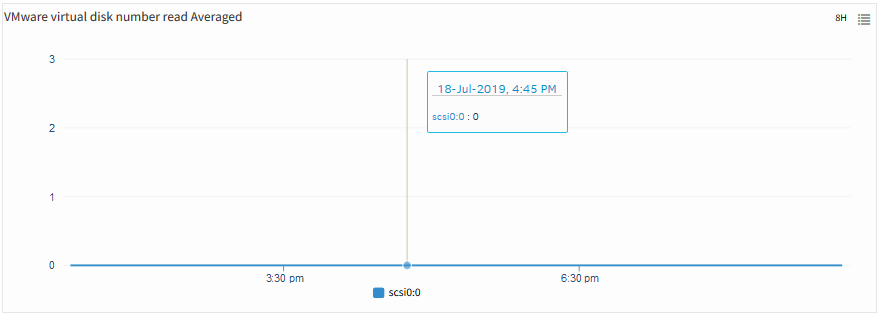
VMware virtual disk number read averaged
vmware.virtualDisk.numberWriteAveraged.average
Metric Details
| Applicable for | Device |
| Description | It defines average of Virtual Disk number write |
| Category | Vmware |
| Collector Type | Gateway |
| Monitor Name | VMware VirtualMachine Performance |
| Unit | NULL |
Possible Inputs
| Metric | Input Value | Range of Values |
|---|---|---|
| Frequency | 5 | 1 – 1440 (mins) |
| Filter | NULL | Not Applicable |
| Warning Operator | ||
| Warning Threshold | ||
| Warning Repeat Count | ||
| Critical Operator | ||
| Critical Threshold | ||
| Critical Repeat Count | ||
| Alert | No | Yes/No |
| Graph (Yes/No) | Yes | Yes/No |
Sample Output
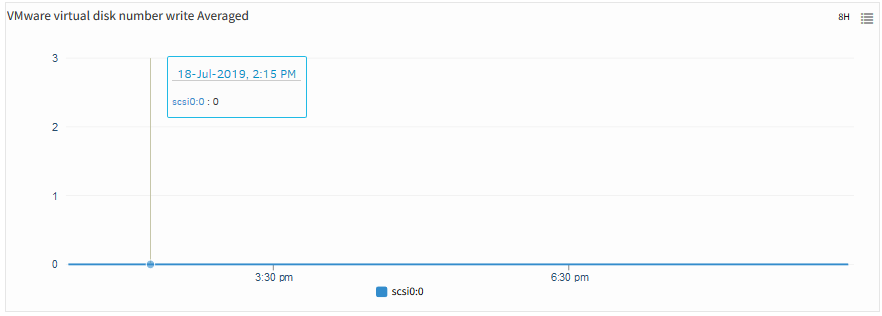
VMware virtual disk number write averaged
vmware.vm.cpu.demandToEntitlementRatio
Metric Details
| Applicable for | Device |
| Description | It defines VM CPU demand to entitlement ratio |
| Category | Vmware |
| Collector Type | Gateway |
| Monitor Name | VMware VirtualMachine Performance |
| Unit | % |
Possible Inputs
| Metric | Input Value | Range of Values |
|---|---|---|
| Frequency | 5 | 1 – 1440 (mins) |
| Filter | NULL | Not Applicable |
| Warning Operator | ||
| Warning Threshold | ||
| Warning Repeat Count | ||
| Critical Operator | ||
| Critical Threshold | ||
| Critical Repeat Count | ||
| Alert | No | Yes/No |
| Graph (Yes/No) | Yes | Yes/No |
Sample Output
No graph