Introduction
A customized hybrid visibility dashboard is provided for analyzing the performance of your infrastructure.
OpsRamp lets you create new dashboards and set them as default (for a specific client or for all clients). You can also share dashboards with other clients in your organization or with role-based users and display them in the desired manner. You can perform other multiple actions on your Dashboard.
Note
Users with any role can create, modify, or share dashboardsThe dashboard displays output from multiple widgets that you can select from a wide variety. You can configure these widgets according to your preferences, display, and chart styles. You can also resize and move these widgets within the grid. For more information, view Widgets
Dashboard process flow
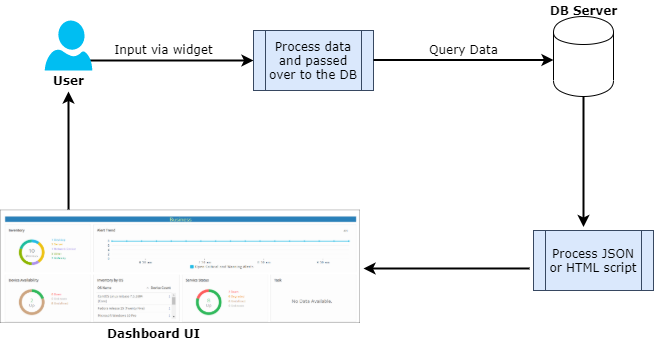
Dashboard Process Flow
Dashboard types
The following dashboards are available:
- Partner Dashboard: Default dashboard where the partner administrator is the owner of the dashboard. A partner dashboard is available to all. The partner administrator has permission to change the default dashboard to another one.
- Client Dashboard: Default dashboard where the client administrator is the owner of the dashboard. A client dashboard is available only to a specific client. A client user can save a Partner Dashboard and turn as the owner of the Dashboard. These dashboards appear as the private dashboard of the client user.
Variables and templates
By using variables, dashboards can be reused with the same widgets but with different resource category values. Individual widgets do not need to be edited.
- Variables can be defined and assigned in applicable dashboard widgets for values associated
with the following resource group categories:
- Device Group
- Service Group
- Site
- Kubernetes
- Docker
- Built-in templates are provided for Kubernetes and Docker resource groups.
Display options
- Refresh: Reloads, updates the data displayed in your Dashboard. Forces a dashboard refresh.
- Full Screen: Presents the dashboard and widgets in a full-screen mode.
- Zoom-In/Out: Decreases and increases the magnification of the dashboard widgets.
- Select Duration: Sets the time-period range for viewing resource performance and availability information.