Introduction
Syslog monitoring helps system administrators monitor the health status of applications or resource using Syslog messages.
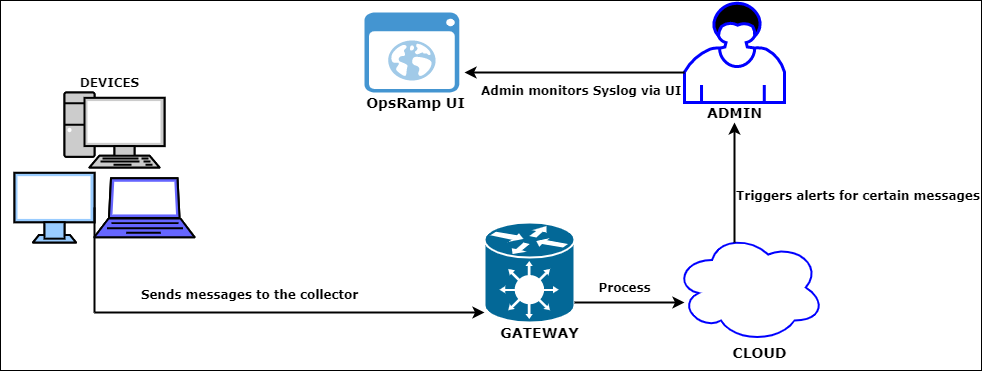
A Syslog is a daemon process that runs on either Linux or Windows servers. The process sends events and log information to a collector (Syslog server) over an IP network. The gateway gathers and processes the Syslog messages according to a set of rules, translates messages to corresponding alerts, and forwards them to the OpsRamp cloud.
Syslog messages
Syslog messages include specifications that help identify information such as when, where, and how the log was sent. Syslog messages usually include the following details:
- IP Address
- Priority Number
- Timestamp
- Actual log message
- Hostname
- Tag
Example of a Syslog message: <25>1 2020-06-24T12:01:39.625926+05:30 bvrmlpt098 appname - - [timeQuality tzKnown="1" isSynced="1" syncAccuracy="253500"]This is an actual syslog Message
Syslog message description
| Message Part | Value | Information |
|---|---|---|
| PRI | 25 | Facility = 3, Severity = 1 |
| VERSION | 1 | Version 1 |
| TIMESTAMP | 2020-06-24T12:01:39.625926+05:30 | Message created on Wed Jun 24 17:31:39 UTC 2020 |
| HOSTNAME | abcdept098 | Message originated from host "abcdept098" |
| APP-NAME | appname | App-Name: "appname" |
| PROCID | - | Unknown |
| MSGID | - | Unknown |
| STRUCTURED-DATA | [timeQuality tzKnown="1" isSynced="1" syncAccuracy="253500"] | Structured Data |
| MSG | Actual syslog Message | This is an actual syslog Message |
Syslog message format
A Syslog message consists of three parts:
- PRI
- HEADER
- MSG
The PRI data sent via Syslog server help arrange and classify the message using two numeric values:
- Facility
- Severity
Facility
Classifies the message type that generated the Syslog event. The facility value is one of the fifteen predefined values or locally defined values ranging from 16-23.
| Number | Facility Description |
|---|---|
| 0 | Kernel Messages |
| 1 | User-level Messages |
| 2 | Mail System |
| 3 | System Daemons |
| 4 | Security/Authorization Messages |
| 5 | Messages generated by syslogd |
| 6 | Line Printer Subsystem |
| 7 | Network News Subsystem |
| 8 | UUCP Subsystem |
| 9 | Clock Daemon |
| 10 | Security/Authorization Messages |
| 11 | FTP Daemon |
| 12 | NTP Subsystems |
| 13 | Log Audit |
| 14 | Log Alert |
| 15 | Clock Daemon |
| 0-16 | Local Use 0 - 7 |
Severity
Classifies the severity or importance of the messages ranging from 0-7.
| Number | Severity | Description |
|---|---|---|
| 0 | Emergency | System is unusable |
| 1 | Alert | Action must be taken immediately |
| 2 | Critical | Critical conditions |
| 3 | Error | Error conditions |
| 4 | Warning | Warning conditions |
| 5 | Notice | Normal but significant condition |
| 6 | Informational | Informational messages |
| 7 | Debug | Debug-level messages |
The priority value(PRI) provides the facility and severity of the messages generated from a system. Multiply the facility value by eight and add the severity value to the result to calculate the PRI:
{Faclity value * 8} + Severity = PRI
The lower the PRI, the higher the priority.
Advantages of Syslog monitoring
- Increased security
- Easier detection of any issues
- Timely action
- High performance
OpsRamp Syslog monitoring process flow

Syslog Monitoring Process Flow
Syslog monitoring configuration
Syslog monitoring configuration is used to:
- Forward thousands of messages sent from different devices to a daemon exclusively.
- Configure Syslog listeners. This specifies that Syslog messages are received and processed via TCP/UDP from the target resources.
- Define include and exclude list. This pre-processes all incoming messages and optimizes CPU cycles to process rules for all messages.
- Define the set of rules. This provides granular-level filtering for important messages and subsequent alert generation.
Syslog is configured via Setup > Monitoring > Syslog Monitor Configuration and involves:
- Adding a configuration profile
Configuration profiles set the severity and facility of the Syslog messages. Profiles also instruct the Gateway to filter only those messages that match the facility and severity defined by the user. - Adding rules
Rules set alert preferences, Syslog message patterns, and actions. For example, rules can be specified to receive warning alerts for user-level messages and mail system that includes the regex pattern:[(.+)] [(.+)] (.+).
Notes
- The Syslog alerts depend on the chosen severity.
- Syslog alerts do not self-heal and are visible from the Alerts Browser.
Creating Syslog monitoring profiles
The Syslog Monitor Configuration functionality is used to filter messages and then generate alerts from the desired messages. For example, to stop receiving alerts for mail system messages, OpsRamp can be “trained” to not monitor those messages.
Prerequisites
- Syslog server installed in the managed environment.
- Good knowledge of regular expressions.
To create a Syslog monitoring configuration:
- From All Clients, select a client.
- Select Setup > Monitoring > Syslog Monitoring Configuration.
- From the SYSLOG MONITORING CONFIGURATION screen, select one of the following tabs:
- Configuration Profile
- Rules
- To add a profile:
- Click +Add.
- From the Configuration Profile section, provide the following information and click Next:
- Client: Client name.
- Management Profile: List of management profiles configured in Resources > Management Profiles.
- Configuration Name: Name provided for the configuration profile.
- Description: Brief description of the purpose for the profile.
- From the Global Filters section, provide the following information and click Save:
- Severity: Level of intensity of the Syslog messages.
- Facility: Type of messages to monitor (via Syslog) and use to generate alerts.
- Resource Filter: IP range for servers used to monitor and receive messages.
- Rules: Rules that are set to identify the Syslog messages.
- To add a new rule:
- Click +Add.
- From the Rules section, provide the following information and click Submit:
- Scope: Partner or the client-specific rules.
- Name: Rule name.
- Action: Determines how to process the Syslog messages.
- Include: Sends only matching data.
- Exclude: Ignores the matching data and sends the remaining data.
- Regex Pattern: The regular expression pattern that is used to compile and compare with the incoming messages. OpsRamp sends an alert in case of a match.
- Metric Name: Name of the metric. Note: Regular expressions can also be used to specify a metric name. For example, Cisco Emergency Responder.
- Component: Syslog message module. For example, Authentication Failure.
- Alert Subject: Summary content of the alert.
- Alert Description: Brief description of the entities used to generate alerts.
- Alert Severity: Severity of the alerts.
- Tags: User-defined tags used for filtering.
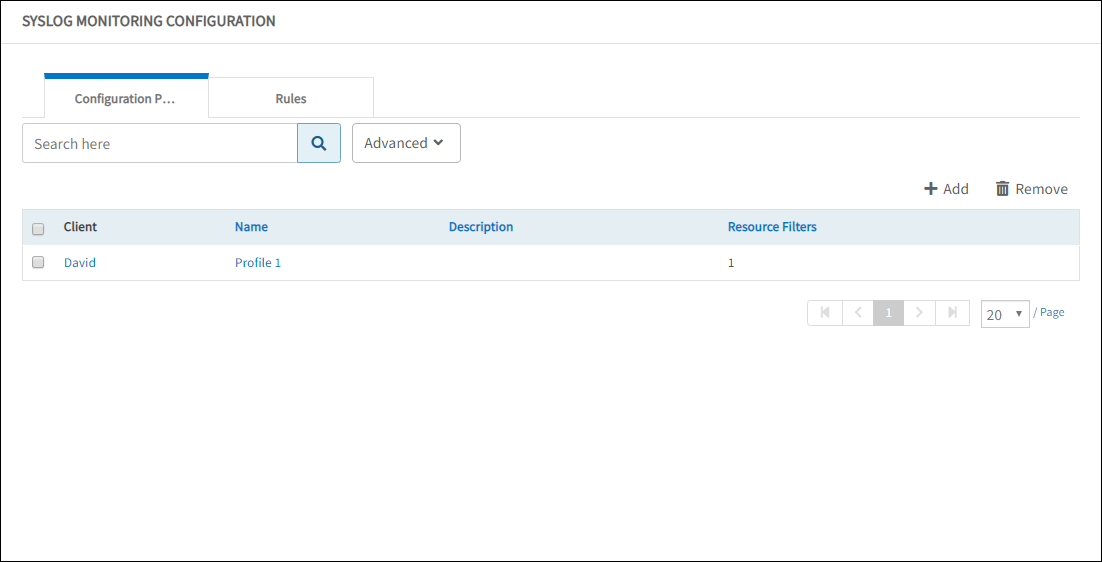
The SYSLOG MONITORING CONFIGURATION screen displays the configured profiles and rules.
The rules displayed in the Rules tab depends on one of the following scopes:
- Service provider rules
- Partner rules
- Client rules
After configuring the rules, you can add configuration profiles for multiple rules using Add > New Configuration Profile from the Rules tab. This facilitates the ease of searching and filtering multiple rules from the Configuration Profiles tab.
Extracting regular expressions dynamically
If there is a Syslog message-rule match, you can dynamically extract groups using regular expressions to generate an Alert Subject, Alert Description, Component, and Metric Name.
For example, from the syslog message: [08:52:18] [ERROR] Ceci doit aparaitre and the regular expression: [(.+)] [(.+)] (.+), the extracted groups are:
- Group 1 = 08:52:18
- Group 2 = ERROR
- Group 3 = Ceci doit aparaitre.
The extracted groups can dynamically generate an Alert Subject, Alert Description, Component, and Metric Name. For example, Severity: ${2}. Syslog raised time ${1} dynamically generate Severity: ERROR. Syslog raised time 08:52:18.
Note
The dynamic replacement is supported only for Alert Subject, Alert Description, Component, and Metric Name.Predefined macros for syslog
${timestamp}- Replaces the timestamp in milliseconds.${received.syslog.message}- Replaces the raw syslog message received from the remote device.
Viewing details
After configuring the Syslog attributes, view the details (such as configuration profile and rules) on the Syslog Monitoring Configuration screen.
Viewing configuration profiles
View profile details in the Syslog Monitoring Configuration > Configuration Profiles tab.
View Configuration Profile
Viewing rules
View rule details in the Syslog Monitoring Configuration > Rules tab.
View Rules
Searching profiles and rules
Searching is available on the Syslog Monitoring Configuration screen. Methods used for searching include:
- Regular search
- Advanced search
- Advanced search - configuration profile
- Advanced search - rules
Search
Use the search option to find a configuration profile and rules using the configuration name and rule name. For searching with criteria, use the Advanced option.
Advanced search
Search results can be filtered by using the advanced search.
Advanced search – configuration profile
To search using additional options:
- Click Advanced.
- From ADVANCED SEARCH window, provide the following information:
- Client
- Configuration Name
- Click Search.
The Configuration Profile screen displays the search results.
Advanced search – rules
To search using additional options:
- Click Advanced.
- From ADVANCED SEARCH, provide the following information:
- Client
- Action
- Tags
- Click Search.
The Rules screen displays the search results.
Deleting profiles and rules
Existing configuration profiles or rules are deleted by using the Remove option. You can also remove Syslog configuration from a single Gateway management profile by removing the management profile from your Syslog configuration.