Introduction
TCP synthetic monitor connects to the target IP address on a given port and monitors the time taken for the connection.
Creating TCP synthetic monitor
After selecting the synthetic monitor type, to configure the TCP synthetic monitor:
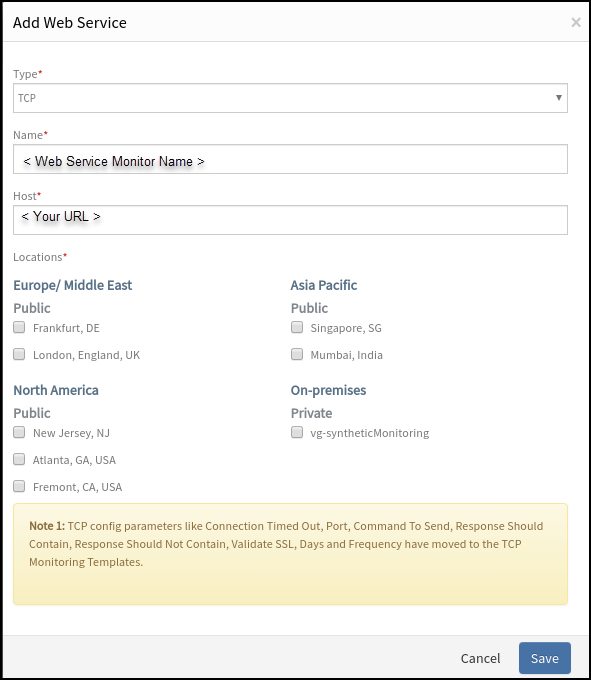
- From the Add Web Service monitor window, provide details for the following parameters and click Save:
- Name: Refers to the name of the Synthetic monitor.
Note: Add Synthetic displays an error message Name Already Exists if you do not provide unique value in Name field. - Host: Refers to the hostname or IP address.
- Locations: Refers to the desired locations from where you want to monitor.
The screen displays a confirmation message about the successful addition of the synthetic monitor.
- Name: Refers to the name of the Synthetic monitor.
- Click OK.
Synthetics page displays the configured synthetic monitor.
Add Synthetic
Warning
The Synthetics page under Infrastructure displays the availability status of the monitor as a red flag if the configured port of the TCP server is not reachable within the configured Connection Timed Out value.To manage a configured synthetic monitor:
- Edit – To modify the existing details of the configured Synthetic monitors.
- Delete – To remove any configured Synthetic monitor.
- Scheduled Maintenance – To move any configured Synthetic monitor to Scheduled Maintenance.
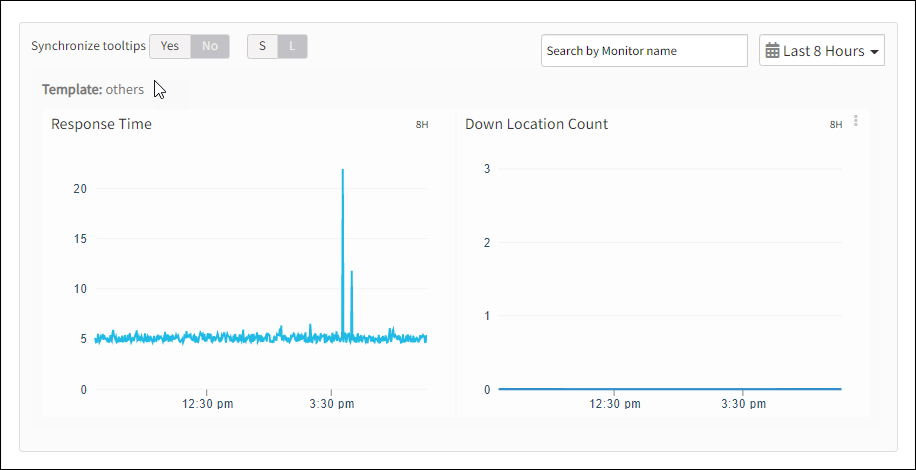
After configuring, view Metrics and graphical representations for additional information.
Metrics for TCP monitor types
| Monitor Types | Units | Recommended Metrics | Description |
|---|---|---|---|
| TCP | - | availability.down.location.count | Location Count: The number of locations where the configured host is down |
| TCP | Milliseconds | synthetic.response.time | Response time: The time taken to connect to the port of the target TCP server |
Graphical representation for metrics