Synthetic graphs not populating on the User Interface (UI).
Synthetic graphs do not populate data in the following scenarios:
Scenario 1: Network breakdown between the Gateway and OpsRamp API server
To check the connection:
- Log into the OpsRamp Gateway.
- Run the command:
curl http://localhost:5481/statsand check the following metrics:- webmon.offline.datapoints
- Webmon.monconf.sync.lapsed.time
The metric value zero indicates that the communication between Gateway and OpsRamp is lost.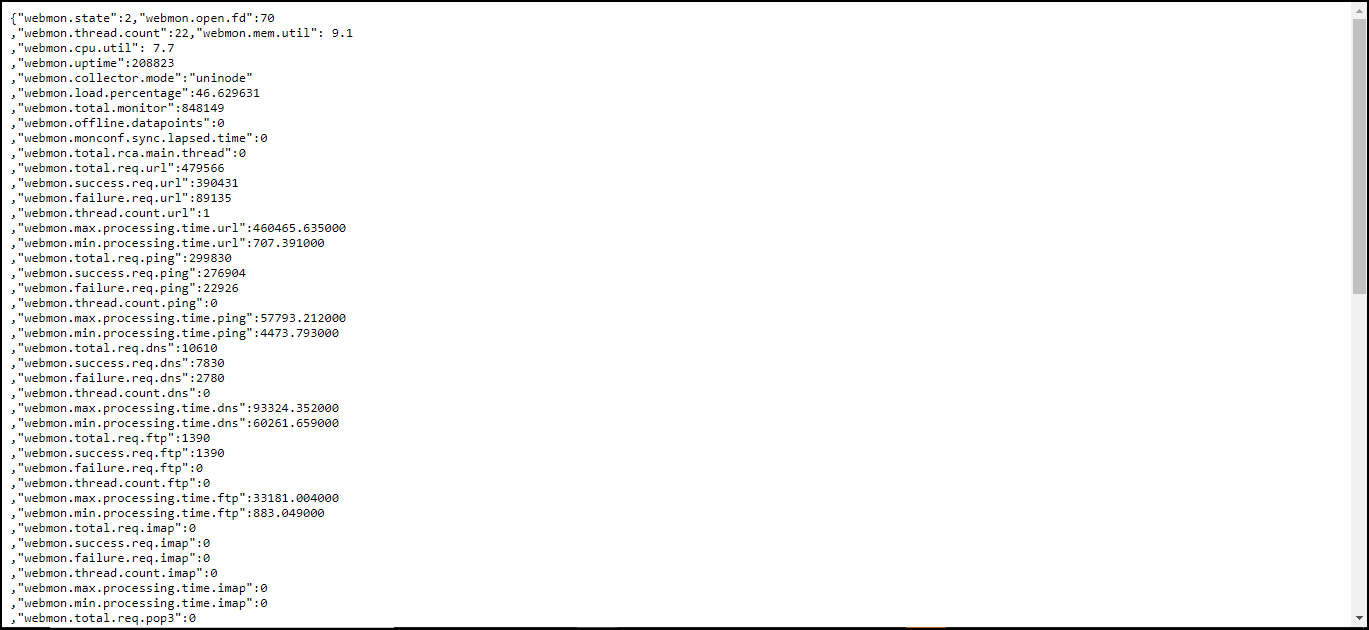
Gateway Connectivity
Scenario 2: Synthetic application: webprobe in Gateway crashed or not running.
To check the network:
- Log into Gateway.
- Run the command:
curl http://localhost:5481/stats.
If the command does not generate a response in less than a minute, then the webprobe is either crashed or not running. Run the command monit restart webprobe to restart the application.
Scenario 3: Gateway is in Read-Only mode or Down.
Check for open alerts in Read-Only mode or in Down state in the Gateway. Contact OpsRamp Support to change the gateway status to UP.
Scenario 4: Delay in synthetic metric data processing on OpsRamp Cloud.
Contact OpsRamp Support to check the synthetic metric data.
Linux commands to validate synthetic monitors
Refer to the following table to validate the synthetic monitor status:
| Protocol | Commands | Example |
|---|---|---|
| HTTP/HTTPS | curl -I -L [url] | curl -I -L www.opsramp.com |
| HTTP/HTTPs with Headers | curl -I -L --header '[header:value]' [URL] | curl -I -L --header 'host:opsramp.com' www.opsramp.com |
| PING | ping [url /IP] | ping www.opsramp.com / ping 127.0.0.1 |
| SSL | curl --insecure -v [URL] 2>&1 | awk 'BEGIN { cert=0 } /^\* Server certificate:/ { cert=1 } /^\*/ { if (cert) print }' | curl --insecure -v https://www.google.com 2>&1 | awk 'BEGIN { cert=0 } /^\* Server certificate:/ { cert=1 } /^\*/ { if (cert) print }' |
| TCP | telnet [host/IP] [port] | telnet www.opsramp.com 80 |
| UDP | telnet [host/IP] [port] | telnet www.opsramp.com 80 |
| DNS | nslookup [host] | nslookup www.opsramp.com |
| SMTP | curl [smtp-server] --mail-from [sender email address] --mail-rcpt [receiver email address] | curl smtp://mail.example.com --mail-from myself@example.com --mail-rcpt receiver@example.com |
| IMAP | curl -v imap://user:password@[imapserver] | curl -v imap://opsramp:password@imap.gmail.com/ |
| POP3 | curl -v pop3://user:password@[pop3 server] | curl -v pop3://opsramp:password@pop3.gmail.com/ |
Check the Response Time and Response Code of a website (HTTP/HTTPS)
To check the response time and response code:
- Log into Gateway.
- Run the command:
time curl -I -L <URL>.
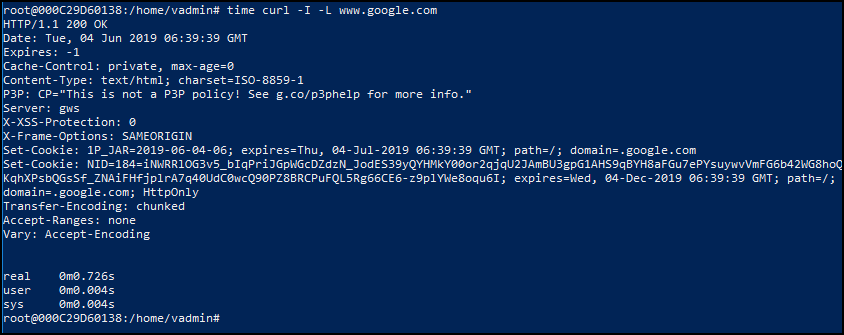
Response Time and Response Code of a Website
False alerts generated in the absence of monitoring issues
To stop the generation of false alerts even in the absence of monitoring issues, set a value greater than or equal to one while configuring component threshold values for availability.down.locations.count. For more information, see Modifying Threshold Values.