Introduction
Performance and availability are two key factors for an end-user. The businesses providing IT services must be aware of their health. An IT administrator or a Site Reliability Engineer (SRE) can continuously evaluate the services in a way the end-users use those and track possible IT operational issues and resolve them proactively.
Synthetic monitoring or active monitoring provides better clarity about the uptime, availability, and response time of the web applications from different geographical locations. Synthetics focus on the state of web applications and end-user performance metrics such as page load time, page performance, and content load time.
Synthetic monitoring helps the administrators to:
- Proactively act on the issues before the end-users are affected.
- Receive an alert when availability surpasses the configured thresholds.
- Get a granular level understanding of each step in a synthetic transaction.
Synthetics support the monitoring of multiple end-point protocols. For example, HTTP/HTTPS, DNS, and SCRIPT-HTTP Synthetic Transaction. The SREs can test the application or business service using synthetic monitors from private and public locations based on thresholds and common paths that simulate end-user flow.
Synthetic monitoring process flow

Synthetic Monitoring Process Flow
Private Locations
Enabling synthetic monitoring from private locations using gateway helps administrators/SREs to track the availability and performance of the internal monitors using the internal network. Administrators can use the same test capabilities to track the availability of the monitors from a public location. To set up a private location, enable Synthetics Agent from Management Profile.
Public Locations
Synthetics support monitoring from ten locations across the globe. Managing monitors from different locations infers receiving performance and availability information of the applications and internet services.
Types of monitors
The different types of monitors available in synthetic monitoring can administer IT operations with proper visibility of the issues in the applications or APIs.
The thirteen types of synthetic monitors that you can run from different private or public locations are:
| Synthetic Monitors | Description |
|---|---|
| HTTP/HTTPS | Graph response time for the website over time. Drill down on recent outages and verify what’s causing the performance degradation. |
| DNS | Track the time taken to resolve the DNS query. |
| FTP | Monitor FTP server. |
| TCP/UDP | Monitor the response time taken to connect to a port of TCP/UDP server. |
| SSL | Replace SSL certificates before the expiration date. |
| PING | Track response time and packet loss for an entire application. |
| POP3/IMAP/SMTP | Monitor email delivery rates. |
| RTT | Monitor the time taken for the email to drive from the SMTP server to IMAP or POP3 server. |
| SCRIPT-HTTP Synthetic Transaction | Monitor user experience, performance and availability issues during any website transaction running on a web browser. |
| SIP | Monitor the availability or performance issues of the user’s VOIP communications. |
Monitoring synthetics from different locations
Using synthetic monitoring, you can verify if the web applications are up and running and detect any fluctuation in the network traffic.
Example
Tim Tools is an IT infrastructure expert for a global start-up e-commerce website based in New York: YourCart.com. A few days after the launch, Tim observed a 53% drop in the number of users accessing the website from New Jersey and Fremont whereas the site is up and running from other locations. Tim finds that the customers do not stay on the website for more than five seconds due to page load issues and it’s frustrating them. This can adversely affect the business resulting in a loss.
How can Tim get the right levels of visibility to understand the key points to improve the user experience and better application performance?
Tim can use synthetic monitoring for the 24*7 monitoring of its services across all locations and getting regular updates. Using the SCRIPT – HTTP Synthetic Transaction Monitor, Tim can create simulations of the possible paths or actions that customers can do on their website. The SCRIPT-HTTP synthetic monitoring technique monitors each path or action at configured intervals to understand the actual user experience and sends alerts for any issue before that could impact the customers.
Using Synthetic monitoring, Tim can monitor internet services from public and private locations. Depending on the requirements, Tim can choose one of the following monitoring environments:
- Monitoring only from public locations.
- Monitoring only from private locations.
- Monitoring from private and public locations.
Visualization
Dashboard
After initiating the monitoring process, go to Infrastructure > Synthetics dashboard to view the health status. The dashboard displays the following:
- The total number and status of the configured synthetic monitors.
- Add, Delete, and Refresh buttons.

Dashboard
Reports
The reports generated to view the synthetic data are as follows:
- Availability report
- Alert report
- Ticket report
- Audit report
Service Maps
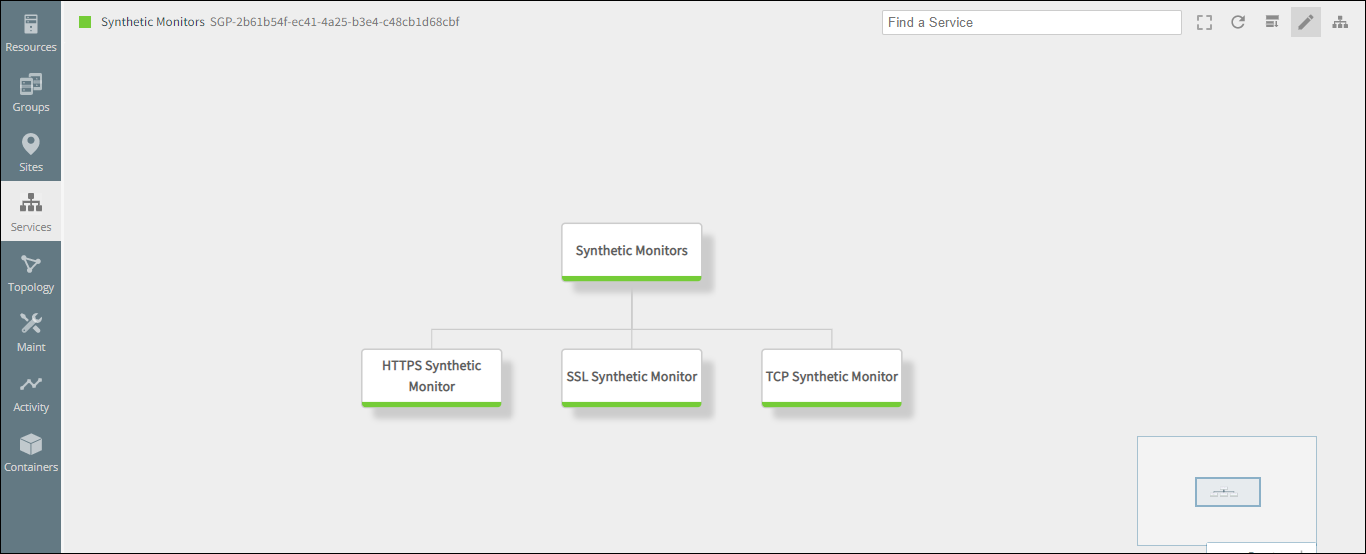
Using Service Maps, the administrators can achieve clear visibility of the synthetic resource and analyze the impact of the resource on a business service. A service map contains nodes and each node represents a group of services or resources. To add resources and services to a node, see Using Service Maps.

Service Maps
Alerts
The alerting process automatically detects the performance issues and sends alerts to the administrators.
Generate alerts
Determine whether to generate alerts while configuring the metric thresholds. For more information, see Alerts in Synthetics.

Generate Alerts
Set notifications
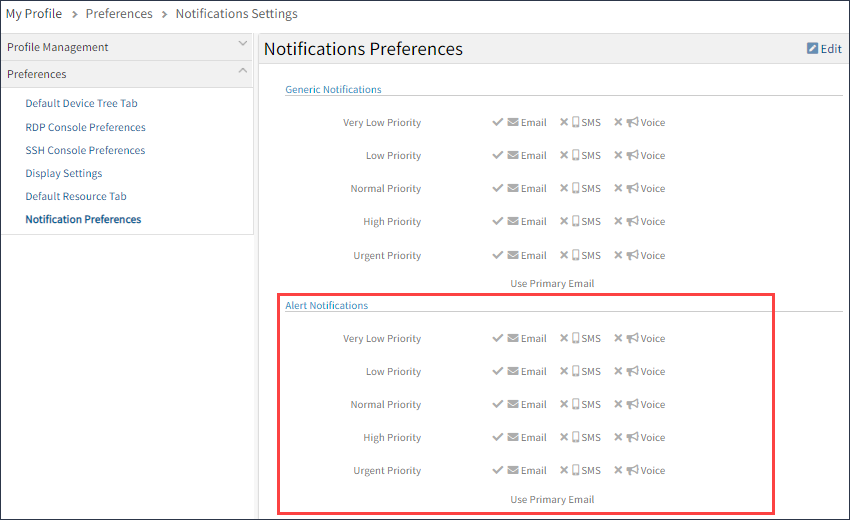
Setting notifications for any alert using email, SMS or voice can notify the administrator about the issue. For more information, see Managing Alert Notifications.
