Introduction
OpsRamp can discover and monitor IT resources running in your data center and public cloud environments. Types of resources that OpsRamp monitors include:
- Applications
- URLs
- Containers
- Servers
- Network devices
- IaaS and PaaS services on the public cloud
Discovery
The goal is discovery is to:
- Find resources that are running in your environment.
- Classify resources by type and attributes. For example: as servers, switches, containers.
- Identify dependencies between resources, that may cause one resource to impact the availability of another. For example: a server that cannot be reached if the network connectivity between the server and switch is lost.
In discovering your environment, OpsRamp builds an model of all the resources in your environment. This model is used by various features of OpsRamp (such dashboards, reports, and event management) to interpret and present the state of your environment.

Discovery Goals
Monitoring
The goal of monitoring is to assess the availability and performance of your managed resources. OpsRamp collects, stores, and interprets metrics to measure availability and performance.
Availability
The availability of a resource indicates whether the resource is up or down. OpsRamp interprets metrics collected from a resource to determine if it available. For example, if a server responds to a ping, then OpsRamp determines that it is available.
Performance
The performance of a resource indicates whether the resource is running well. From OpsRamp standpoint, running well is a user-defined state. Various methods are available to define threshold conditions that measure whether a resource is running well.
Metrics are interpreted based on these thresholds. For example, if you define that sustained memory utilization > 90% on a server means that it is not running well, then OpsRamp monitors for this condition and triggers an event if this condition occurs.
The following types of thresholds are supported:
- Static threshold
- Change-based threshold
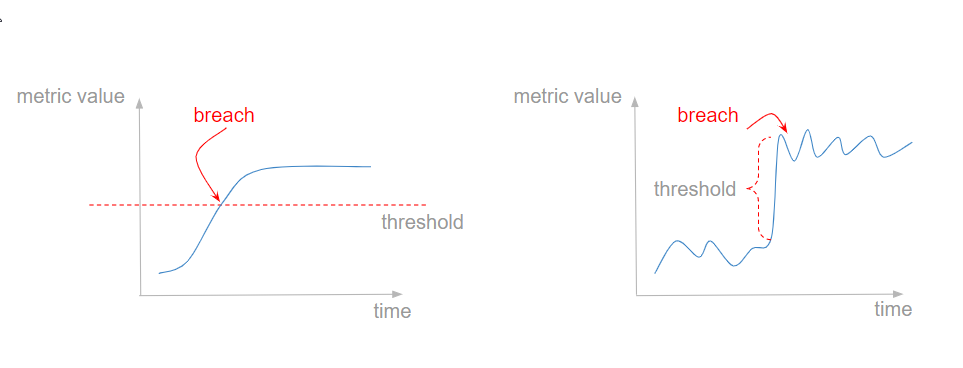
Static threshold
Static threshold is a fixed value which represents a high watermark for a metric. If a metric breaches this value, then this is interpreted as a degraded performance condition. For example, a network ping latency of > 10 ms in a local area network indicates poor network performance. This type of threshold is used widely.
Change based threshold
Change based threshold is a value that OpsRamp automatically computes continuously. This value measures sudden shifts in metric value. This is similar to sudden changes in a moving average where sudden changes may indicate performance degradation.
This type of threshold is suitable for metrics for which static thresholds are difficult to establish. For example, response times for a new web application.
Static and Changed Based Threshold
Current, historical, and predicted states
- Current state is supported with continuous measures of the current availability and performance states of a resource.
- Historical state is supported by building a historical record so that you can analyze trends over time. For example, to see if the availability of an application improved over the last 3 months.
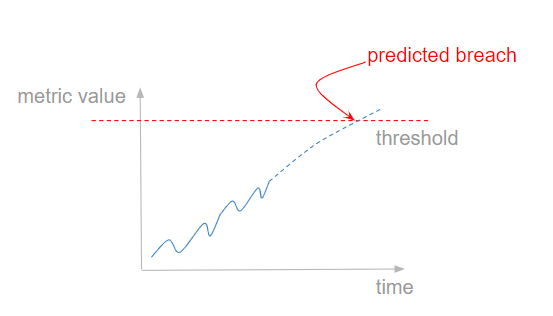
- Predictive state is supported with predictive assessment of a resource’s state. OpsRamp can forecast breach of a static threshold and trigger an event. This predictive assessment is useful for scenarios where you need hours or days of advance warning on a potential breach. For example, warning on disk space is likely to run out in a week.
Static and Changed Based Threshold
Instrumentation
OpsRamp employs the following approaches to discover resources and collect metrics:
- Active polling: OpsRamp instrumentation polls resources on a periodic basis. For example, every 5 minutes.
- Active listening: OpsRamp also ingest events and metrics pushed by external systems through OpsRamp APIs and other methods.
OpsRamp uses a variety of standard and proprietary protocols to discover and monitor your environment. OpsRamp instrumentation that performs such discovery and monitoring comes packaged in these forms:
- OpsRamp Agent: An application that runs within the operating system.
- OpsRamp Gateway: A secure virtual appliance that runs on a hypervisor.
- OpsRamp cloud based collectors: Applications that run in the OpsRamp cloud and collect data from your environment over the internet.
The following table lists common resources and instrumentation that is used to manage instrumentation:
| Resource Type | Instrumentation | Protocols Used |
|---|---|---|
| Applications, Servers | Agent, Gateway | Windows Management Instrumentation (WMI), SSH, application specific APIs |
| Network Switches, Routers | Gateway | Simple Network Management Protocols (SNMP), resource specific APIs |
| URLs | Gateway, Cloud based collectors | Synthetic transactions |
| IaaS and PaaS services on public cloud | Cloud based collectors | Public cloud specific APIs |