Introduction
Events are activities of operational significance that occur within your IT environment. Examples of events include:
- Hardware failure, such as a disk failure
- Server CPU utilization that is near maximum, such as at 90%
- Application failure, such as when a database process stops
- Configuration change on a switch, such as a change in duplex setting
OpsRamp ingests events occurring in your environment from these sources:
- Native instrumentation: OpsRamp native instrumentation triggers events as it monitors your resources. For example, on high memory utilization of a server.
- Self-diagnostic events from managed resources: OpsRamp listens for events generated from IT resources from their own self-diagnostics. For example, SNMP traps in network devices.
- Third-party products: OpsRamp integrates with third-party products to ingest events that they generate from the monitoring that they do. For example, alerts from a log monitoring tool.
OpsRamp event management capabilities are designed with these goals:
- Call your attention only to events that need your response.
- Automatically remediate events that have a well-defined response action.
- Suppress or deduplicate events that are redundant and do not need your response.
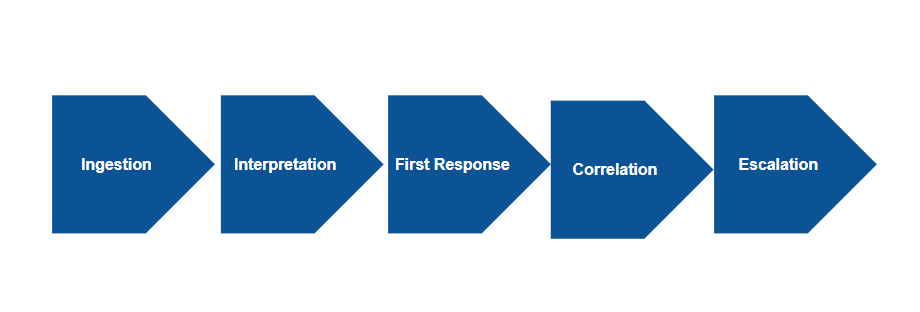
The overarching goal of OpsRamp event management capabilities is to minimize the time that you spend per IT event. OpsRamp event management actions occur in a sequence of steps - the event management lifecycle:
- Ingestion
- Interpretation
- Correlation
- First Response
- Escalation
Event Management Lifecycle
Ingestion
OpsRamp can ingest the following types of event:
- Monitoring events from native instrumentation in the OpsRamp Agent and Gateway.
- Events from public cloud environments collected by OpsRamp cloud based collectors.
- Events sent through a webhook or OpsRamp APIs from third-party products or external tools.
- SNMP traps from network devices.
- Syslog messages from resources that are syslog enabled.
Interpretation
OpsRamp normalizes ingested events into a common form and applies algorithms to infer more information about the event - for example:
- Recurrence: Is this event a re-occurrence of the same event that OpsRmap has already seen recently.
- State change: Does the event represent a return to normal state of a resource that had previously sent a critical event.
- Past occurrences: How many times has this event occurred in the last day, last week, last month.
- Seasonality: Has the event occurred at a regular frequency in the past (for example: has the event occurred every day in the last month).
After interpretation, OpsRamp transforms the ingested event into an alert. An alert is a construct that is consumed and managed by later stages in lifecycle and by the user. An alert can be suppressed, acknowledged, ticketed, and more.
Correlation
OpsRamp automatically group alerts that it can infer to be due to the same cause. It performs two types of correlation:
Deduplication
OpsRamp groups an alert that is a repetition of an alert this currently open. For example, network devices keep sending SNMP traps as long as an issue persists. OpsRamp automatically groups these recurring alerts.
Inferencing
OpsRamp groups different alerts from different IT resources, that it can infer to be likely due to the same cause. There several reasons for why a single underlying cause, can results in multiple alerts.
Common patterns in IT environments include:
- Cascading impact: Alerts from a IT resources that have are dependent on one another.
- Common impact: Alerts due to the same change or failure on multiple resources.
The following diagram illustrates cascading and common impacts associated with inferencing: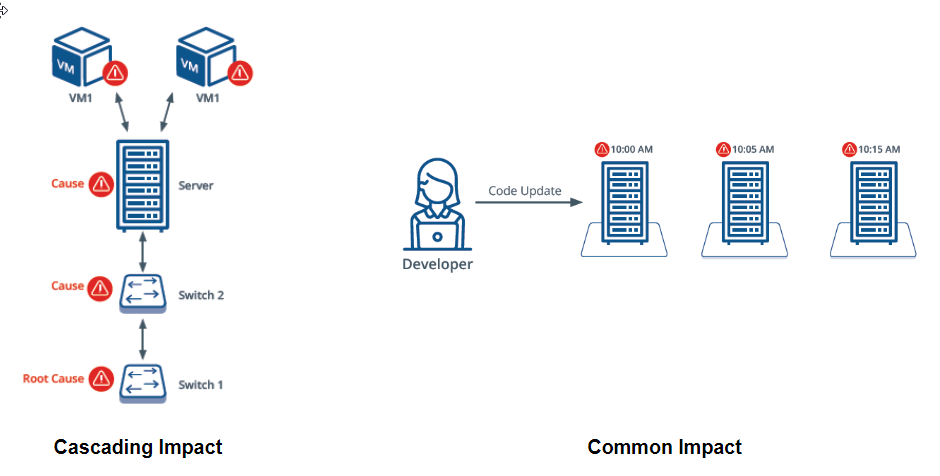
Cascading and Common Impact
OpsRamp applies machine learning algorithms to identify such alerts that are related and groups related alerts into an inference.
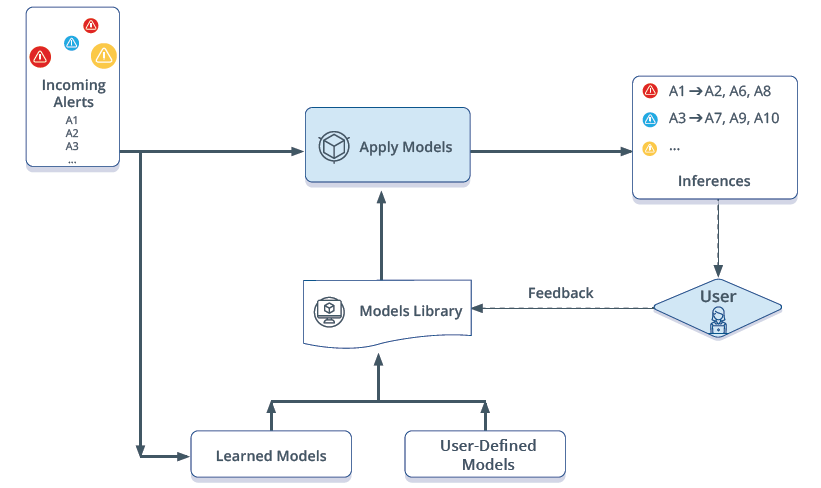
Inferencing
First response
OpsRamp automatically suppresses alerts based on these criteria:
Seasonal patterns
For alerts that OpsRamp has learned to have a seasonal pattern - for example, an alert that occurs nightly between 10:00 PM - 11:00 PM - it suppresses the current alert. If the alert continue to be open past is historical norm (for example, the alert that arrives at 10:00 PM and stays open past 11:00 PM), OpsRamp automatically undoes the suppress action on the alert. Such an alert needs user attention because it indicates a persistent issue.
Attribute patterns
Learning algorithms can be trained to suppress alerts that have specific patterns. For example, alerts from specific resources that are known be false positives.
Escalation
After an alert is correlated, OpsRamp provides options to notify users about the alert and automatically create incident tickets. The goal of alert escalation is to notify users of critical alerts so that the alert is acknowledged by a user.
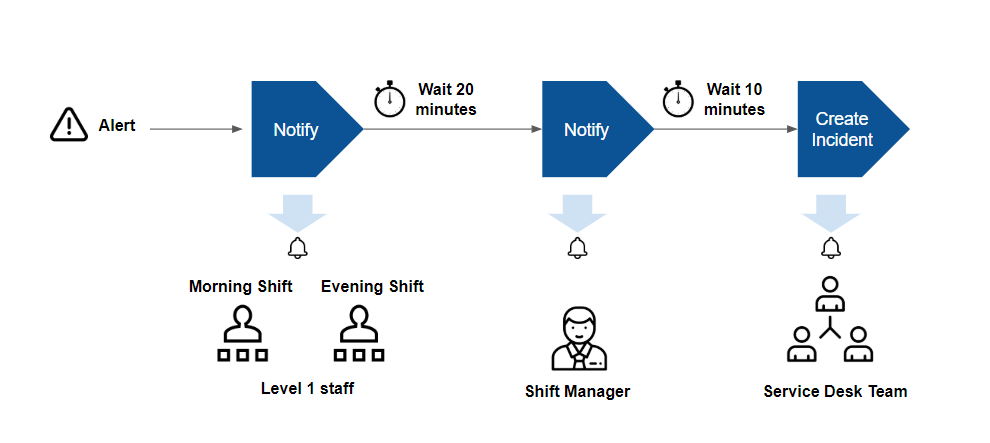
Escalation is useful if you follow an on-call process for alert response. In an on-call process, your IT staff do not watch a console for alerts. Instead, automated notifications are sent to designated staff on pre-defined shifts.
With escalation features, you can notify users using email, text and voice messages, based on these criteria:
- User and alert type: Notify specific users based on type of alert.
For example, notify database administrators of alerts from database servers. - Shift schedule: Notify specific users based on when they are available: For example, notify IT staff on the day shift, of alerts that arrive between 8:00 AM - 5:00 PM, and notify IT staff on the evening shift, of alerts that arrive between 5:00 PM - 2:00 AM.
- Chain of responsibility: Notify users up a chain of responsibility, if alerts remain unacknowledged after notification. For example, notify shift managers of unacknowledged alerts of alerts that remain unacknowledged 30 minutes after first notification was sent to level 1 staff.