Introduction
Datadog is a monitoring service for cloud-scale applications, providing monitoring of servers, databases, tools, and services, through a SaaS-based data analytics platform.
Note
When an event is triggered in Datadog, an alert is created. The information of the Datadog event is carried over.OpsRamp configuration
Configuration involves the following:
- Installing the integration.
- Configuring the integration.
Step 1: Install the integration
To install:
- Select a client from the All Clients list.
- Go to Setup > Integrations > Integrations.
- From Available Integrations, select Monitoring > Datadog and click Install.
- Provide the following:
- Name
- IP address
- Credentials. Select an existing credential or create a new credential.
- Click Save.
Step 2: Configure the integration
To configure the integration:
- From the API tab, provide the following:
- Authentication: Copy Tenant Id, Token and Webhook URL for configuration. These settings are used for creating a HTTP Request template.
- Map Attributes: Provide the mapping information for the third-party.
- Select the required OpsRamp property from the drop-down.
- Click Add Mapping Attributes to map attributes for the specific OpsRamp alert property.
- Provide the entity and property value.
- From the Monitoring of Integration tab, click Assign Templates.
- Select the IntgMonittool template.
- Click Assign Templates.
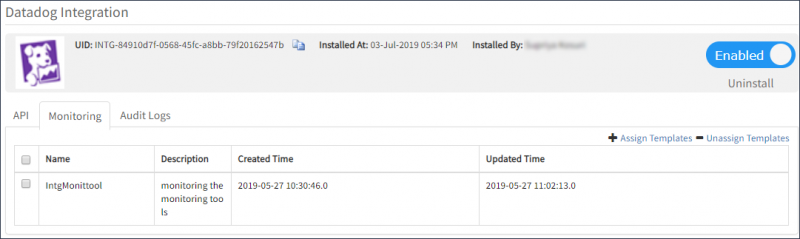
Monitoring of Integrations
- From the Audit Logs, set up audit log criteria and time frame.
Property mappings
| Datadog Property | OpsRamp Property | ||||||
|---|---|---|---|---|---|---|---|
| eventTitle | Alert subject | ||||||
| eventDetails | Alert description | ||||||
| date | Alert time | ||||||
| eventAlertType | Alert state
| ||||||
| eventAlertMetric | Alert metric | ||||||
| eventHostName | Alert resource name |
Sample: Datadog Webhook payload
        {
        	"id": "4804742212344586948",
        	"eventTitle": "\[Triggered on {host:hydlpt110}\] \[TEST\] CPU load is high",
        	"eventType": "service\_check",
        	"evenAlertID": "8360816",
        	"eventAlertType": "error",
        	"eventHostName": "hydlpt110",
        	"eventAlertMetric": null,
        	"eventAlertTittle": "\[TEST\] CPU load is high on host:hydlpt110",
        	"date": "1550647818000",
        	"org": {
        		"id": "245725",
        		"name": "dev"
        	},
        	"eventDetails": {
        		"email": "",
        		"eventMsg": "%%%\\nPlease chcek @webhook-OR-webhook\\n\\nTest notification triggered by james096@gmail.com.\\n\\n\\n\\n\\n\\n- - -\\n\\n\[\[Monitor Status\](https://app.datadoghq.com/monitors#8360816?group=host%3Ahydlpt110)\] · \[\[Edit Monitor\](https://app.datadoghq.com/monitors#8360816/edit)\] · \[\[View hydlpt110\](https://app.datadoghq.com/infrastructure?filter=hydlpt110)\] · \[\[Show Processes\](https://app.datadoghq.com/process?sort=memory%2CASC&to\_ts=0&tags=host%3Ahydlpt110&from\_ts=-900000&live=false&showSummaryGraphs=true)\]\\n%%%",
        		"eventTxtMsg": "\\nPlease chcek @webhook-OR-webhook\\n\\nTest notification triggered by james096@gmail.com.\\n\\nMetric Graph: https://app.datadoghq.com/monitors#8360816?to\_ts=1550647878000&group=host%3Ahydlpt110&from\_ts=1550644218000 · Monitor Status: https://app.datadoghq.com/monitors#8360816?group=host%3Ahydlpt110 · Edit Monitor: https://app.datadoghq.com/monitors#8360816/edit · Event URL: https://app.datadoghq.com/event/event?id=4804742212344586948 · View hydlpt110: https://app.datadoghq.com/infrastructure?filter=hydlpt110",
        		"evenDatePost": "1550647818",
        		"eventAggregKey": "36adb48abb510bd80816c1f423f2a8f0",
        		"eventAlertStatys": "",
        		"eventUserName": "",
        		"eventSnaoShot": null,
        		"eventLink": "https://app.datadoghq.com/event/event?id=4804742212344586948",
        		"eventTags": "check:cpu,host:hydlpt110,monitor",
        		"eventLastUpdatedPosix": "1550647818",
        		"eventAlertQuery": "\\"datadog.agent.check\_status\\".over(\\"check:cpu\\").by(\\"host\\").last(2).count\_by\_status()",
        		"eventAlertScope": "host:hydlpt110",
        		"eventAlertCycleKey": "4804731423302266881",
        		"last\_updated": "1550647818000"
        	}
        }
Datadog configuration
Configurations in Datadog involve:
- Configuring Webhook.
Webhook allows you to connect with OpsRamp and alert OpsRamp when an event is triggered. - Enabling notification for monitoring.
Notifications allow you to notify OpsRamp about an event.
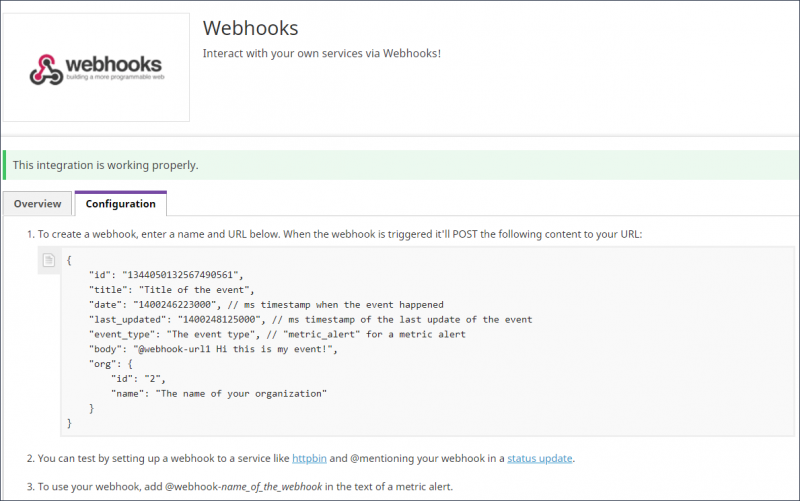
Step 1: Configure Webhook
To configure Webhook:
- Log into Datadog.
- Click the Integrations icon and click Integrations.
- Configure Webhook and click Update Configuration to save the details.
Webhook Configuration
- Name: Provide a name for Webhook. For example: OpsRamp-Alerts)
- URL: Provide the Webhook URL copied from OpsRamp.
For example:https://{api-url}/integrations/alertsWebhook/client_1/alerts?vtoken=bOvr34Kh3Jm3eVJkmfBND7uJ9gyF72bL - Use custom payload: Select the custom payload option.
- Custom payload: Provide the below payload
- Encode as form: Not Applicable.
- Header: Not Applicable.
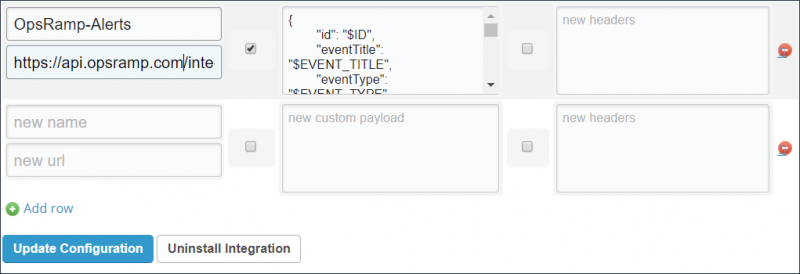
Name and URL for Webhook Configuration
Custom payload syntax
{
"id": "$ID",
"eventTitle": "$EVENT\_TITLE",
"eventType": "$EVENT\_TYPE",
"evenAlertID": "$ALERT\_ID",
"eventAlertType": "$ALERT\_TYPE",
"eventHostName": "$HOSTNAME",
"eventAlertMetric": "$ALERT\_METRIC",
"eventAlertTittle": "$ALERT\_TITLE",
"date": "$DATE",
"org": {
"id": "$ORG\_ID",
"name": "$ORG\_NAME"
},
"eventDetails": {
"email": "$EMAIL",
"eventMsg": "$EVENT\_MSG",
"eventTxtMsg": "$TEXT\_ONLY\_MSG",
"evenDatePost": "$DATE\_POSIX",
"eventAggregKey": "$AGGREG\_KEY",
"eventAlertStatys": "$ALERT\_STATUS",
"eventUserName": "$USERNAME",
"eventSnaoShot": "$SNAPSHOT",
"eventLink": "$LINK",
"eventTags": "$TAGS",
"eventLastUpdatedPosix": "$LAST\_UPDATED\_POSIX",
"eventAlertQuery": "$ALERT\_QUERY",
"eventAlertScope": "$ALERT\_SCOPE",
"eventAlertCycleKey": "$ALERT\_CYCLE\_KEY",
"last\_updated": "$LAST\_UPDATED"
}
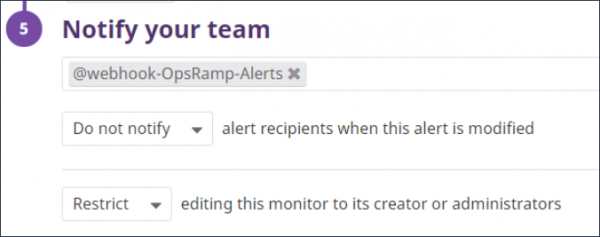
}Step 2: Enable notifications
To enable the notifications for monitoring:
- Click the Select Monitor icon and click Manage Monitors.
- Select the monitor that you want to enable the integration to OpsRamp and edit the settings.
- In the Notify your team section, type
@to see the available list of Webhooks to trigger. - Select the configured Webhook and specify notifications and restrictions for notification.