Introduction
Elasticsearch is an ELK stack-based distributed, RESTful search and analytics engine used for all types of data. Integration with Elastic log monitoring uses Webhooks to identify data changes and to monitor alerts.
After successfully integrating with the Webhooks call-back mechanism, ElasticLog alerts can be viewed in the system. The inbound integration configuration can be used to view ElasticLog monitoring events as system events.
The current ElasticLog version supported for integration is 7.6.1.
OpsRamp configuration
Configuration involves:
- Installing the integration
- Configuring the integration
Step 1: Install the integration
To install:
- Select a client from the All Clients list.
- Go to Setup > Integrations > Integrations.
- From Available Integrations, select Monitoring > ElasticLog.
- Click Install.
After the installation, ElasticLog appears under My Integrations.
Step 2: Configure the integration
Inbound configurations capture all the required details to call OpsRamp APIs in ElasticLog.
Authentication
- Configure the Authentication type to call OpsRamp APIs.
- Select Webhooks as the authentication mechanism to generate the Token and WebHook URL. Both are required to define alert endpoints.
Configuring map attributes
After installation, ElasticLog attributes are mapped to OpsRamp attributes. Attributes can be modified depending on the payload request.
Default attribute mappings are:
| Third-Party Entity | OpsRamp Entity | Third-Party Property | OpsRamp Property (non-editable) |
|---|---|---|---|
| Problem | ALERT | State | alert.currentState |
| Problem | ALERT | Metric | alert.serviceName |
| Problem | ALERT | Description | alert.description |
| Problem | ALERT | Xpack_Alert | alert.deviceName |
| Problem | ALERT | Alert_Id | alert.extAlertId |
| Problem | ALERT | Subject | alert.subject |
Notes
- Attributes can be modified.
- Mappings are user-selectable and depend on the environment.
ElasticLog configuration
Configuring ElasticLog involves:
- Configuring Watcher
- Creating a threshold alert
- Sample request payload
Step 1: Configure Watcher
- From the ElasticLog console, select Kibana.
- Select Management > Elasticsearch > Watcher.
- Click Create to establish a new threshold alert.
Contact support to use the Advanced option instead of Threshold.
Step 2: Create threshold alert
To create an alert and verify if the sample request is received, do the following:
From Watcher, select Create and click Create threshold alert.
Enter the following details:
- Name: Unique name of the alert.
- Indices to query: Select the corresponding module from the drop-down menu.
For example, metricbeat-*. - Time field: Select the appropriate field from the drop down menu.
- Run watch every: Specify when to run the watch from the drop-down menu.
For example, run watch for every 1 minute. - From Match the Condition, identify a condition from the corresponding fields and values from the drop down menu by editing the sample query condition.
For example, the figure represents the top five carriers whose average ticket price is above 100 for the last few days.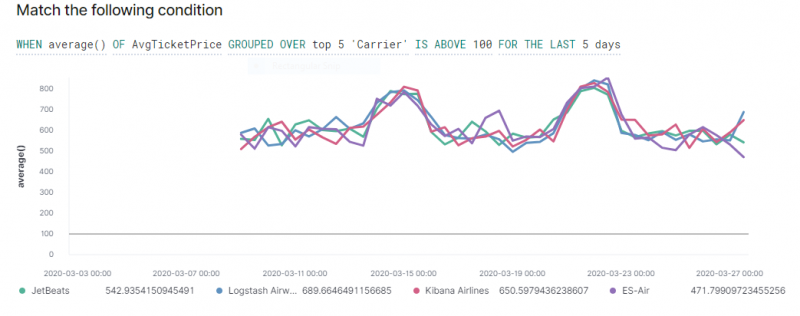
Threshold Alert
Click Add Action, select Webhook from the displayed options, and modify the Webhook details:
- Method: POST
- Scheme: https
- Host: HostName
- Port: 443
- Path: Path information in the URL
- Ex URL:
https://example.vistanet.jp/integrations/alertsWebhook/{tennant Id}/alerts?vtoken=ddwoe3579393829 - Host: example.vistanet.jp
- Path:
/integrations/alertsWebhook/{tennant Id}/alerts/ddwoe3579393829 - Body:
{ "Subject": "Watch [{{http://ctx.metadata.name}}] has exceeded the threshold",
"Description": "Watch [{{http://ctx.metadata.name}}]
has exceeded the threshold value of {{ctx.metadata.watcherui.threshold}} on {{ctx.metadata.watcherui.index}} ",
"State":"CRITICAL",
"Alert_Id":"{{http://ctx.id}}",
"Trigger_Time":"{{ctx.trigger}}",
"Xpack_Alert":"{{ctx.metadata.xpack.type}}",
"Indices":"{{ctx.metadata.watcherui.index}}",
"Time_Field":"{{ctx.metadata.watcherui.time_field}}",
"Metric":"{{http://ctx.metadata.name}}",
"Payload":"{{ctx}}"
}
Click Create Alert.
Click Send Request to verify if the sample request is received.
To verify, click Show Request.
Sample payload
This is a sample ElasticLog payload that is validated:
{
"Subject": "Watch [Metric_Test] has exceeded the threshold",
"Description": "Watch [Metric_Test] has exceeded the threshold value of 15 on {0=metricbeat-*} ",
"State": "CRITICAL",
"Alert_Id": "_inlined__349ec1fc-49a8-4c20-a85b-d4385167dbb1-2020-03-31T11:40:07.651439Z",
"Trigger_Time": "{triggered_time=2020-03-31T11:40:07.651394Z, scheduled_time=2020-03-31T11:40:07.651394Z}",
"Xpack_Alert": "threshold",
"Indices": "{0=metricbeat-*}",
"Time_Field": "@timestamp",
"Metric": "Metric_Test",
"Payload": `"{metadata={name=Metric_Test,
watcherui={trigger_interval_unit=m,
agg_type=count,
time_field=@timestamp,
trigger_interval_size=1,
term_size=5,
time_window_unit=m,
threshold_comparator=>,
index=[metricbeat-*],
time_window_size=1,
threshold=15}, xpack={type=threshold}},
watch_id=_inlined_,
payload={result=125},
id=_inlined__349ec1fc-49a8-4c20-a85b-d4385167dbb1-2020-03-31T11:40:07.651439Z,
trigger={triggered_time=2020-03-31T11:40:07.651394Z, scheduled_time=2020-03-31T11:40:07.651394Z},
vars={},
execution_time=2020-03-31T11:40:07.651439Z}"`
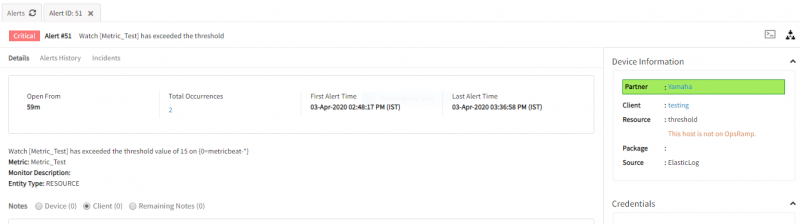
}Viewing alerts
To view the alerts:
- Select the Workspace drop-down option and go to Alerts.
- Search for ElasticLog as the source name to view alerts.
- Click an alert ID.