Prometheus integration provides a mechanism for ingesting Prometheus metrics.
Version compatibility
Tested Prometheus version: 2.22.1
Prometheus feature enhancements and metric name changes between versions can affect dashboards. To find the latest information on Prometheus versions, see https://github.com/prometheus/prometheus/releases.
Prerequisites
- A Kubernetes environment that contains a Prometheus server.
- A Kubernetes environment with at least 1GB of RAM available for the Prom-Agent.
- An auto-monitoring enabled client.
Note
Prometheus integration is only available for newly created clients that have auto-monitoring enabled. Existing clients cannot enable auto-monitoring.Recommended Prometheus Remote-Write Configuration tuning:
| Configuration Parameter | Description |
|---|---|
| capacity | How many samples are queued in memory per shard before blocking reading from the WAL. When the WAL is blocked, samples cannot be appended to any shards and all throughput ceases. |
| max_shards | The maximum number of shards, or parallelism, Prometheus uses for each remote write queue. |
| min_shards | The minimum number of shards used by Prometheus, which is the number of shards used when remote write starts. |
| max_samples_per_send | The maximum number of samples sent per batch, which can be adjusted depending on the back end in use. |
| batch_send_deadline | The maximum time interval between sends for a single shard, in seconds. |
| min_backoff | The minimum time to wait before retrying a failed request, in seconds. |
| max_backoff | The maximum time to wait before retrying a failed request, in seconds. |
See: https://prometheus.io/docs/practices/remote_write/
Prometheus handles most of the above configurations dynamically based on the responsiveness of OpsRamp Agent, so it is best to leave them to their default values. If that doesn’t work, the values can be altered based on the above descriptions.
Limitations
The number of active series per metric per client is 50000. You can avoid the limit by configuring Prometheus to filter metrics. For example, use the following configuration to limit apiserver_request_duration_seconds_bucket, and etcd_request_duration_seconds_bucket metrics:
remoteWrite:
  - url: http://prom-agent-service.prom-agent:20460/push
    writeRelabelConfigs:
    - action: drop
      regex: apiserver_request_duration_seconds_bucket
      sourceLabels:
      - __name__
    - action: drop
      regex: etcd_request_duration_seconds_bucket
      sourceLabels:
      - __name__
Add a Prometheus integration and agent
Adding an integration
- Click Setup > Accounts > Clients
- Choose the client in the Client Name column for which you want to onboard a Prometheus integration.
- Click ONBOARDING WIZARD.
- On the Prometheus metrics tile, click ADD.
- Enter a Name for your Prometheus integration and click Next. The name must contain only lower case alphanumeric characters or dash (-) and start and end with an alphanumeric character. For example,
my-nameor123-abc.
Configuring Prometheus and the agent
- Follow the Prom-Agent Deployment Configuration, Prometheus remote-write Configuration, and Prometheus Label Configuration instructions, copying from the code snippets on the right, as noted in the instructions.
- (optional) After adding a Prometheus integration and an agent, click Test Connection to verify connectivity. You should receive a Connected successfully message. If not, troubleshoot the possible fault conditions described, below.
- Click Finish.
Test Connection troubleshooting
Problem with network connection. Unable to testThe OpsRamp cloud is unable to communicate with the agent in the Prometheus environment. Check the agent deployment.
Possible connectivity issue. Verify that the Prometheus remote-write settings are correctly configured.Prometheus is not able to push metrics to the agent. Check the Prometheus remote-write configuration parameter. If the configuration is correct but not reflected in Prometheus, delete the Prometheus Kube POD so restarts with the new configuration.
Connect OpsRamp Prometheus Agents behind a Proxy
To connect OpsRamp Prometheus agent using a proxy, set the following environment variables:
CONN_MODE=proxy
PROXY_SERVER=<ProxyServerIP>
PROXY_PORT=<ProxyPort>
If the proxy server needs authentication, set the following credentials:
PROXY_USER=<User>
PROXY_PASSWORD=<Password>
Set the Prometheus configuration parameters as shown in the following examples:
externalLabels:
  OpsRampIntegrationName: PrometheusIntegration1
remoteWrite:
- url: http://prom-agent-service.prom-agent:20460/pushUse the OpsRampIntegrationName label to associate the metrics with the integration.
Configure high-availability (HA) Prometheus
Assign unique externalLabels to each Prometheus replica. Otherwise, data clashes can occur between replicas.
You can also try the combinations described in Multiple prom-agent setup instructions to point the HA Prometheus instance to OpsRamp.
Configuration to filter metrics pushed to remote-write
Prometheus can be configured to filter the metrics to be pushed to a remote endpoint like the agent. See the Prometheus configuration remote_write property documentation for more information.
Consider the following examples.
Drop samples example
The following writeRelabelConfigs configuration drops samples with a metric name that starts with go:
remoteWrite:
- url: http://prom-agent-service.prom-agent:20460/push
writeRelabelConfigs:
- sourceLabels: [__name__]
regex: 'go_.*'
action: dropKeep samples example
The following writeRelabelConfigs configuration keeps samples with a metric name that starts with go:
remoteWrite:
- url: http://prom-agent-service.prom-agent:20460/push
  writeRelabelConfigs:
  - sourceLabels: [__name__]
    regex: 'go_.*'
    action: keep
Replace samples example
You can also change a label using the replace action before pushing it to a remote endpoint. The following example replaces samples with a metric name that starts with go with the name sample_go_label:
remoteWrite:
- url: http://prom-agent-service.prom-agent:20460/push
  writeRelabelConfigs:
  - sourceLabels: [__name__]
    regex: 'go_.*'
    action: replace
    targetLabels: sample_go_label
Multiple prom-agent setup instructions
Multiple-Prometheus setups have three valid use cases.
Single integration deployed across multiple clusters
Create a single Prometheus integration and deploy the same provided agent YAML configuration across multiple Kubernetes clusters:
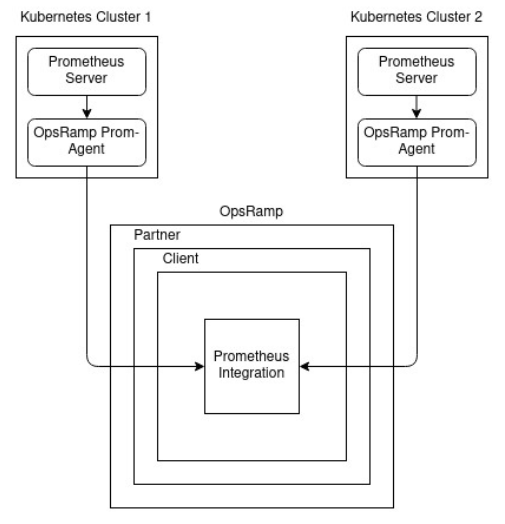
Prometheus integration use case 1
To differentiate between the clusters and identify the source of the metrics, add another external label.
Different integration for each cluster
Create a Prometheus integration for each Kubernetes cluster that has a Prometheus server:
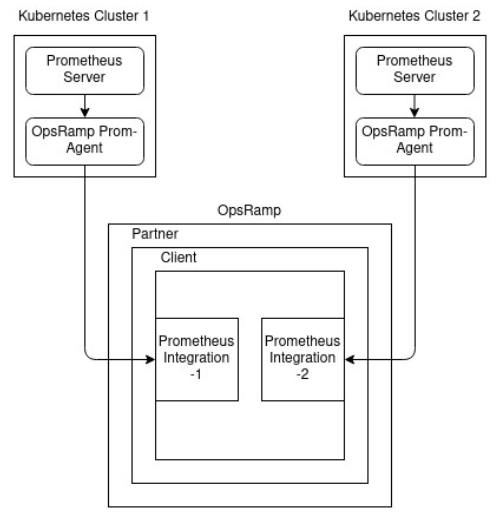
Prometheus integration use case 2
Use the OpsRampIntegrationName label to associate the metrics with the integration.
Agent deployed in one cluster with services exposed
Create a Prometheus integration, deploy the provided agent YAML configuration in one of the clusters, and expose its service using NodePort on the network:
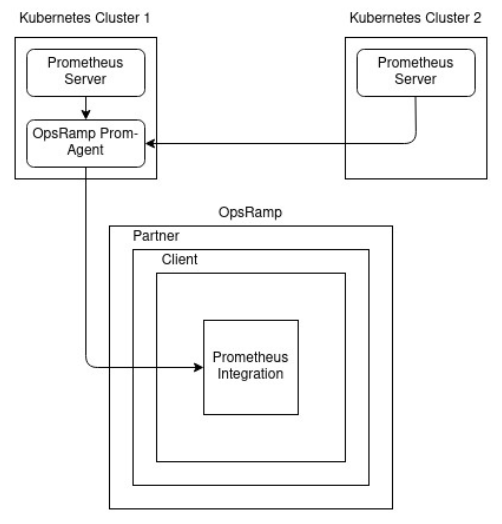
Prometheus integration use case 3
Add another external label to identify the source of the metrics and to differentiate between clusters. Make sure you allocate more CPU and memory resources to the agent so it can handle metrics from multiple clusters.
To expose the Prometheus agent service to the network:
Create a YAML file with the following content and deploy it:
    apiVersion: v1
    kind: Service
    metadata:
      name: prom-agent-expose-service
      namespace: prom-agent
    spec:
      type: NodePort
      ports:
        - nodePort: 30460   #The NodePort that you want to give to OpsRamp Prometheus Agent.
          port: 20460       #The Default OpsRamp Prometheus Agent port. Change this if you have modified the port for OpsRamp Prometheus Agent.
          protocol: TCP
          targetPort: 20460 #The Default OpsRamp Prometheus Agent port. Change this if you have modified the port for OpsRamp Prometheus Agent.   selector:
        app: prom-k8s-agent
After deployment, configure the Prometheus Remote Write URL based on the node IP of the Prometheus agent:
    remoteWrite:
    - url: http://{node IP}:{node Port}/push #example: http://172.26.32.230:30460/push
After exposing the service on the network, you can point any number of Prometheus servers in the cluster to the agent. To be able to get the communication status, or health, of an individual Prometheus server, add the following environment variable in the agent deployment YAML:
- name: DISABLE_REMOTE_ADDRESS
  value: "TRUE"
Viewing and monitoring health status
The agent is self-monitoring and pushes its health status to the cloud as the promagent_health_status metric. Health is reported periodically at default five-minute intervals. You can view health status metric data on the resource details page on the Infrastructure and My Dashboards pages. To view in the dashboard, mouse over Dashboards and choose Dashboard 2.0.
The promagent_health_status metric includes id, integration_uuid, and prometheus_address labels.
| Metric Label | Description |
|---|---|
id | OpsRamp Resource ID. |
integration_uuid | Integration Resource UUID will be available against INTEGRATION_RES_UUID field in prom-agent yaml or Prometheus Metrics Integration page in Installed Integrations Page. |
prometheus_address | IP Address of prometheus. |
You can define an alert on the agent health status metric by navigating to SetUp > Monitoring > Alert Definitions. Create an Alert Definition Policy on the promagent_health_status metric and define the policy using agent health status metric labels.