Cloud cost insights
The Cloud Cost Insights widget shows Months-to-Date spends of the public cloud by default. The user can choose a different timeline to show the total spends for the specific time period. You can view a breakdown of spending by cloud account, by custom attributes (for example, denote business units) and other attributes.
To get the data into Cloud Cost Insights, you need to configure the Cloud Cost Insights Widget.
To configure the Widget,
- On the Dashboard, click Add Widget.
- Under Other Predefined Widget, click Cloud Cost Insights and provide the following:
- Filter Criteria: Options include Provider Type, Cloud Account, Tags (that are assigned to resources)
- Group by: Options include ProviderType, Tags, Resource Group, Instance type, License type
- Widget Preferences: Refresh every 1 hour.
- Display Preferences:
- Widget title: Provide a display title.
- Chart Style: Select a style (column or pie)
Cloud Cost Insights graph you can filter by any date range as shown in the following screenshot.
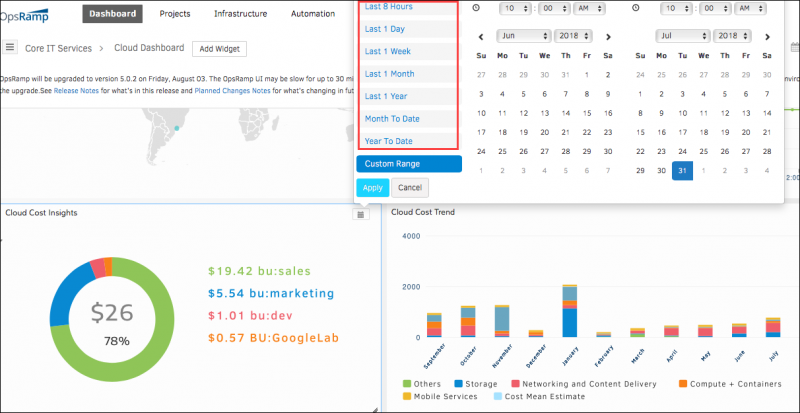
Cloud Cost Insights
Cloud cost trend
The Cloud Cost Trend widget shows a trend of spending on public clouds over time. You can view trend by resource type, custom attributes, and other attributes.
- On the Dashboard, click Add Widget, point to Predefined Widget, and click Cloud Cost Trend.
- In Add Widget window, provide the following:
- Filter Criteria
- Provider Type: Filter by Cloud instance type, AWS, Azure or Google.
- Cloud Account: Filter by Cloud Account
- Tag: Filter by Tags, assigned to the resources.
- Group By: Tags, resource group, instance type and license type.
- Duration: Select the duration, a specific time period. Example: 3 Months.
- Estimate: Select +1M to estimate next month trend.
- Refresh every: Select the interval frequency to refresh.
- Widget Title: Provide a name for the Widget.
- Chart Style: Choose the chart style - Column or Pie chart.
- Filter Criteria