Introduction
IBM Websphere MQ is a queue-based message-oriented middleware that enables similar or dissimilar applications to communicate securely.
Monitoring activities include:
- Monitoring IBM MQ applications in the managed environment.
- Tracking the health status of IBM MQ objects such as queues and queue managers.
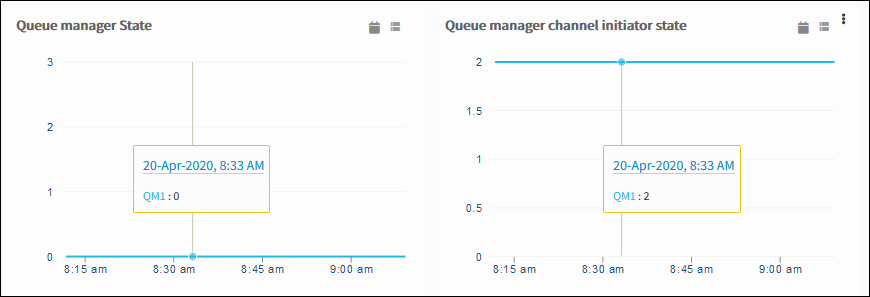
For example, you can monitor the state of the queue manager using QMGR.STATE and
receive alerts in the alerts browser for any issue.
The IBM MQ key elements include:
- Queue
- Queue Manager
Note
Administrative privileges are required to monitor IBM MQ applications.Monitoring using IBM MQ adapter
IBM MQ monitoring includes:
- Creating metrics
- Creating monitors
- Creating templates
- Assigning credentials
- Assigning templates
Step 1: Create IBM MQ metrics
To create IBM MQ metrics:
- Select a client from the All Clients list.
- Select Setup > Monitoring > Metrics.
- From the METRICS screen, click + Add.
- From CREATE METRICS, provide the following parameters:
- Collector Type: Select Application.
- Application Type: Select IBM MQ.
- Name: Provide a Name for the metric.
- Tag: Refers to the user-defined tags for better filtering.
- Display Name: Refers to the display Name provided for the metric.
- Description: Refers to the reason for the metric.
- Data Point type: Select the required data point.
- Units: Select the required values for Units, Unit Multiplication Factor, and Datapoint value conversion lists.
- Unit Multiplication Factor: Refers to the value chosen to multiply a value based on the chosen unit.
- Data Point Conversion: Refers to one of the following options:
- Value
- Enumerated Map
- Metric Processing: Refers to one of the following values for processing the Metric:
- Notification
- Graph
- Graph and Notification. To configure values for Graph and Notification, provide details for the following parameters:
- Warning if value: Refers to the warning threshold value.
- Critical if value: Refers to the critical threshold value.
- Subject: Refers to the subject for the metric.
- Description: Refers to the description for the metric.
- Click Save.
The METRICS screen displays the new metric.
Important
The values for subject and description are populated by default.
Do not change the subject and description values. Changing these values may result in failures associated with alert generation.
Step 2: Create IBM MQ monitor
To create IBM MQ monitor:
- From the left pane, click Monitoring > Monitors. The MONITORS screen appears.
- From the MONITORS screen, click + Add.
- From CREATE A MONITOR, provide the following parameters:
- Monitor Scope: Refers to the Partner Monitor or Client-Specific Monitor. For Client-Specific Monitor, the client must also be selected.
- Adaptor Type: Refers to the monitor type. Select Application.
- Application Type: Refers to the type of resource. Select IBM MQ.
- Name: Provide a unique name for the monitor.
- Description: Refers to the details of the added monitors.
- Metrics: To add metrics, do the following steps:
- From Metrics, click Add Metrics.
- The Metrics screen appears with the list of available IBM MQ metrics.
- Note: 20 metrics (maximum) is recommended. Adding more number of metrics in a monitor can run into performance issues.
- Search the desired metric and click Add Metrics. The Metrics section displays the selected metric.
- After adding the metrics, navigate to Configuration Parameters.
- From Metrics, click Add Metrics.
- Configuration Parameters: Refers to the parameters required to monitor IBM MQ.
To add configuration parameters, do the following:- Provide Default Value for all the configuration parameters.
- Select Configurable checkbox and click + Add.
- From the Configuration Parameters screen, provide configuration parameters depending on the managed environment or resources and click Add.
For example:application.component.name. - From the Configuration Parameters section, provide the default value for the added name. For example:
queue. - After providing the configuration parameters, navigate to Instance Filter.
- Instance Filter: Refers to the following methods chosen to filter the instances:
- All: Refers to all instances for the configured component.
- Expression: Refers to the rule that is set to filter the instances depending on the component.
- To add a rule:
- Click +Add.
- Select Property and Operator.
- Provide a value to filter.
- Manual Selection: Refers to the physical selection of the instances.
- Click Save.
The MONITOR screen displays the IBM MQ monitor.
Step 3: Create IBM MQ template
To create a template:
- Go to Setup > Monitoring >Templates.
- From the TEMPLATES screen, click + Add.
- From MONITOR TEMPLATE, provide the following parameters:
- Select Template Scope: Refers to the template type.
- Collector Type: Select Gateway.
- Monitor Type: Select Monitors for G2 Templates.
- Applicable for: Select Device.
- Template Name: Refers to the name of the template.
- Description: Refers to the summary of the template.
- Generation: Refers to the generation that the template belongs to.
- Tags: Refers to the user-defined tags for better filtering.
- Prerequisites: Refers to the essential things that must be considered while monitoring using the template. For example, SQL services must be checked while monitoring the SQL parameters using the Windows templates.
- Status: Refers to the active or end-of-life templates.
- Notes: Refers to the information to add to the template.
- Template Family Name: Refers to the category that applies to the application. For example, Windows server, storage server, and network server.
- Deployment Type: Refers to one of the following methods to apply the template to the resources:
- Custom
- Optional
- Standard
- After providing the template details, MONITOR TEMPLATE displays the Monitors section.
Note: The user interface for the Monitors section varies with the option selected in the collector type. - Monitor: To add details in the Monitors section, do the following:
- From the Monitors section, click Add and provide the following in the monitor screen:
- Frequency: Refer to the frequency to execute the template.
- Monitor Definition: Refers to the monitor type. For example, select IBM MQ queue monitor.
- When to Alert: Select Breach of a Threshold.
- Select Availability and Alert checkbox to initiate monitoring for the desired metrics.
- From the Monitors section, click Add and provide the following in the monitor screen:
- Click Save.
The TEMPLATES section displays the configured details.
Step 4: Assign credentials
Prerequisite: Read-only permission to access the target device.
To assign credentials:
- Select a client from the All Clients list.
- Go to Infrastructure > Resources.
- From the list of devices, select a device.
- Navigate to the device information page and from the center pane, click Credentials.
- From the Credentials screen, click +Add.
- From Create new credential, provide the following parameters:
- Name: Refers to the name of the credential.
- Description: Refers to the description of the new credential.
- Type: Refers to the application type. Select HTTP.
- Username: Refers to the username for the credential set.
- Password: Refers to the password that you set for the credential set.
- Confirm Password: Provide the same password.
- Port: Refers to the port used to connect to the application.
- Connection Time Out (ms): Refers to the time taken for the resource to connect to the application.
- Click Save.
The Credentials screen displays the new credentials.
Step 5: Assign template
After creating a template and assigning credentials, assign the template to the resource.
Important
Credentials must be created to assign a template to a resource.To assign a template to a resource:
- Select a client from the All Clients list.
- Go to Infrastructure > Resources.
- From Resources, click the desired resource name > resource Details > Monitors > Template.
- From the Templates screen, click +Assign Templates.
- From Apply Templates > Select Templates > Available templates, select the desired templates.
- Click Assign.
The Templates screen displays the selected templates.
Validation
The gateway monitors the application using the assigned templates and displays the results in a graphical format.
To confirm the monitoring of IBM MQ device, review the following:
- The graph plotted for each metric in the template.
- Alerts generated for metrics in the template by giving thresholds.
Validation
Global metrics and templates
Global metrics and templates are used to monitor the IBM MQ applications.
Global metrics
| Metric Name | Display Name | Description | Unit | DataPoint Type |
|---|---|---|---|---|
| ibm.mq.admin-api.qmgr.state | Queue manager State | The queue manager state of the queue managers to retrieve. The state description for running is zero. | - | Gauge |
| ibm.mq.admin-api.qmgr.channel-initiator-state | Queue manager channel initiator state | Channel initiator state for the queue manager. The various state descriptions are as follows:
| - | Gauge |
| ibm.mq.admin-api.qmgr.connection-count | Queue manager connection Count | Current depth of the queue | count | Gauge |
| ibm.mq.admin-api.queue.current-depth | Queue Current depth | Percent of store limit used | count | Gauge |
| ibm.mq.admin-api.queue.last-get | Queue last get | Queue last get | Seconds (s) | Gauge |
| ibm.mq.admin-api.queue.last-put | Queue last put | Queue last put | Seconds (s) | Gauge |
| ibm.mq.admin-api.queue.oldest-message-age | Queue oldest message age | Oldest message age of the queue | Seconds (s) | Gauge |
| ibm.mq.admin-api.queue.open-input-count | Queue open input count | Queue open input count | Count | Gauge |
| ibm.mq.admin-api.queue.open-output-count | Queue open output count | Queue open output count | Count | Gauge |
| ibm.mq.admin-api.queue.uncommitted-messages | Queue uncommitted messages | Queue uncommitted messages | Count | Gauge |
Global templates
You can monitor IBM MQ application using REST API and SNMP.
API-based integration
- IBM MQ Software - Queue Manager
- IBM MQ Software - Queue Monitoring
SNMP-based Integration
- IBM MQ - Performance
- IBM MQ - Hardware
Best practices
- Apply credentials to the device before applying the templates to the device.
- Configure the monitoring frequency to greater than or equal to 5 minutes.