Introduction
Using G2 custom monitors, building and managing independent monitoring solutions is easy without relying on the platform. Agent-based monitors and templates can be created using the following:
- Application type: Script Executor (Also called as “Remote Script Executor”)
- Supported Programming languages: Shell, Powershell, and Python
- Supported Operating systems: Windows & Linux
Setting up agent G2 monitors using Remote Script Executor
Using Remote Script Executor, you can execute scripts on Linux and Windows workstations with different script types.
Key highlights
- User-defined external arguments support the script through custom attributes.
- Monitor level script execution: Ability to pull more metrics in a single script execution.
- Ability to execute different types of scripts through custom script options apart from default options.
- Able to use credentials attached to the device in the script using the dynamic macro’s support.
- The monitoring of Windows workstations through Linux Gateway is not supported.
Monitoring using Remote Script Executor includes the following steps:
- Creating metrics.
- Creating a custom Remote Script Executor monitor and add the corresponding metrics of the same type.
- Creating a template with Remote Script Executor monitor.
- Assigning the template to a device.
- Getting the latest metric value.
- Viewing graphs.
Step 1: Create metrics
Metrics provide the metadata to correlate the script output and must match the metric names added to the Monitor.
To create Metrics:
- Select a client from the All Clients list.
- Go to Setup > Monitoring > Metrics.
- From METRICS, click + Add.
- From Create Metric, provide details for the following parameters:
- Metric Scope: Select Partner Metric or Client-Specific Metric
- Adaptor Type: Select Application.
- Application Type: Select Remote Script Executor.
- Name: Refers to the unique Name for the metric.
OpsRamp recommends<vendorname>.<application name>.<component>.<metric>as naming convention for the metric. For example,apache.tomcat.webapps.count. - Tag Name: Refers to the user-defined tags for better filtering.
- Display Name: Provide Display Name. For example, System Drive Free Space.
- Description: Provide the reason for the metric.
- Data Point type: Refers to the value chosen to plot data in the graph.
- Units: Refers to the required values for units. You can choose
Unitsdepending on the chosen Data Point type. - Unit Multiplication Factor: Refers to the value chosen to multiply a value based on the chosen unit.
- Data Point Conversion: Refers to one of the following options:
- Value: To populate data using values.
- Enumerated Map: To populate alert and graph details after adding the states such as Up or Down.
The screen displays an more section where you can add the state descriptions and select Alerts and Graphs to populate data.
- Metric Processing: Refers to one of the following values for processing the Metric:
- Notification
- Graph
- None
- Graph and Notification.
- To configure values for Graph and Notification, provide the following parameters:
- Warning if value: Refers to the warning alert sent when the metric reaches the Warning Threshold.
- Critical if value: Refers to the critical alert sent when the metric reaches the Critical Threshold.
- Subject: Refers to the subject for the metric.
- Description: Refers to the description for the metric.
- Click Save.
Note: Use the following tokens in subject and description fields:
| Token | Description |
|---|---|
| ${severity} | Alert state. For example, Critical, Warning, and OK. |
| ${metric.name} | Metric name. |
| ${component.name} | Component name. |
| ${metric.value} | Value of the metric or component. |
| ${resource.name} | Device hostname. |
| ${resource.ip} | IP address of the device. |
| ${threshold} | Threshold value configured for the alert state. |
| ${repeat.count} | Configured repeat count for the respective alert state. |
| ${resource.ipaddress} | IP address of the device. |
| ${resource.mac} | MAC address of the device. |
| ${resource.serialno} | Serial Number of the device. |
| ${resource.make} | Make of the device. |
| ${resource.model} | Device model. |
| ${resource.hostname} | Device hostname. |
| ${resource.uniqueid} | Unique ID/UUID of the device. |
| ${resource.os} | Operating system of the device |
Step 2: Create a monitor
Custom Remote Script Executor Monitor is a collection of Remote Script Executor metrics. You can create a template using the Remote Script Executor monitor.
Prerequisites: Add the required custom parameters.
Macros in Remote Script Executor
Macros are implemented to address the passing of dynamic arguments to scripts.
Use the Static or Dynamic macros to make available native attributes and custom attribute defined on the resource, within the script.
Static macros
Using the Static Macros, OpsRamp overrides the values that you provide in the script.
| Macro | Description |
|---|---|
| ${resource.ipaddress} | The IP address of the device |
| ${resource.mac} | Mac address of the device |
| ${resource.serialno} | Serial Number of the device |
| ${resource.make} | Make of the device |
| ${resource.model} | Model of the device. |
| ${resource.hostname} | The hostname of the device |
| ${resource.uniqueid} | UniqueId of the device |
| ${resource.os} | Operating System of the device |
Dynamic macros
Using Dynamic Macros, do the following actions:
Get custom attributes of the device: If you want to use an argument in any script, apply the custom attributes to the device.
Syntax: ${customattributes.customAttributekey}.For example, you have a custom Attribute on the device with
Key: serviceNameandValue: oracledb. During runtime, the Value: oracledb replaces the macro:${customattributes.serviceName}in the script.Get the credentials added to the device: You can use (macros) credentials in the script to avoid keeping the original username and password in plain text. The macros replace the original credentials when you execute the script.
Syntax:${credentials.CredentialName.credentialField}.For example, you define a Credential set of Name JMXCred and added to a device. You can use the macro ${credentials.JMXCred.username} in your script. The macro replaces the original credentials in your script at runtime.
Script execution path for configuration parameters in Linux and Windows
| Target Platform | ||
|---|---|---|
| Bash | bash | Not Applicable |
| Shell | sh | Not Applicable |
| Powershell | Not Applicable | powershell.exe |
| Python | python | python.exe |
| Perl | Perl | Not Applicable |
If your runtime is not set as an environment variable, mention the absolute path of your runtime. For example, if Python is not set as an environment variable, provide the absolute path of Python such as /usr/lib/python.
Create a monitor
To create a custom Remote Script Executor monitor:
- Select a client from the All Clients list.
- Go to Setup > Monitoring > Monitors
- From Monitors, click + Add.
- From CREATE A MONITOR, provide details for the following parameters:
- Monitor Scope: Select either Partner Monitor or Client-Specific Monitor.
- Adapter Type: Select Application.
- Application Type: Select Remote Script Executor.
- Name: Provide a unique name for the metric.
- Description: Provide the reason for creating the monitor.
- Script: Refers to the custom script in the Script text-box. You can refer to sample script and JSON output formats to view the sample script.
- Metrics: To add Metrics:
- From Metrics, click + Add.
- Search the desired metric and click Add Metrics.
Metrics section displays the selected metric - After adding the metrics, go to Configuration Parameters.
- Configuration Parameters: To add configuration Parameters:
- Provide Default Value for all the configuration parameters.
- Select the Configurable checkbox.
- Click +Add.
The Configuration Parameters screen appears. - Provide configuration parameters depending on the selected script type.
You can view the default value for the respective name selected.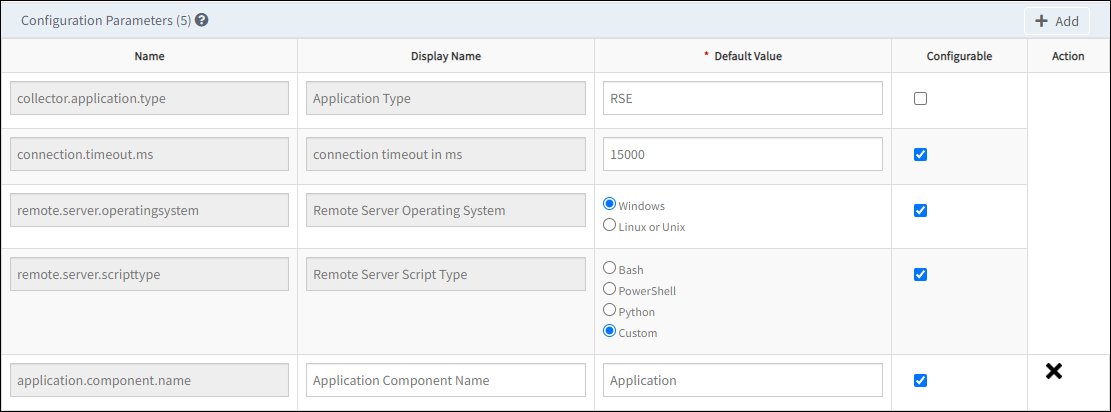
Configuration Parameters
- Click Save.
The MONITORS screen displays the new monitor.
Notes
- Using available configuration parameters, you can specify the scripting language type and the platform to execute the script.
- If you select the Custom value in configuration parameters, add the parameter:
custom.script.execution.path.
Step 3: Create template
A template is an instance of a monitor and is applied to devices.
To create a template:
- Select a client from the All Clients list.
- Go to Setup > Monitoring >Templates.
- From Templates, click + Add.
- From MONITOR TEMPLATE, provide details for the following parameters and click Save.
Select Template Scope: Refers to the Template type.
Collector Type: Select Agent.
Monitor Type: Select G2 Monitors.
Applicable for: Select Device.
Template Name: Refers to the name of the template.
Description: Refers to the summary of the template.
Generation: Refers to the generation that the template belongs to.
Tags: Refers to the user-defined tags for better filtering.
Prerequisites: Refers to the essential things that you must consider while monitoring using the template.
Status: Refers to the Active or End-of-life templates.
Notes: Refers to the information that you want to add to the template.
Template Family Name: Refers to the category that applies to the application. For example, Windows Server, Storage Server, and Network Server.
Deployment Type: Refers to one of the following methods to apply the template to the resources:
- Custom
- Optional
- Standard
After providing the template details, MONITOR TEMPLATE displays the Monitors section.
Note: The console for the Monitors section varies with the option selected in the Collector Type.
Monitor: To add details in Monitors:
- From the Monitors section, click + Add.
The monitor screen appears. - Provide details for the following parameters:
- Frequency: Refer to the frequency to execute the template.
- Monitor Definition: Refers to the monitor type.
- When to Alert: Select Breach of a Threshold.
Select the Availability and Alert checkbox to initiate monitoring.
- Provide details for the following parameters:
- Warning Operator
- Warning Threshold
- Warning Repeat Count
- Critical Operator
- Critical threshold
- Critical Repeat Count
- Click Add.
The TEMPLATES section displays the configured details.
- From the Monitors section, click + Add.
Note
After adding the monitor, add component thresholds and component filters by editing the metric values. For more details, view Component Filters and Component-level ThresholdsStep 4: Assigning a template
To assign a template to a device:
- From the left pane, click Infrastructure.
The Infrastructure screen of the selected client appears. - From the Resources tab, select the required resource from the list of resources.
Alternatively, use the search option to locate the resource. - Click the resource name to view details.
- From the left pane, click Monitors.
- From the Templates tab, click +Assign Templates.
- From Apply Templates, select the desired templates.
The selected Templates section displays the chosen templates. - Click Assign.
The template gets assigned to the selected device.
After assigning the template to a resource for monitoring, click Get Latest Metric Values to view the latest metric information.
Step 4: Viewing graphs
The Agent monitors the system using the assigned templates and displays the results in a graphical format.
To view the monitoring graphs:
- From the left pane, click Infrastructure.
- From the Resources tab, select the required resource from the list of resources.
Alternatively, use the search option to locate the resource. - Click the resource name to view details.
- From the left pane, click Metrics.
The Metrics page displays graphs generated by all monitoring templates assigned to a device. - Search with the desired template name to filter the graphs.
Sample: Remote script executor script
#!/bin/bash

CPU=$(top -bn1 | grep load | awk ‘{printf “%.2f\t\t\n”, $(NF-2)}’)
MEMORY=$(free -m | awk ‘NR==2{printf “%.2f\t\t”, $3*100/$2 }’)
DISK=`df -h | awk ‘$NF==”/”{ print $5}’ | sed ‘s/%//g’`

printf “{\”disk.utilization\” : %s , \”memory.utilization\” : %s , \”cpu.usage\” : %s}” “$DISK” “$MEMORY” “$CPU”

Output :

{“disk.utilization” : 23 , “memory.utilization” : 24.28 , “cpu.usage” : 0.64 }
Standard JSON output formats: Remote script executor script
Format 1
{
“Metric1”: 98,
“Metric2”: 70,
“Metric3”: 80
}
Format 2
{
“Metric1”: 98,
“Metric2”: “STATE”,
“Metric3”: 80
}
}Format 3
{
"MetricName1": {
"components": {
"component1": 70,
"component2": 98
}
},
"MetricName2": {
"components": {
"component1": 77,
"component2": 98
}
}
}Format 4
alertTokens: Using alertTokens, you can add more information to the alert Subject and Description.
{
"MetricName1": {
"components": {
"component1": "STATE",
"component2": 98
},
"alertTokens": {
"token1": "value",
"token2": "value2"
}
},
"MetricName2": {
"components": {
"component1": 77,
"component2": 98
},
"alertTokens": {
"token1": "value",
"token2": "value2"
}
}
}Format 5
{
"MetricName1": 254,
"MetricName2": {
"components": {
"comp1": 90,
"comp2": 60
}
},
"MetricName3": {
"components": {
"component1": "STATE",
"component2": 98
},
"alertTokens": {
"token1": "value",
"token2": "value2"
}
}
}