Introduction
Microsoft SQL Server is a relational database management system developed by Microsoft. Monitoring the MS SQL database can help database administrators to:
- Identify the issues in the database.
- Check metric graphs to view the monitoring updates.
- Take proactive steps to resolve issues before it affects the end-users.
Prerequisites
- Database and port(1433) can be accessed by the gateway.
serveradminprivilege to monitor the database. For more information, see Monitoring Privileges.- A gateway management profile mapped to a resource.
- Create credentials with type as Database before assigning a template to a resource. The Port, Connection TimeOut, and Is Secure values are not used while creating credentials.
Supported version
- MS SQL Server 2008 or higher.
- JDBC(Java Database Connectivity): 8.2.2.jre11.
Database discovery and monitoring
The administrator can deploy an agent or gateway to support MS SQL server agent-based or agentless monitoring.
Discovery using an agent
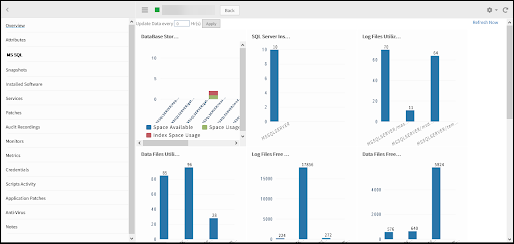
The installed agent auto-discovers the MS SQL database and collects the following metric information:
- Database storage information
- SQL server instances - Information about all SQL Server instances
- Log files utilization in percentage
- Data files utilization in percentage
- Log files free space in KB
- Data files free space in KB
- Database backup information
- Jobs-SQL enabled jobs status
- Processes related to SQL server information
- Services related to SQL server information
You can also apply agent-based templates to initiate MS SQL monitoring.
Discovery using the gateway
The gateway establishes a connection to the database using Java Database Connectivity (JDBC) Java API and collects monitoring metrics using SQL queries. To monitor the MS SQL database, install gateway version 5.0.0 or later. For Windows authentication support, install gateway version 7.0.0 or later.
Use one of the following mechanisms to discover MS SQL servers to add them to your inventory:
- WMI
- SSH
- SNMP
Optionally, add a database server manually to the infrastructure inventory.
To add a resource manually to the inventory:
- Select Infrastructure.
- Click the Settings > Resource > Add.
- From the Add Device window, provide the required details such as Device Type and Management Profile.
- Click Save.
Prepare the resource to start monitoring
To monitor MS SQL:
- Associate appropriate database credentials to the discovered database.
- Assign one or more database-specific global monitors or templates on the device.
Optionally, create custom metrics or monitors using SQL queries and assign them to the database.
To track monitoring of MS SQL database in your cloud environment, see Monitoring Cloud Database using Gateway.
Global templates and metrics
Global templates
| Collector Type | Template Name |
|---|---|
| Agent | Microsoft SQL 2000 - Performance Counters DotNet v4. |
| Microsoft SQL 2005 - Performance Counters DotNet v4 | |
| Microsoft SQL 2008 DotNet v4 - Performance Counters | |
| Microsoft SQL 2012 Advanced Performance Counters DotNet v4 | |
| Microsoft SQL 2012 DotNet v4 - Performance Counters | |
| Microsoft SQL 2012 WMI DotNet v4 - Performance Counters | |
| Microsoft SQL 2014 DotNet v4 - Performance Counters | |
| Microsoft SQL 2016 - Performance Counters DotNet v4 | |
| Microsoft SQL Server 2017 DotNet v4 - Performance Counters | |
| Microsoft SQL 2019 DotNet v4 | |
| Microsoft SQL Performance Counters DotNet v4 | |
| MSSQL - Data and Log Space Size - Config Parameters DotNet v4 | |
| MSSQL Thread Count Free DotNet v4 | |
| Gateway | Advanced Cloud Database Template for MSSQL |
| Advanced Cloud MSSQL Database Access Methods Template | |
| Advanced Cloud MSSQL Database Buffer Template | |
| Advanced Cloud MSSQL Database Databases Template | |
| Advanced Cloud MSSQL Database General Statistics Template | |
| Advanced Cloud MSSQL Database Latches Template | |
| Advanced Cloud MSSQL Database Locks Template | |
| Advanced Cloud MSSQL Database Memory Manager Template | |
| Advanced Cloud MSSQL Database Miscellaneous Template | |
| Advanced Cloud MSSQL Database Resource Pool Stats Template | |
| Advanced Cloud MSSQL Database SQL Statistics Template | |
| Advanced Cloud MSSQL Database Transactions Template | |
| G2 MSSQL Database Access Methods Template | |
| G2 MSSQL Database Access Methods Template v2.0 | |
| G2 MSSQL Database Buffer Template | |
| G2 MSSQL Database Buffer Template - v2.0 | |
| G2 MSSQL Database Databases Template | |
| G2 MSSQL Database Databases Template - v2.0 | |
| G2 MSSQL Database General Statistics Template | |
| G2 MSSQL Database General Statistics Template - v2.0 | |
| G2 MSSQL Database Latches Template | |
| G2 MSSQL Database Latches Template - v2.0 | |
| G2 MSSQL Database Locks Template | |
| G2 MSSQL Database Locks Template - v2.0 | |
| G2 MSSQL Database Memory Manager Template | |
| G2 MSSQL Database Memory Manager Template - v2.0 | |
| G2 MSSQL Database Miscellaneous Template | |
| G2 MSSQL Database Miscellaneous Template - v2.0 | |
| G2 MSSQL Database Resource pool Stats Template | |
| G2 MSSQL Database Resource pool Stats Template - v2.0 | |
| G2 MSSQL Database SQL Statistics Template | |
| G2 MSSQL Database SQL Statistics Template - v2.0 | |
| G2 MSSQL Database Transactions Time Template | |
| G2 MSSQL Database Transactions Time Template - v2.0 |
Global metrics
| Metric | Metric Display Name | Unit | Description |
|---|---|---|---|
| HighJump Event Queue Metric | HighJump Event Queue Metric | Count | The number of new unprocessed events. |
| msql.last.elapsed.time | Last elapsed time | microseconds (micro sec) | The elapsed time in microseconds(but only accurate to milliseconds) for the recently executed plan. |
| msql.sql.recompilations | Sql recompilations | per second(psec) | The number of statement recompiles triggered per second. |
| mssql.avg.lock.wait.time | Average lock wait time | milliseconds(ms) | The average amount of wait time (milliseconds) for each lock request. |
| mssql.batch.requests | Batch requests | per second(psec) | The number of SQL batch requests received by the server. |
| mssql.blocked.process | Blocked processes | - | The number of currently blocked processes. |
| mssql.buffer.cache.hit.ratio | Buffer cache hit ratio | Percentage(%) | The percentage of pages found in the buffer pool without having to incur a read from disk. |
| mssql.buffer.lazy.writes | Buffer lazy writes | writes per sec(wps) | The number of buffers written by buffer manager's lazy writer. |
| mssql.checkpoint.pages | Checkpoint pages | per second(psec) | The number of pages flushed to the disk per second by a checkpoint or other operations that require all dirty pages to be flushed. |
| mssql.connection.memory | Connection Memory | kilobytes(KB) | The total amount of dynamic memory the server used for maintaining connections. |
| mssql.current.db.disk.used | Current database disk space used | megabytes(MB) | The size of the current database in megabytes. |
| mssql.database.cache.memory | Database cache memory | kilobytesilo(KB) | The memory currently used by the server for database cache. |
| mssql.database.page.reads | Page reads | per second(psec) | The number of issued physical database page reads. |
| mssql.database.page.writes | Database Page writes | writes per sec(wps) | The number of issued physical database page writes. |
| mssql.db.data.file.size | Data File Size | kilobytes(KB) | The cumulative size of all the data files in the database. |
| mssql.db.transactions | Db transactions | per second(psec) | The number of transactions started for the database. |
| mssql.free.memory | Free Memory | kilobytes(KB) | The amount of memory currently not used by the server. |
| mssql.full.scans | Full scans | per second(psec) | The number of unrestricted full scans. |
| mssql.latch.waits | Latch waits | per second(psec) | The number of latch requests that are not granted immediately and had to wait before getting a grant. |
| mssql.lock.deadlocks | Deadlocks | per second(psec) | The number of lock requests that resulted in a deadlock. |
| mssql.lock.memory | Lock Memory | kilobytes(KB) | The total amount of dynamic memory the server uses for locks. |
| mssql.lock.timeouts | Lock timeouts | per second(psec) | The number of lock requests that timed out including requests for no wait locks. |
| mssql.lock.waits | Lock waits | per second(psec) | The number of lock requests that are not executed immediately and makes the caller to wait before granting the lock. |
| mssql.log.flushes | Log Flushes | per second(psec) | The number of log flushes. |
| mssql.login.count | Login Count | - | Monitors the logins in the database. |
| mssql.longest.transaction time | Longest transaction time | seconds (s) | The time (in seconds) since the start of the active transactions that are longer than any current transaction. |
| mssql.memory.grants.pending | Memory Grants Pending | - | The current number of processes waiting for a workspace memory grant. |
| mssql.memory.grantspending | MemoryGrantsPending | - | The total number of processes waiting to acquire a workspace memory grant. |
| mssql.optimizer.memory | Optimizer Memory | kilobytes(KB) | The total amount of dynamic memory used by the server for query optimization. |
| mssql.page.life.expectancy | MSSQL PageLifeExpectancy | seconds (s) | The number of seconds a page stays in the buffer pool without references. |
| mssql.page.splits | Page splits | per second(psec) | The number of page splits per second that occur as a result of the overflowing index pages. |
| mssql.process.count | Process Count | - | Monitors the current processes running in the database. |
| mssql.resource.pool.disk.read.io | Resource pool disk read IO | read operations per sec(rops) | The number of read operations from the disk in the last second. |
| mssql.resource.pool.disk.write.io | Resource pool disk write IO | writes per sec(wps) | The number of bytes written to the disk in the last second. |
| mssql.resource.pool.used.memory | Resource pool used memory | kilobytes (KB) | The amount of memory used, in kilobytes (KB), for the resource pool. |
| mssql.sql.cache.memory | SQL Cache Memory | kilobytes(KB) | Total amount of dynamic memory the used by the server for the dynamic SQL cache. |
| mssql.sql.compilations | Sql compilations | per second(psec) | The number of SQL compilations. |
| mssql.total.server.memory | Total server memory | kilobytes(KB) | The total amount of dynamic memory currently consumed by the server. |
| mssql.user.connections | User connections | - | The number of users connected to the system. |
Create custom metrics
An administrator can use one of the following methods to create custom metrics using SQL query:
Using SQL query
To create a metric using SQL query for MS SQL monitoring, navigate to Monitoring > Metrics > Create Metric. For example, to create a metric to find the day since the last backup of the database, use:
SELECT DATEDIFF(D, MAX(BACKUP_FINISH_DATE), GETDATE()) AS DAYS_SINCE_LAST_BACKUP\nFROM MSDB.DBO.BACKUPSET\nWHERE TYPE = 'D'
For more information, see Manage Metrics.
Using stored procedures
The system-defined stored procedures used in SQL server is a group of SQL requests saved into the database. The stored procedures also accept and execute according to the arguments passed into the procedures. For example,
database_name,mirroring_state::EXEC sp_dbmmonitorresults @dbname@ @mssql.storedprocedure.param1@ @mssql.storedprocedure.param2@
Prerequisite
Define stored procedures in the target server.If you want to monitor the MS SQL server using stored procedures, perform the following:
Step 1: Create metrics
Create metrics to understand the performance and availability of your MS SQL server. Add stored procedures query while creating metrics. For more information, see Managing Metrics.
SQL query syntax:
sp_dbmmonitorresults database_name, rows_to_return, update_status
If there are no column values, use the syntax:
EXEC sp_dbmmonitorresults @dbname@ @mssql.storedprocedure.param1@ @mssql.storedprocedure.param2@
For example,
EXEC sp_dbmmonitorresults msdb, 0, 0;
The @dbname@ attribute is optional.
Step 2: Create monitors
Add MS SQL stored procedure parameters and select the parameters to be passed into the procedures while creating monitors. For more information, see Manage Monitors.
The parameters added in the configuration parameters are aligned with the arguments provided in the SQL query while creating the metric.
Step 3: Create template
Create gateway-based templates to add the stored procedure monitors. For more information, see Create Templates.
Step 4: Assign templates
After creating a template, assign them to the resources. For more information, see Assign Templates.
Assign templates from setup
Assign MSSQL templates to one or more resources for a selected client and modify the configuration parameters while assigning templates. For more information, see Assign Templates from Setup.
Assign templates at the device level
Applying MSSQL templates at the device level helps assign one or more templates to a specific resource. You can change the configuration parameter default values while assigning the templates. For more information, see Assign Templates at the Device Level.
Template configuration parameters:
| Configuration Parameter | Description |
|---|---|
| Connection Time Out | The maximum time to connect to the database. The driver waits for the specified time before timing out due to connection failure. The default time is 15000 milliseconds(ms). |
| Service Transport Type | To configure the database at a secure end-point. The default type is In-secure. The connection is Secure when the data sent between the client and server is encrypted. |
| Service Port | The port number where the database is running. The connection is made to the specified port if you specify the port and the database name. The default port is 1433. |
| DB Instance Name | The name of the database to connect to. The default name is master.
|
| Authentication Type | The authentication mechanism selected to authenticate the databases. The default mechanism is SQL Server Authentication. If the credentials are Windows-based, use Windows NTLM Authentication. |
| Application Type | The application type value to identify the adapter. For example, MSSQL. Warning: Do not change the default application type value. |
| Stored Procedures | To know the latest status of the monitored server using the configured parameters in the monitor. |
Assign template from device management policies
Device management policies help manage resources. You can assign monitoring templates, knowledge base articles, and custom attributes using device management policies. The device management policy can be applied to one or a set of resources. For more information, see Creating Policies.
View resource metrics
The gateway monitors the application using the assigned templates and displays the results in graphical format. To view resource metrics, click the desired database resource name > resource Details > Metrics.
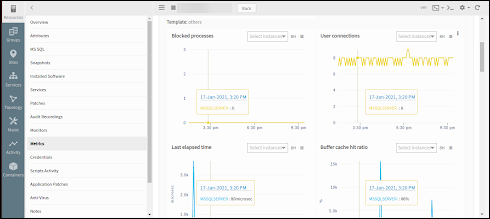
MSSQL
Troubleshooting
Verify the following if the graphs are not plotted correctly:
- The resource is accessible and Telnet is established for the IP address and port.
- Valid credentials are used for the resource.
If you experience MSSQL monitoring issues, follow these troubleshooting steps:
- Verify server and gateway connectivity using Ping.
ping <IP Address>
Example:
ping 12.26.105.173
- Verify Telnet-to-server listening port connectivity.
telnet <IP Address> <Port>
Example:
telnet 172.26.105.173 1433
- Execute the following commands from GCLI to verify the database connectivity:
gcli
db <Database Type> <IP Address> <User Name> <Password> <Port> <Database Name> <Connect Timeout> <ReadTimeout> <Secure Flag> <Query>
Example:
db mssql 172.26.105.173 root Pass@123 5432 master 15000 10000 insecure "select * from msdb.dbo.suspect_pages"
From gateway version 5.3.0, use the following format to execute the command along with the result-set:
db <Database Type> <IP Address> <User Name> <Password> <Port> <Database Name> <Connect Timeout> <Read Timeout> <Secure Flag> <ResultSet?: Yes/No> <Query>
Example:
db mssql 172.26.105.173 root Pass@123 5432 master 15000 10000 insecure Yes "select * from msdb.dbo.suspect_pages"