Introduction
Oracle Database is a multi-model database management system produced and marketed by Oracle Corporation.
Monitoring your OracleDB includes:
- Determining relevant metrics according to your business needs. Create custom SQL metrics and apply to the database.
- Track and analyze the monitoring metrics.
- Check the availability of the database.
Prerequisites
- Database and port(1521) can be accessed by the gateway.
SELECT ANY DICTIONARYprivilege to monitor the database. For more information, see Monitoring Privileges.- A gateway management profile mapped to a resource.
- Create credentials with type Database before assigning a template to a resource. The Port, Connection Time Out, and Is Secure values are not used to create credentials.
Supported version
OracleDB version 12.2.0.2 or higher.
Database discovery and monitoring
The administrator can deploy an agent or gateway to support OracleDB agent-based or agentless monitoring.
Discovery using the gateway
The gateway establishes a connection to the database using the Java Database Connectivity (JDBC) Java API and collects metrics using SQL queries. To monitor an OracleDB, install gateway version 5.0.0 or later.
Use one of the following mechanisms to discover OracleDB servers to add them to your inventory:
- WMI
- SSH
- SNMP
Optionally, add a database server manually to the infrastructure inventory.
To add a resource manually to the inventory:
- Select Infrastructure.
- Click the Settings > Resource > Add.
- From the Add Device window, provide the required details such as Device Type and Management Profile.
- Click Save.
Prepare the device to start monitoring
To monitor OracleDB:
- Associate appropriate database credentials to the discovered database.
- Assign one or more database-specific global monitors or templates on the device.
Optionally, create custom metrics or monitors using SQL queries and assign them to the database.
To track monitoring of OracleDB database in your cloud environment, see Monitoring Cloud Database using Gateway.
Global templates and metrics
Global templates
| Collector Type | Template Name | Gateway | G2-OracleDB-Oracle Library Stats |
|---|---|
| G2-OracleDB-Oracle Library Stats - v2.0 | |
| G2-OracleDB-Oracle Memory | |
| G2-OracleDB-Oracle Memory - v2.0 | |
| G2-OracleDB-Performance | |
| G2-OracleDB-Performance - v2.0 | |
| G2-OracleDB-Sessions | |
| G2-OracleDB-Sessions - v2.0 | |
| G2-OracleDB-System Stats | |
| G2-OracleDB-System Stats - v2.0 | |
| G2-OracleDB-System Summary | |
| G2-OracleDB-System Summary - v2.0 | |
| G2-OracleDB-Table Space | |
| G2-OracleDB-Table Space - v2.0 |
Global metrics
| Metric | Metric Display Name | Unit | Description |
|---|---|---|---|
| oracle.active.sessions | Active Sessions | count | Monitors the active sessions. |
| oracle.asm.archive.pct | Oracle ASM Archive pct | percentage(%) | Oracle query for ASM ARCHIVE diskgroup. |
| oracle.asm.data.pct | Oracle ASM Data pct | percentage(%) | Oracle query for ASM DATA diskgroup. |
| oracle.blocking.lock.queries | Oracle Blocking Lock Queries | count | Validates the number of block lock queries on a specific database. |
| oracle.blocking.session | Oracle Blocking Session | count | To monitor blocked valid sessions. |
| oracle.BufferCacheHitRatio.pct | Oracle BufferCacheHitRatio pct | percentage(%) | To monitor buffer cache hit ratio value in percentage. |
| oracle.cache.blocks.lost | Cache Blocks Lost | count | The number of global cache blocks lost over the user-defined observation period. |
| oracle.cache.invalidations | Oracle Cache Invalidations | count | Validates the number of cache invalidations on a specific database. |
| oracle.check.db.alive | Check Db Alive | Monitors database instance connectivity. | |
| oracle.cpu.usage.per.sec | CPU Usage Per Sec | persecond(psec) | The CPU usage per second by the database processes measured in hundredths of a second. |
| oracle.cpu.usage.per.txn | CPU Usage Per Txn | percentage(%) | The amount of CPU usage per transaction for a specific task or session. |
| oracle.database.cpu.time.ratio | Database CPU Time Ratio | percentage(%) | The Database CPU Time Ratio is calculated by dividing the amount of used CPU in the database by the amount of total database time. Total database time is the time spent by the database on user-level calls . |
| oracle.database.wait.time.ratio | Database Wait Time Ratio | percentage(%) | Monitors the database wait time ratio. |
| oracle.db.instance.uptime | DB Instance Uptime | days | The db instance uptime since start up. |
| oracle.disk.sort.ratio.pct | Oracle Disk Sort Ratio pct | percentage(%) | To monitor disk sort ratio value in percentage. |
| oracle.duplicated.filename.count | Oracle Duplicated Filename Count | count | To check the existence of duplicated db filenames in different ASM paths. |
| oracle.executions.per.sec | Executions Per Sec | Persecond(psec) | The average transactions per second |
| oracle.executions.per.txn | Executions Per Txn | The average amount of time per execution | |
| oracle.failed.logon.count | Failed Logon Count | count | Monitors the failed logon attempts of the current user. |
| oracle.inactive.sessions | Inactive Sessions | count | Monitors the inactive sessions. |
| oracle.invalid.objects | Invalid Objects | count | Checks for invalid objects in a database. |
| oracle.io.wait.time | IO Wait Time | milliseconds(ms) | The total time taken to complete the I/O operations keeping the application in a blocked state. |
| oracle.java.pool.free | Java Pool Free | megabytes(MB) | Monitors the free java pool memory in MB. |
| oracle.large.pool.free | Large Pool Free | megabytes(MB) | Monitors the free large pool memory in MB. |
| oracle.library.cache.gets | Oracle Library Cache Gets | count | Validates the number of library cache gets by the database. |
| oracle.library.cachereloads | Library Cache Reloads | Validates the number of library cache reloads by the database. | |
| oracle.librarycachehitratio.pct | Oracle Library Cache Hit Ratio pct | percentage(%) | To monitor the library cache hit ratio value in percentage. |
| oracle.logons.per.sec | Logons Per Sec | count | The number of logons per second during the sample period. |
| oracle.long.running.queries | Oracle Long Running Queries | count | Validates the number of long running queries on a specific database. |
| oracle.maxdbfilepct.usage | Oracle Max DB File pct usage | percentage(%) | To monitor the percentage of open oracle files. |
| oracle.maxopencursor.username.count | Oracle Max Open Cursor Username Count | count | To monitor maximum open cursor value for each db username. |
| oracle.process.count | Process Count | Monitor the current processes running in the database. | |
| oracle.procsused.pct | Oracle Processes Used pct | percentage(%) | To monitor db process usage in percentage. |
| oracle.rac.tablespace.space.used | Oracle RAC Tablespace Space Used Top 20 Greaterthan 85 | percentage(%) | To monitor top(20) RAC tablespace space usage where percentage > 85%. |
| oracle.redo.log.space.requests | Redo Log Space Requests | Req per Sec | The number of requests per second by Oracle waiting for disk space allocation for the redo log entries. |
| oracle.redolog.switch.count | Oracle Redolog Switch Count | count | To monitor the number of redolog switch. |
| oracle.sequence.pctused | Oracle Sequence Pct Used | percentage(%) | To monitor the sequence usage in percentage. |
| oracle.session.cpu_used | Session Cpu Used | seconds(s) | Monitors the session cpu usage in seconds. |
Create custom metrics
To create a metric using SQL query for OracleDB monitoring, navigate to Monitoring > Metrics > Create Metric. For example, to create a metric to check the DB instance use:
SELECT INSTANCE_NAME, DATABASE_STATUS FROM V$INSTANCE
For more information, see Manage Metrics.
Assign templates from setup
Assign OracleDB templates to one or more resources for a selected client and modify the configuration parameters while assigning templates. For more information, see Assign Templates from Setup.
Assign templates at the device level
Applying Oracle templates at the device level helps assign one or more templates to a specific resource. You can change the configuration parameter default values while assigning the templates. For more information, see Assign Templates at the Device Level.
Template configuration parameters:
| Configuration Parameter | Description |
|---|---|
| Connection Time Out | The maximum time to connect to the database. The driver waits for the specified time before timing out due to connection failure. The default time is 15000 milliseconds(ms). |
| Service Transport Type | To configure the database at a secure end-point. The default type is In-secure. The connection is Secure when the data sent between the client and server is encrypted. |
| Service Port | The port number where the database is running. The connection is made to the specified port if you specify the port and the database name. The default port is 1521. |
| DB Instance Name | The name of the database to connect to. The default name is system.
|
| Application Type | The application type value to identify the adapter. For example, ORACLE_DB. Warning: Do not change the default application type value. |
Assign template from device management policies
Device management policies help manage resources. You can assign monitoring templates, knowledge base articles, and custom attributes using device management policies. The device management policy can be applied to one or a set of resources. For more information, see Create Policies.
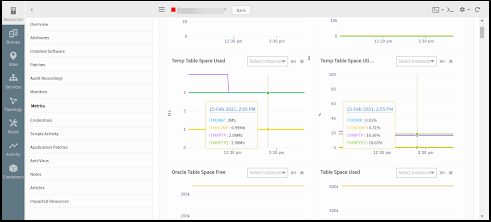
View resource metrics
The gateway monitors the application using the assigned templates and displays the results in graphical format. To view resource metrics, click the desired database resource name > resource Details > Metrics.
Troubleshooting
Verify the following if the graphs are not plotted correctly:
- The resource is accessible and Telnet is established for the IP address and port.
- Valid credentials are used for the resource.
If you experience OracleDB monitoring issues, follow these troubleshooting steps:
- Verify server and gateway connectivity using Ping.
ping <IP Address>
Example
ping 12.26.105.173
- Verify Telnet-to-server listening port connectivity.
telnet <IP Address> <Port>
Example
telnet 172.26.105.173 1433
- Execute the following commands from GCLI to verify the database connectivity:
gcli
db <Database Type> <IP Address> <User Name> <Password> <Port> <Database Name> <Connect Timeout> <ReadTimeout> <Secure Flag> <Query>
Example
db oracleDB172.26.105.173 root Pass@123 5432 orcl 15000 10000 insecure "SELECT count(*) AS ACTIVE_SESSIONS from v$session where status='ACTIVE’"
From gateway version 5.3.0, use the following format to execute the command along with the result-set:
db <Database Type> <IP Address> <User Name> <Password> <Port> <Database Name> <Connect Timeout> <Read Timeout> <Secure Flag> <ResultSet?: Yes/No> <Query>
Example
db mssql 172.26.105.173 root Pass@123 5432 orcl15000 10000 insecure Yes "SELECT count(*) AS ACTIVE_SESSIONS from v$session where status='ACTIVE'"