Introduction
Monitoring provides 360-degree visibility for applications, servers, virtualization, containers, synthetics, storage, and network devices.
A monitor is a mechanism to check a device periodically for its behavior and performance. Using monitoring, you can gather information and keep track of the performance of your target resources.
As part of the onboarding process:
- All resources in your network are discovered and managed.
- Monitoring templates are assigned to monitor resources according to the configured metrics.
- Timely alerts are raised for quick action.
Note
The dashboard acts as a window to monitor the health, performance, and availability of resources.Monitoring process flow
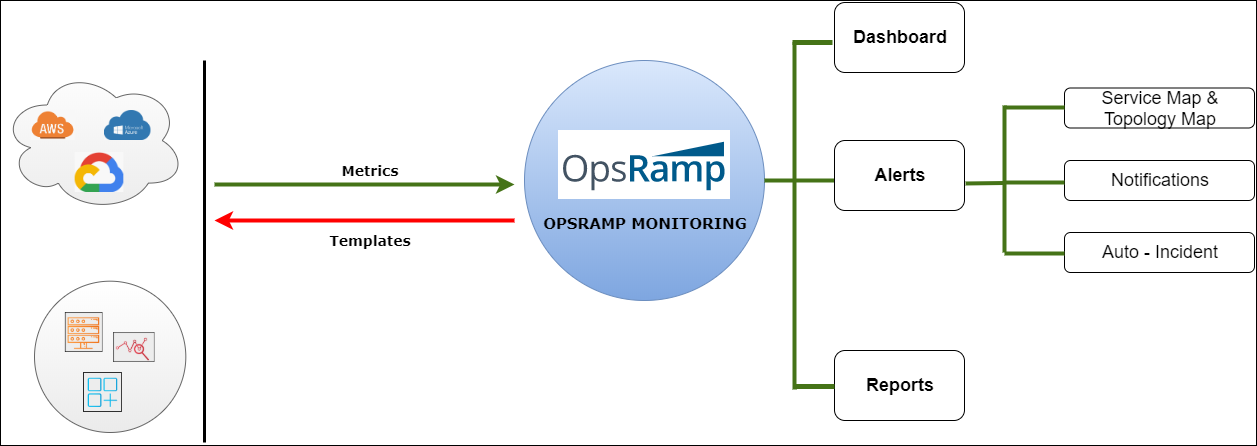
Monitoring Architecture Diagram
The monitoring management process flow involves the following:
| Concept | Description |
|---|---|
| Metrics | Metrics are atomic elements indicating the exact attributes that help you retrieve the health and performance of the target resource or application. |
| Monitor | A monitor is a logical group of metrics that you can customize as desired to monitor any specific technology or resource. |
| Template | Templates contain a group of monitors that are applied on either single or multiple devices. |
The following mechanisms are used to monitor devices:
- PING: PING monitoring continuously checks hosts for availability to detect connection failures. PING measures the packet loss and round trip time using ICMP.
- SNMP: Simple Network Management (SNMP) Protocol is a well-known and popular protocol for network management used for collecting information and configuring network devices such as Servers, Printers, Hubs, Switches, and Routers on an Internet Protocol (IP) network.
- WMI: Windows Management Instrumentation (WMI) describes the processes and utilities required to scan systems remotely for early warning signs of potential failure. WMI is the primary management technology for Microsoft Windows operating systems.
- API: OpsRamp uses application-specific APIs to monitor application or devices.
Monitoring methods
Monitor your resources from OpsRamp using the following methods:
| Method | Description |
|---|---|
| Templates | Apply a monitoring template to a particular target resource or a set of target resources of the same type. |
| SNMP Traps | Monitor your SNMP devices using SNMP Traps configurations. You can create SNMP Trap monitors and receive traps for the desired devices. |
| Synthetic Monitoring | Track the performance of your websites and internet services and remove bottlenecks before impacting the performance of your website. |
| Gateway based Application Monitoring Adapters | Monitor your applications using OpsRamp Gateway using the application monitoring adapters before impacting the performance of your website. |
| Custom Monitors | Create Agentless Custom Monitors for Linux and Windows devices. |
| Event Log Monitoring | Monitor the event logs generated in the system viewer of all Windows devices in your network. |
| Native Monitors | You can add monitors, such as StatsD, Process Statistics, Linux File Integrity monitor, to monitor certain attributes in your Windows and Linux devices. |
After monitoring your resources, track the responses from the Alerts view, Metrics and Monitors tab in Infrastructure.
Types of monitors
OpsRamp supports two types of monitors:
- Native Monitors
- Custom Monitors
Native monitors
The following native monitors are provided to help you monitor the IT infrastructure.
- Performance Monitors
- Application Monitors
- SNMP Monitors
- Event Log Monitors
- Process Monitors
- Service Monitors
Note
These monitors can be used with modifications.Custom monitors
A custom monitor is a user-defined monitor that enables you enables you to write OpsRamp-supported scripts to expand your monitoring metrics beyond native monitors.
OpsRamp supports two types of custom monitors:
- Agent Custom Monitors
- Agentless Custom Monitors
OpsRamp supports the following types of execution modes:
- BATCH FILE
- COMMAND
- EXE
- PERL
- PHP
- POWERSHELL
- PYTHON
- SHELL
- VBS
Monitoring integration failures
Events generated from integration failures (both inbound and outbound configurations) can be monitored.
- Alerts are generated when an integration failures occur.
- Metrics are provided to monitor integration failures.
- Templates are available to create and assign to the integration.