Introduction
The administrators can now apply G2 process monitoring templates along with the existing G1 templates for Windows and Linux devices. The G2 monitoring templates provide the flexibility to configure thresholds and filtering at the component level.
Applying G2 process statistics monitors
OpsRamp offers the following Global Templates that you can apply to monitor the Windows and Linux devices.
| Template Name | Supported Metrics |
|---|---|
| Agent G2 - Windows Process Monitoring | System.windows.process.count System.windows.process.handlecount System.windows.process.pagefilebytes System.windows.process.processorcoretime.percent System.windows.process.processortime.percent System.windows.process.threadcount System.windows.process.workingset |
| Agent G2 - Linux Process Monitoring | system.process.stats.count system.process.stats.cpu system.process.stats.memory system.process.stats.threads system.process.stats.open.fds |
To apply a template:
- Select a client from the All Clients list.
- Go to Infrastructure > Resources.
- From Resources, click the desired Resource Name > Resource Details > Monitors > Template.
- From the Templates screen, click +Assign Templates.
- From Apply Templates > Select Templates > Available templates, select the desired templates.
The Selected templates section displays the chosen templates. - Click Assign.
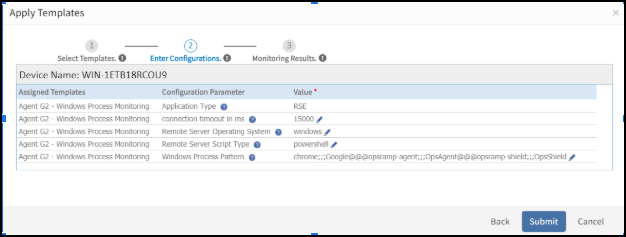
- From the Enter Configurations section, provide a Value for the configuration parameters.

Apply Template
- Click Submit.
The Templates screen displays the selected templates.
After applying the template to a device, validate the template to ensure that it is assigned to a resource.
Configuration parameters (Windows process pattern and Linux process pattern)
Use the following input argument format for Windows process and Linux process patterns: processname@@@processname@@@processname. This format provides a delimiter (@@@) separation for the regex patterns while monitoring multiple processes. The processname provided in the format is the name of the process that you want to monitor, for example, a regular expression string. The Agent supports every basic and extended regular expressions such as:
- PowerShell-based regular expressions for Windows.
grepwith-Eswitch-based regular expressions for Linux.
For example,
- opsramp-agent@@@opsramp-shield: The component name is the respective process name.
- opsramp-.*@@@chrome: The component name is the respective process name and other process names matching with a given regular expression.
- (ntpd|chrond)@@@notepad.*: The component name is the process name matching with a given regular expression. For example, if the string
notepad.*matches with two process names such asnotepad.exeandnotepad++.exe. The component names are Notepad and Notepad++.
Important
- Use respective display names for each component while monitoring the same process with different arguments. For example,
processPattern1;;;DisplayName1@@@processPattern2;;;DisplayName2. The component names are the display names for the respective process patterns. - Provide the same display name while configuring component filter or component thresholds at the template or device level. For example,
svchost.*NetworkService;;;svchost_NetworkService@@@svchost.*DcomLaunch;;;svchost_DcomLaunch. Use the component namesvchost_NetworkServiceandsvchost_DcomLaunchwhile defining the component filters and component thresholds.
Collecting data
The collected metrics can be viewed with the following name in Infrastructure > Resources > Device Details > Monitors > Monitors.
- Windows: Agent G2 - Windows Process Monitoring
- Linux: Agent G2 - Linux Process Monitoring
Validating templates
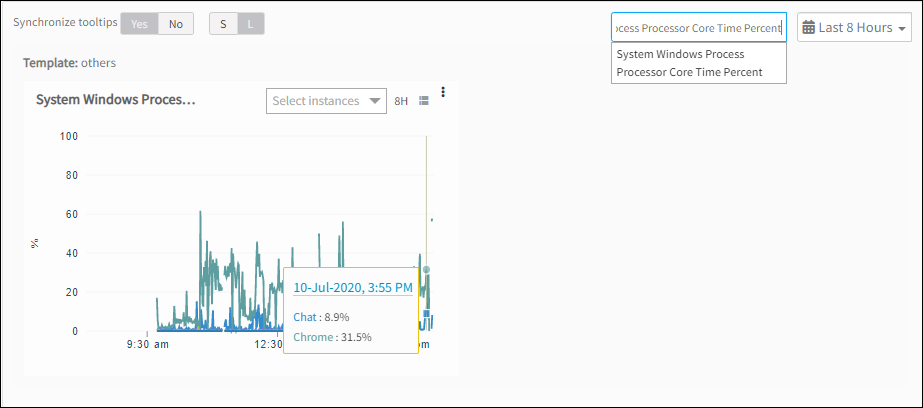
The graphical data is displayed for each metric name configured in the process statistics monitor. The graphs can be viewed under Infrastructure > Resources > Device Details > Metrics. Use the metric drop-down menu to view the graph for each metric.
Validate Template
Process statistics alert
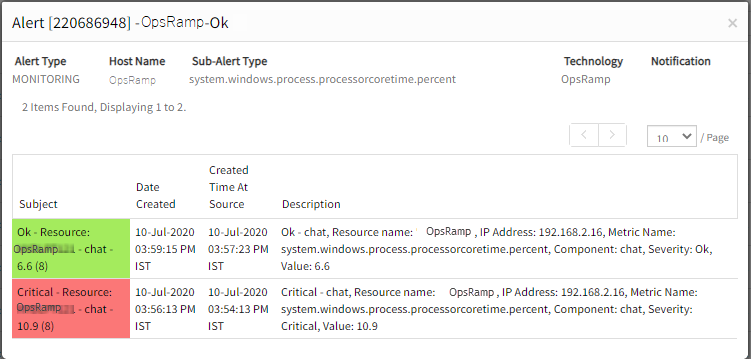
All alerts are sent while monitoring processes and can be viewed in the Alert browser. Examine the alert subject to verify process alert details.
Process Alerts