Introduction
Analyzing and tracking issues in a log file during emergencies can be a challenge for administrators. The log file monitor tracks errors in logs generated from applications on Windows and Linux servers. The benefits of log file monitoring include:
- Monitor log data for any particular event or pattern
- Identify errors for any failure
- Improved security
A log file maintains a record and timestamp of events that occur in an application. The agent examines log files with a known search string (or pattern) based on the configured check type. If the agent detects a match, an alert is triggered in the alert browser. The system monitors log files including audit logs, transaction logs, and event logs. Different varieties of log file extensions can be used, however, .log is recommended for logs that are monitored.
Log management can be a complex task maintaining log file size, applying a file checksum, and making it easy for administrators to search through old log data files to locate errors. Log rotation compresses old data (and large data) into a new log file. This process simplifies log management while allowing more space for new logs.
By using log file monitors, administrators can rule out the chance of missing an error in logs. Log file monitors can be added using Setup > Monitoring > Templates > Other Monitors.
Creating log file monitors
To create a log file monitor:
- Select a client from the All Clients list.
- Go to Setup > Monitoring > Templates.
- From TEMPLATES, click +Add. The monitor template appears.
- From MONITOR TEMPLATE, provide the details for the following parameters and click Save:
- Select Template Scope: The partner template or client-specific template. For the client-specific template, select the client.
- Collector Type: The application type used to gather information. Select the agent.
- Applicable for: The type of the application.
- Template Name: The name of the template.
- Description: The summary of the template.
- Generation: The generation that the template belongs to. For example, Generation 2.
- Tags: The user-defined tags used for enhanced filtering.
- Prerequisites: The essential prerequisites to consider while monitoring using a template. For a Windows template, as an example, check the SQL services while monitoring SQL parameters.
- Status: The active or end-of-life templates.
- Notes: Additional information to add to the template.
- Template Family Name: The category that applies to the application. For example, Windows server, storage server, and network server.
- Deployment Type: Select one of the following methods to apply the template to resources:
- Custom
- Optional
- Standard
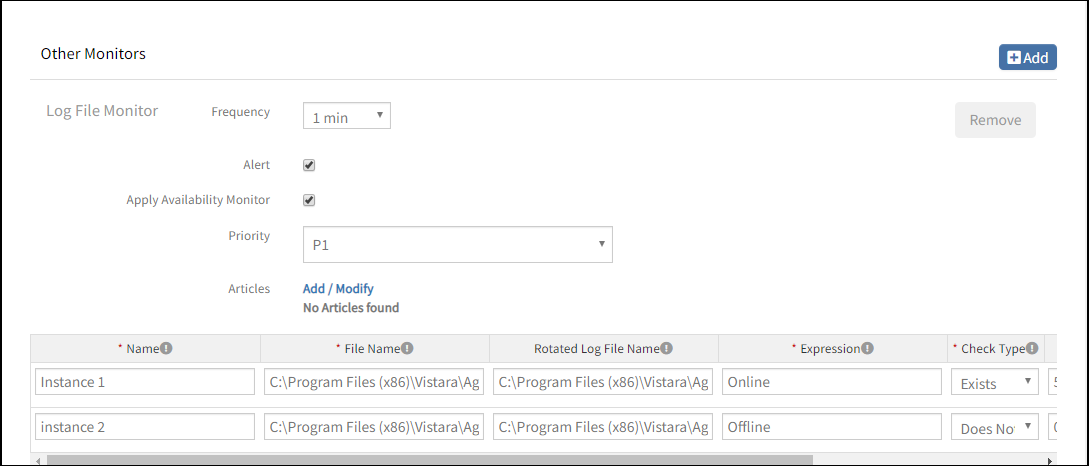
- After configuring the template, go to Other Monitors and click +Add. The other monitors screen appears.
Other Monitors screen appears. - From the options displayed in the Monitor Type drop-down, select log file monitor. The log file monitor section appears.
- From Log File Monitor, click Add to provide more detailed parameters.
Add and Remove to increase or decrease the following settings. (Regular expression formats are supported for log file names, rotated log file names, and expressions.)- Frequency: The intervals used to monitor the log files. The recommendation is 15 minutes.
- Alert: Select Alert to receive alerts for any match. Critical Alerts are only sent while monitoring the log files.
- Apply Availability Monitor: Select the checkbox to show the availability of the log monitors.
- Priority: The priority of the alert.
- Name: The key (or instance) used to identify the search string.
- File Name: The name of the primary log file and its path. A file extension of .log` is recommended.
- Rotated Log File Name: The name of the secondary log file that contains data moved from the primary log file.
- Expression: The search string used to search the log file. An alert is sent with a match.
- Check Type: The instance used when an alert is sent. An alert is sent if the search string exists in the log file within the threshold number. Choose from one of the following:
- Exists
- Does Not Exist
- Threshold: The occurrence of the search string in the log file. An alert is sent if the search count is greater than or equal to the threshold.
Add Log File Monitor
TEMPLATES screen displays the new Template.
After adding a template with StatsD monitor, assign the template to a device to start monitoring.
Managing log file monitors
File log monitor details can be viewed and modified when added to a template. Perform the following actions to manage the log file monitor:
- Edit: Click the template name displayed on the templates screen to modify the monitor details.
- View: View the monitor details in the templates list screen. Click the arrow next to the template name to view the log file monitor added to the current template.
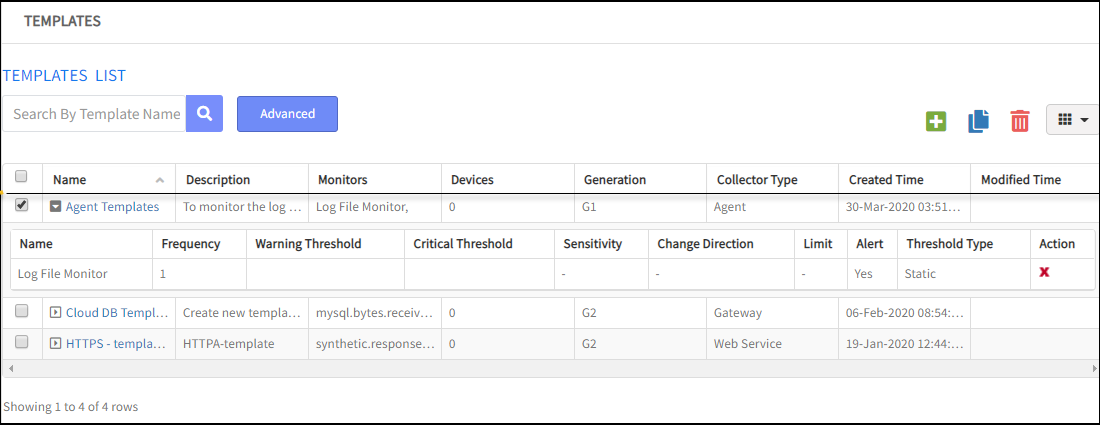
Manage Log File Monitors
Log monitor alerts
Critical alerts are sent while monitoring log files. View the alerts in the Alert browser. Examine the inverse flag in the alert description to verify the check type.
The inverse flag displays 0 if the check type exists. The alert description displays 50 characters from the last occurrence of the search string in one iteration.
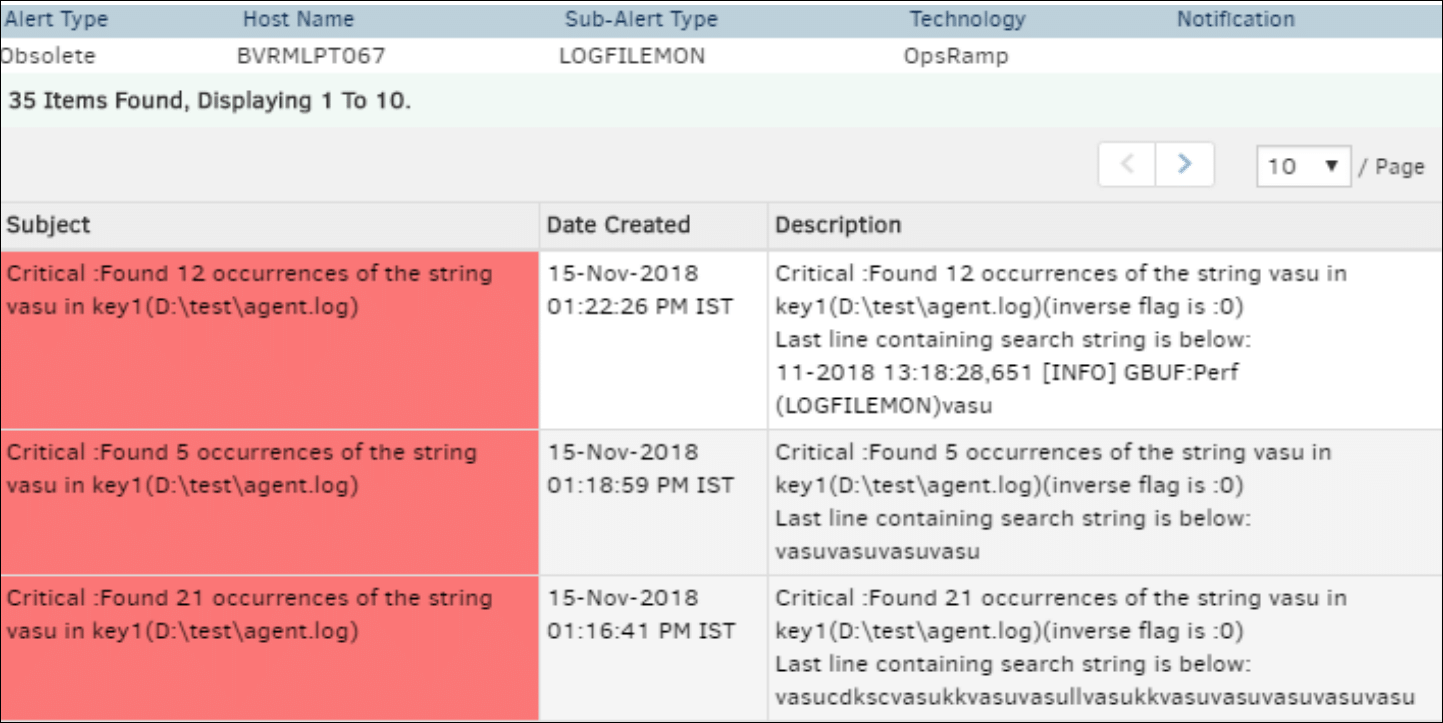
Check Type is Exist
The inverse flag displays 1 if the check type does not exist.
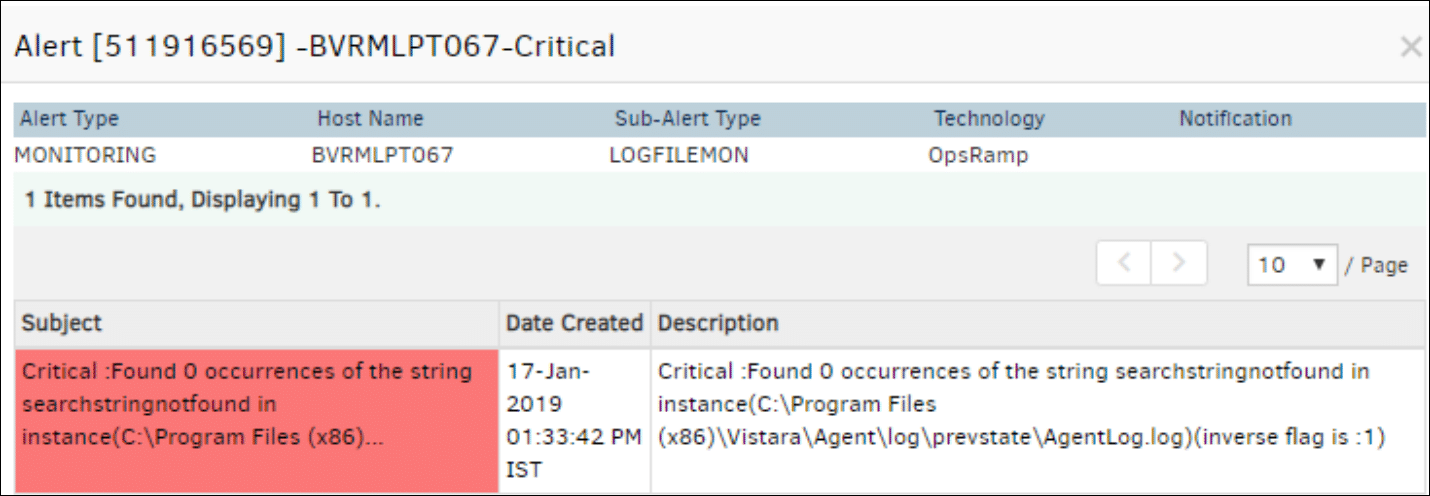
Check Type is Does Not Exist
Important
A critical alert is sent for missing log files and sends anOK alert after the retrieval of the same file.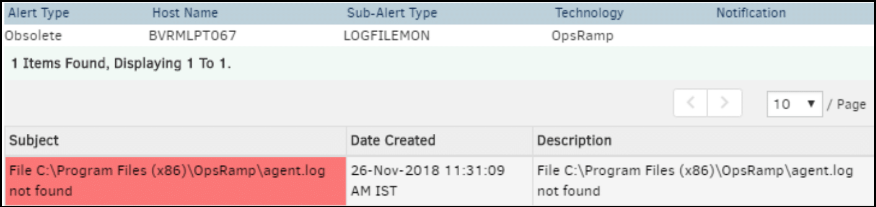
File Not Found
Log monitor graphs
The graphical data is displayed for each name configured in the log file monitor. Monitor graphs can be viewed under Infrastructure > Resources > Device Details > Metrics. Only one graph is displayed for all configured names in an individual log file monitor. The log file monitor graph is different for Windows and Linux devices.
Windows
In Windows devices, OpsRamp plots the graph as follows:
1: The input string exists0The input string does not exist
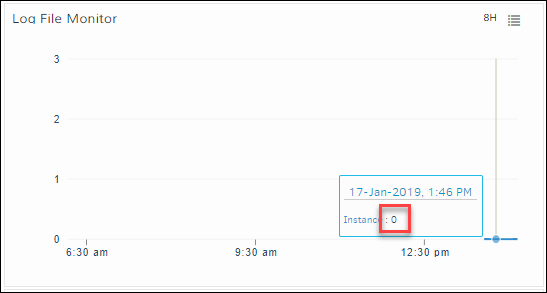
Windows Devices
Linux
For Linux devices, graphs plot according to the search string count. For example, if the search string appears 6 times in the log file, the log monitor graph displays the instances according to the number of times the search string appears in the log file.
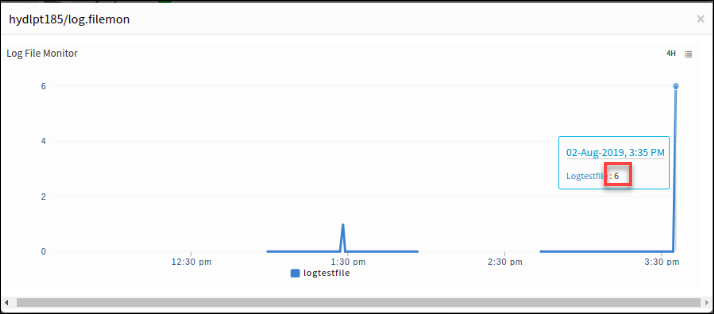
Linux Devices
Limitations
Log file monitor graphs have the following limitations:
- Log files with
.exeand.rarfile extensions are not supported. - Regular expressions are not supported in folder names.
- Up to 20 sections can be added.