Introduction
The TCP connection statistical monitor collects data for active opens, passive opens, attempt fails, connection rests, and current connections. TCP connections statistics are monitored against a threshold value. Alerts are sent when connections surpass threshold values.
Using the TCP connection statistics monitor, various types of TCP connections can be monitored. File check monitors can be added using Setup > Monitoring > Templates > Other Monitors.
After applying the template to a device, the template can be validated if it is assigned to a resource. For more information, see Validate Template.
Creating TCP connection statistics monitor
To create a file check monitor:
- Select a client from the All Clients list.
- Go to Setup > Monitoring > Templates.
- From TEMPLATES, click +Add. The monitor template appears.
- From MONITOR TEMPLATE, provide the details for the following parameters and click Save:
- Select Template Scope: The partner template or client-specific template. For the client-specific template, select the client.
- Collector Type: The application type used to gather information. Select the agent.
- Applicable for: The type of the application.
- Template Name: The name of the template.
- Description: The summary of the template.
- Generation: The generation that the template belongs to. For example, Generation 2.
- Tags: The user-defined tags used for enhanced filtering.
- Prerequisites: The essential prerequisites to consider while monitoring using a template. For a Windows template, as an example, check the SQL services while monitoring SQL parameters.
- Status: he active or end-of-life templates.
- Notes: Additional information to add to the template.
- Template Family Name: The category that applies to the application. For example, Windows server, storage server, and network server
- Deployment Type: Select one of the following methods to apply the template to resources:
- Custom
- Optional
- Standard
- After configuring the template, go to Other Monitors and click +Add. The other monitors screen appears.
- From the options displayed in Monitor Type drop-down, select TCP connection statistics. The TCP connection statistics screen appears.
- From TCP Connection Statistics section, click Add to provide more detailed parameters.
Click Add and Remove to increase or decrease the following settings:- Frequency: The intervals used to monitor the connection. The recommendation is 15 minutes.
- Alert: Select Alert to receive alerts for any match.
- Apply Availability Monitor: Select the checkbox to show the availability of the monitors.
- Priority: The priority of the alert.
- Name: The unique identifier for the file.
- Warning: The threshold for TCP connections when the agent sends warning alerts.
- Critical: The threshold for TCP connections when the agent sends critical alerts.
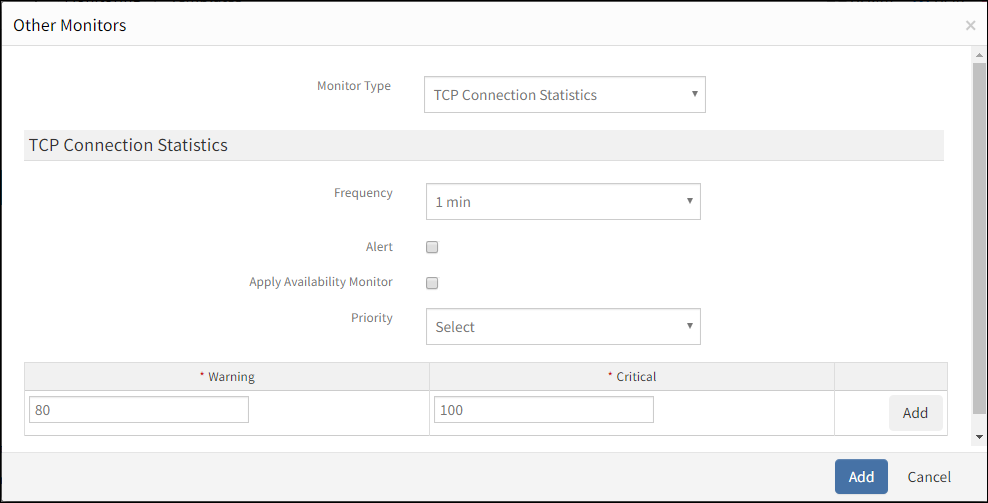
Add TCP Connection Statistics
The agent sends the following alerts:
- Warning alert if the TCP connections cross the warning threshold.
- Critical alert if the TCP connections cross the critical threshold.
After adding a template with a TCP connection, assign the template to a device to start monitoring.
Managing TCP connection statistics
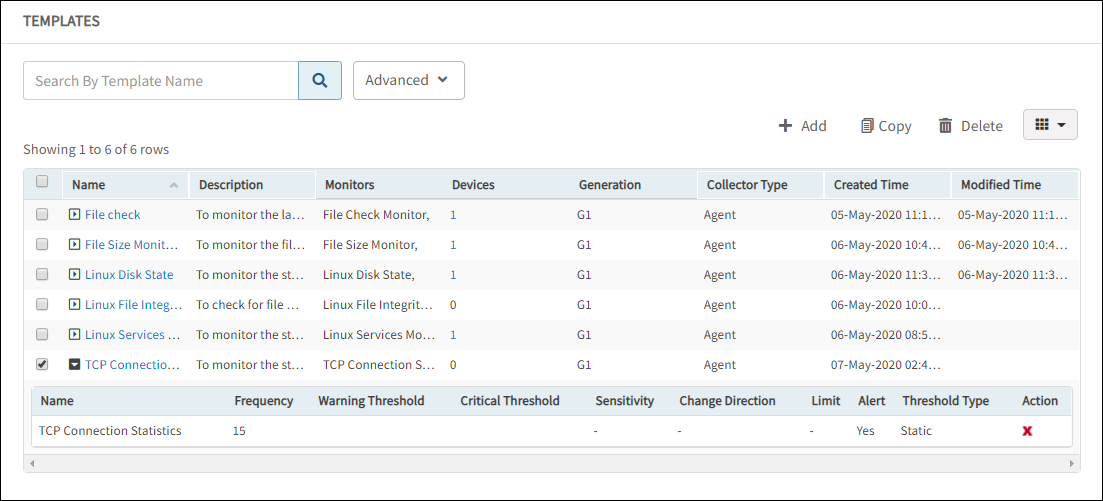
TCP connection statistics details can be viewed and modified when added to a template. Perform the following actions to manage the TCP connection statistics monitor:
- Edit: Click the template name displayed on the templates screen to modify the monitor details.
- View: View the monitor details in the templates screen. Click the arrow next to the template name to view the TCP connection monitor added to the current template.
Manage TCP Connection Statistics
Collecting data
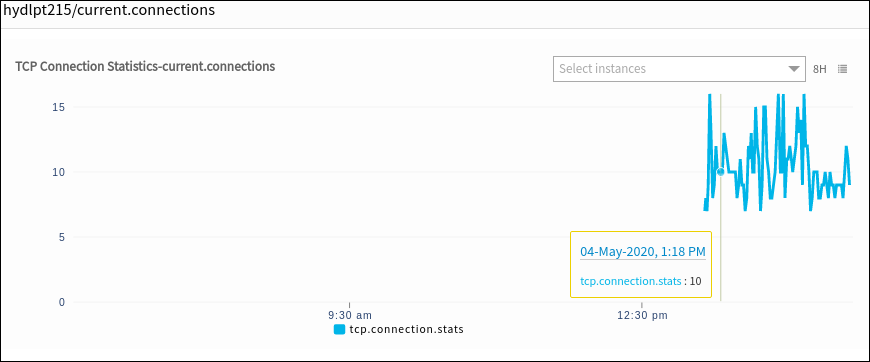
You can see the collected metrics with the name: TCP Connection Statistics in Infrastructure > Resources > Device Details > Monitors > Monitors.
Validating templates
The graphical data is displayed for each name configured in the TCP connection statistics monitor. Monitor graphs can be viewed under Infrastructure > Resources > Device Details > Metrics.
Validate Template
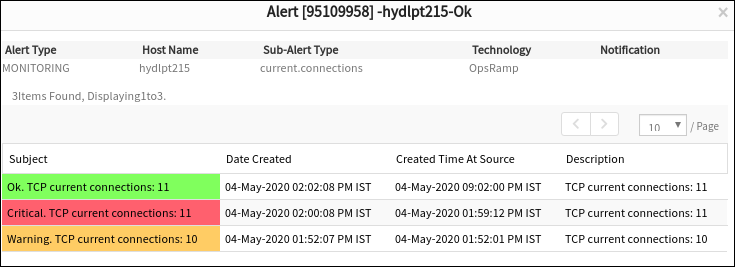
TCP connection statistics alerts
Only critical alerts are sent while monitoring TCP current connections and can be viewed in the Alert browser. Examine the alert subject to verify details of the alert.