Viewing alert sequence clusters
The Alert Sequence Clusters window provides details of the alert sequences detected from the existing alert data and sequences related to an inference. The detected alert sequences are unmodified sequences fetched from the existing alert data.
Similar alert sequences are grouped together. The grouping provides a count that explains the number of times alerts are triggered in a certain sequence.
The alert sequence clusters window serves as a verification of the ML correlation. For example, if ML (machine learning) correlates alerts cpu.utilization and system.ping together, use the Alert Sequence Clusters window to find the sequences that have cpu.utilization and system.ping together.
Viewing alert sequences detected from the existing alert data
To view the alert sequences detected from existing alert data:
- Select a client from the All Clients list.
- Go to Setup > Alert Management > Alert Correlation.
- Click an ML-based alert correlation policy.
Note: To easily identify an ML-based policy, check status. Status states include: Training Started and Ready. - From the Policy Definition field, click Detected alert sequence patterns in alert data.
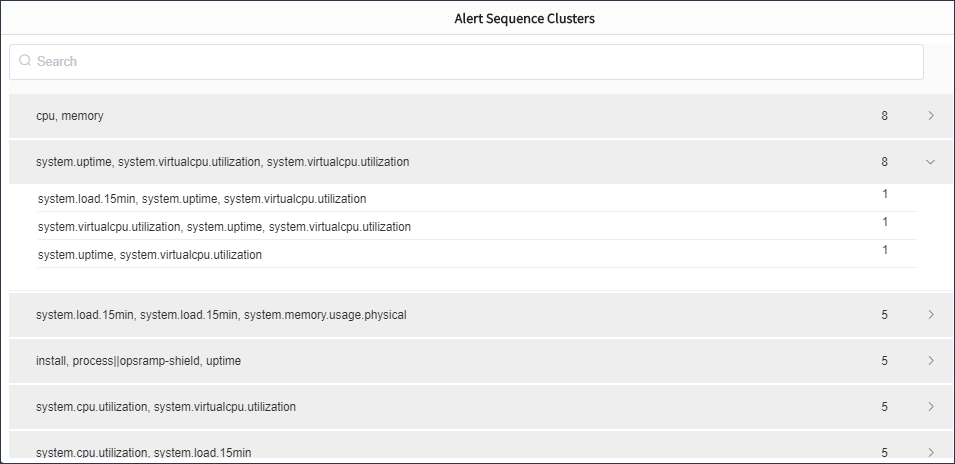
The alert sequences displayed on the Alert Sequence Clusters window are the top alert sequences.
Expand an alert sequence to view the sub-sequence clusters.
Alert Sequence Cluster Metrics
Enter the required alert metric in the search box to fetch the results of a particular alert sequence. The alerts sequences that match the entered alert metric are highlighted in blue.
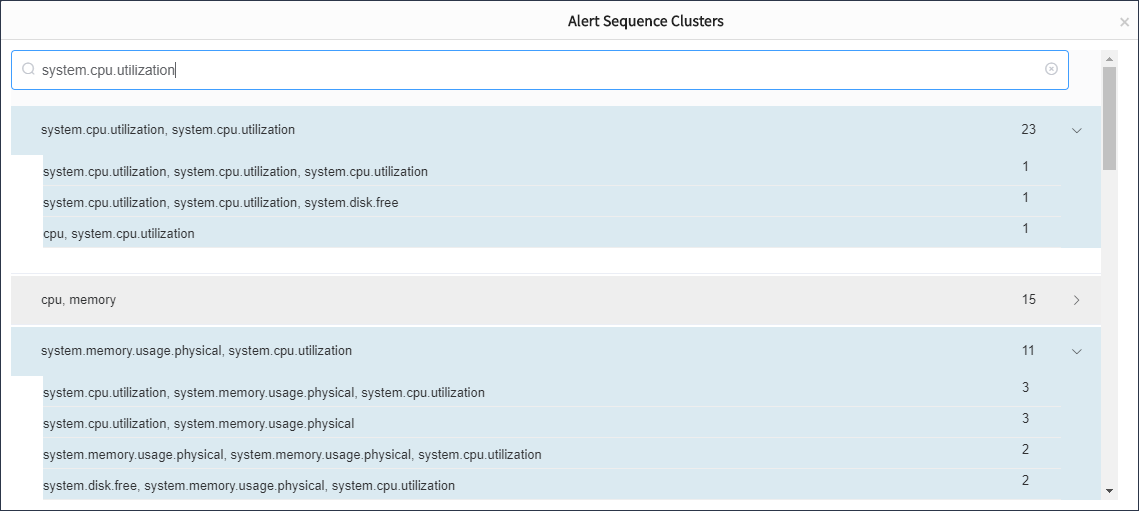
Alert Sequence Cluster Window
Viewing alert sequences related to inferences
To view alert sequences related to an inference:
- From All Clients, select Alerts and click the required inference name.
- Click the Correlated Alerts tab.
- From the list of correlated alerts, click Show detected alert sequence patterns.
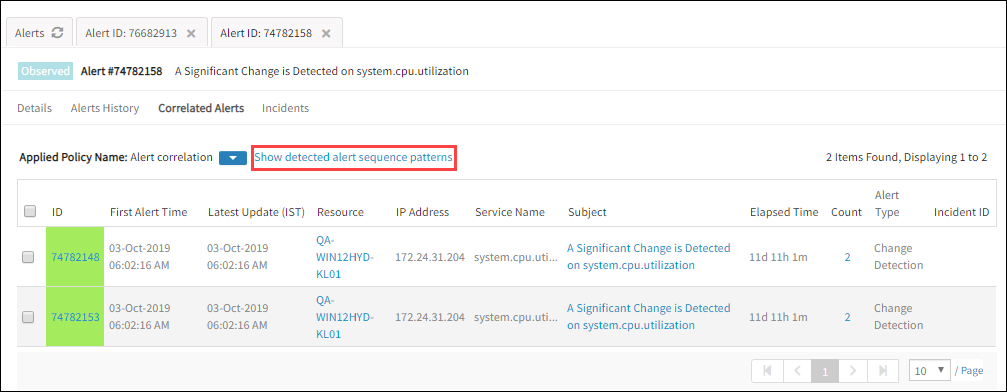
Detected Sequences of an Inference
Viewing ML status
Machine Learning (ML) status describes the various stages of machine learning implementation in a policy from analyzing a sequence to correlating alerts.
| ML Status | Description |
|---|---|
 | Insufficient data. The policy is temporarily disabled. Due to insufficient data, the machine learning model cannot detect the alert sequences, and correlation does not happen. As a result, the policy is temporarily disabled. The policy becomes active when the machine learning model finds sufficient data. |  | The Training ML model is queued. To use, please wait for completion. When a policy is created or a CSV file is uploaded to a policy, the training can be queued. If already a policy is in training, the new policy is queued. Once the training on the existing policy is complete, the status of the new policy moves to Training Initiated. | | The Training ML model is initiated. To use, please wait for completion. Training on the machine learning model is initiated. The status then moves to Training Started. |
 | The Training ML model is started. To use, please wait for completion. Training on the machine learning model is started. The progress of the training is visible on the progress bar. |
 | The Training ML model is in progress. To use, please wait for completion. Training on the ML model is in progress. The percentage of progress is shown in the progress bar. |
 | ML model training is complete and is ready to detect and correlate alerts. |
 | ML training encountered an error. Please contact OpsRamp Support. |
Viewing processed inferences
To view the number of inferences associated with a policy:
- Select a client from the All Clients list.
- Go to Setup > Alert Management > Alert Correlation and select the required policy.
- Click the number in the Processed Inferences column to view the details of the inferences.
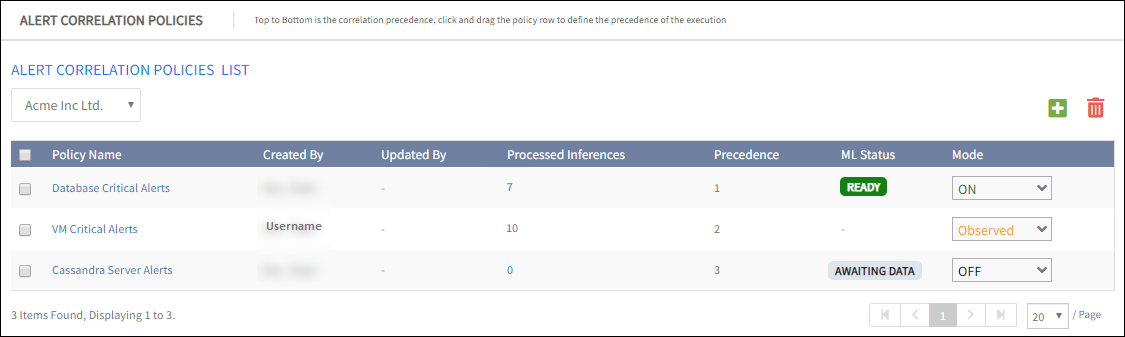
Number of Processed Inferences
The list of processed inferences appears on the Alerts Browser page.
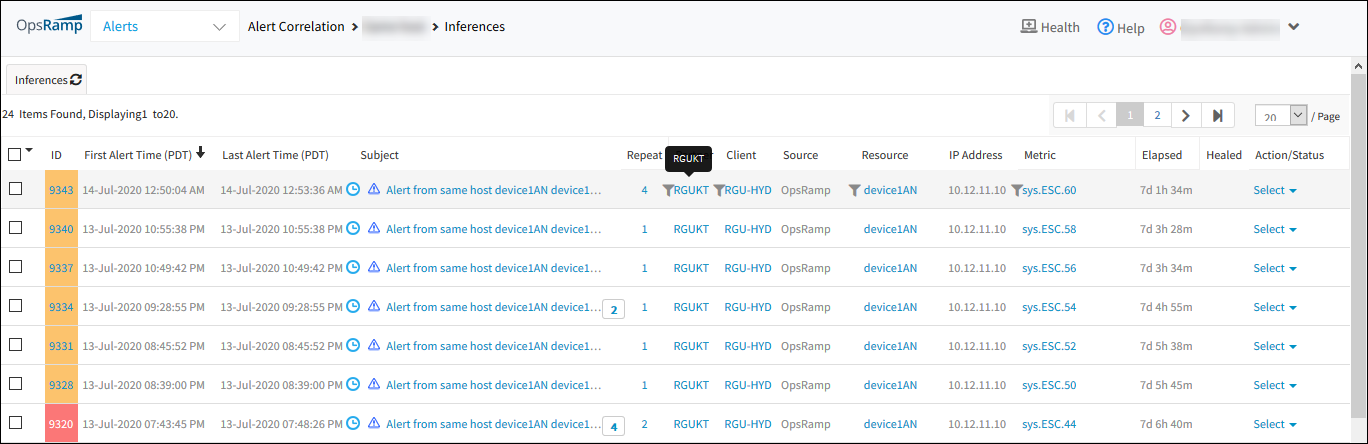
List of processed inferences
Alert correlation timing
The time gap between each adjacent alert is 5 minutes. Only those alerts taking place within a 5-minute interval are correlated.
If alerts are continuously generated for every 5 minutes, the overall time of a correlation can be much longer than 5 minutes. Take these example alert correlations:
- A1: 10:00
- A2: 10:04
- A3: 10:07
- A4: 10:14
A1, A2, A3 are correlated, as the gap between adjacent alerts is less than 5 minutes. A4 is excluded since the gap between A4 and A3 is more than 5 minutes. In this example, the overall correlation time is 7 minutes.