Alert details
Generated alerts display the following details including:
Note
An alert is ignored and not processed when received having the same state (for the resource/metric/component) within one minute.| Alert field | Description |
|---|---|
| ID | Refers to a unique number to identify an alert or an inference and is based on SeqID from the database.
The number helps search an alert or inference.
The ID field also contains the alert state that is represented in specific colors. |
| Subject | Refers to the summary content of the generated alert. Content includes metrics that led to the alert. Note: You can easily identify an OpsQ Bot recommended alert. The icon below is placed before such alert subject: |
| Description | Refers to a brief description of the entities that led to generation of the alert. Users can find the origin of the alert and identify crossed types of threshold of the applied metrics. Details may include metric, monitor description, device type, template name, group, site, service Level, and component. |
| Source | Refers to the platform or monitoring tools from where the alert is generated. For example, if an alert is triggered from Oracle, then the alert source is displayed as Oracle. |
| Metric | Refers to the service name for which the thresholds are taken an account and alert is generated. |
| First Alert Time | Refers to the time when monitoring happens for the first time on a resource. An alert is generated to notify the user that resource is being monitored. |
| Last Alert Time | Refers to the recent alert generated time. |
| Elapsed Time | Refers to the time elapsed since the first alert was generated. |
| Action/Status | Refers to the action and status of the alert. The result of an action is the change in status. For example, selecting the action Acknowledge changes the status of the alert to Acknowledged. |
| Last Updated Time | Refers to the time when alert was recently updated |
| Device Type | Refers to the device type associated with an alert. For example: server, desktop, laptop |
| Resource | Refers to the resource name on which the alert is generated. |
| Repeated Alerts | Refers to the count of the repeated alerts generated on the resource with the same details. |
| Resource | Refers to the resource name on which the alert is generated. |
| Partner | Refers to the partner’s name to which the resource belongs. |
| Incident ID | Refers to the associated incident unique ID with the alert.
Alerts are associated to incidents as follows:
|
| Entity Type | Refers to the category of the source which generates alert.
Entities are classified into the following types:
|
Alert types
There are two types of alerts:
- Forecast alerts
- Change detection alerts
Forecast alerts
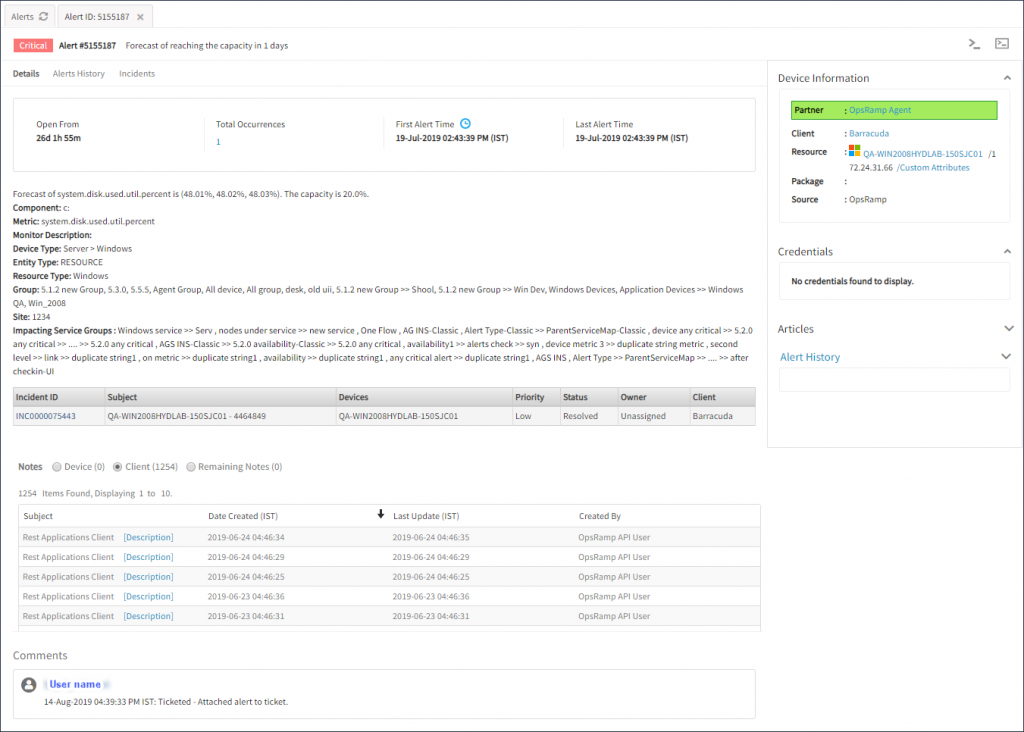
When a monitor triggers a forecast alert, the alert appears on the Alerts page.
The following example displays information about each forecast alert:

Forecast Alerts
The details and updates on a forecast alert are displayed in the comments section:

Forecast Alert Details
Change detection alerts
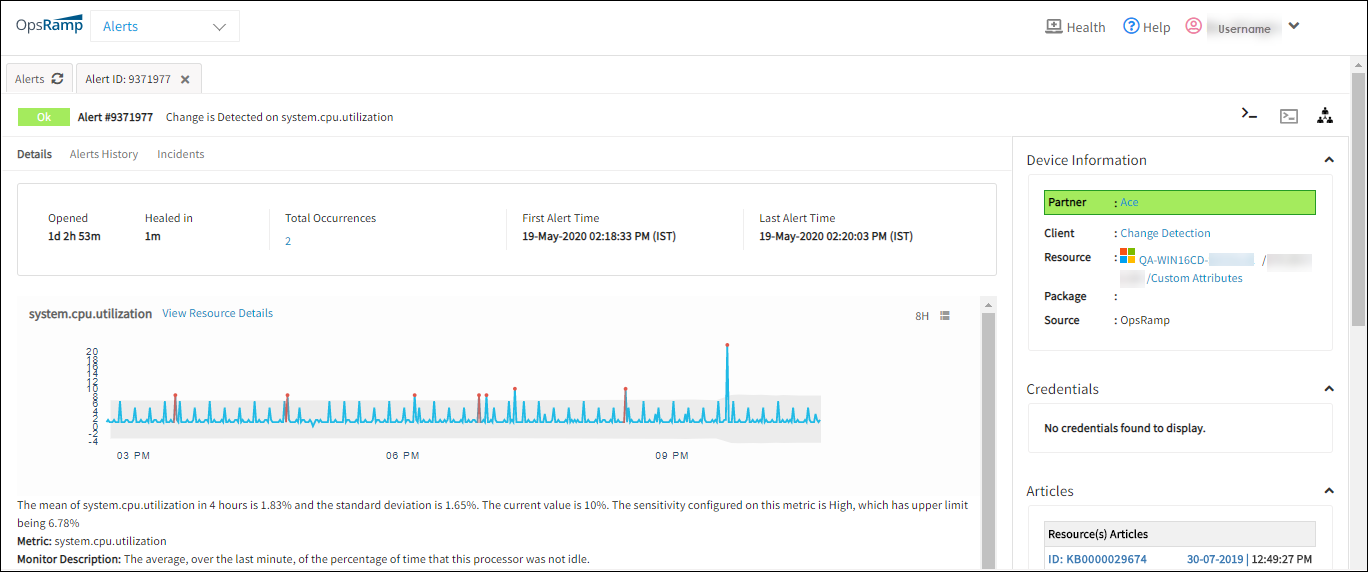
Change detection helps monitor sudden changes in metric behavior, especially on metrics with an indefinite threshold. This feature utilizes machine learning with a sliding window where change is calculated as soon as a data point becomes available.
Assign the change detection parameters to the required monitors/metrics to detect the changes and trigger alerts when siginification change is detected.
Key considerations
- If significant change is detected continuously, an alert is appended to an existing alert.
- If no change is detected after two hours, an alert is automatically resolved.
- A minimum of 4 hours of real-time data is required to process change detection.
- When a monitor triggers a change detection alert, the alert appears on the Alerts page.
Note
A sliding window of two hours is used to calculate the change score percentile and determine if an alert should be triggered.Examples of change detection alerts
A change detection alert is displayed on the Alerts page:
Sample Change Detection Alerts
A change detection is summarized on the Alert Details page:
Detailed Information on Change Detection Alerts
Alert actions
The following alert actions can be performed on an alert:
- Acknowledge
- Suppress
- Incident
- Close
- Run Process
The status of the alert changes according to the action performed:
- If an alert is acknowledged, the status changes from open to acknowledged.
- If an alert is suppressed, the status changes to suppressed.
- If an incident is created for an alert, the alert status changes to ticketed.
- Click Run Process to add proccess definitions.
Note
An action can be performed on the entire inference, but not on a single correlated alert.Alert actions are available on either the Alerts Browser or the Alert Details page.
Alert actions
This is an example of alert actions on the Alerts Browser page:

Alert Actions on Alerts Browser
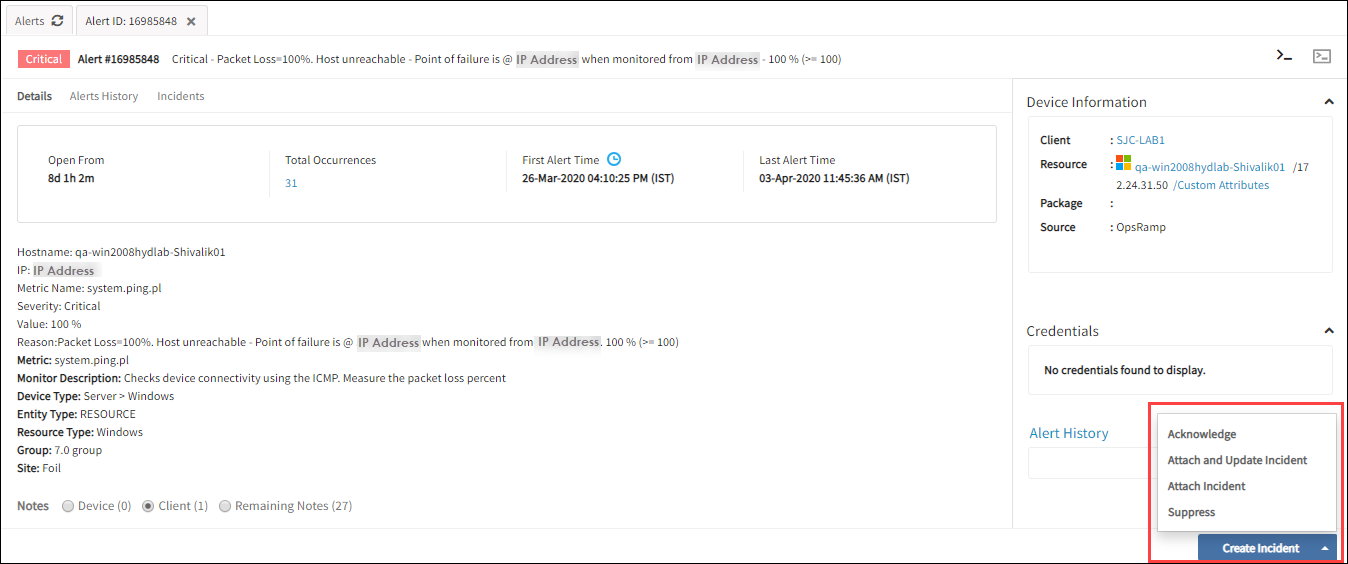
The following screenshot shows how alert actions are displayed on the Details page:
Alert Actions on Alerts Details
Alert action descriptions
| Action | Description |
|---|---|
| Acknowledge | When an alert is received you need to acknowledge it. Once the alert is acknowledged, a comment is displayed as Acknowledged along with the user name. Note: From the Incident unique ID drop-down menu, click Acknowledge. Once the incident is acknowledged, a tick mark appears below the Incident ID. |
| Create Incident | A ticket can be created for the generated alert, users can be assigned, and the priority can be set. Once an incident is created, the status of the alert changes to ticketed and the incident ID appears in the Action/Status column. |
| Attach And Update Incident | Map an alert to an existing ticket or update the ticket with the contents of the alert. This action is generally used to update the same ticket with related alerts. |
| Attach Incident | Map an alert to an existing ticket without updating the ticket with the alert contents. |
| Suppress | Suppress the current alert and all duplicate alerts.
Any new alert of the same type appears as a fresh alert and not as a duplicate alert.
The status of the alert changes to Suppressed. Snooze: The snooze setting suppresses alerts for a given time period. If a repeated alert triggers when the alert is in snoozed, the alerts repeat count increases and the snooze duration is reset based on the attributes of the repeated alert. |
| Unacknowledge | Undo the acknowledge action taken on an alert. For example, if a solution did not address a specific problem, unacknowledge the alert. The status of the alert changes to either open or ticketed as long as there is an incident ID associated with the alert. |
| Unsuppress | Undo a suppress action taken on an alert. The status of the alert changes to either open or ticketed as long as there is an incident ID associated with the alert. |
| Run Process | Add process definitions to an alert and run. The option does not appear for Suppressed and Heal alerts. |
| Close | Close an alert when an issue is solved and alert is resolved. The alert state changes to OK. |
Alert status
The alert status provides the information on the current action taken on the alert.
The following table describes the status of alerts:
| Status | Description |
|---|---|
| Open | A generated alert is referred to as an open alert. |
| Ticketed | If an incident is created for an alert, the alert status changes to ticketed. |
| Acknowledged | If an alert is acknowledged, the alert status changes to acknowledged. |
| Suppressed | If an alert status is suppressed, the alert status changes to Suppressed . |
| Correlated | If an alert is correlated to an inference, the alert status appears as correlated. |
| Closed | If an alert is closed, the alert status changes to closed. |
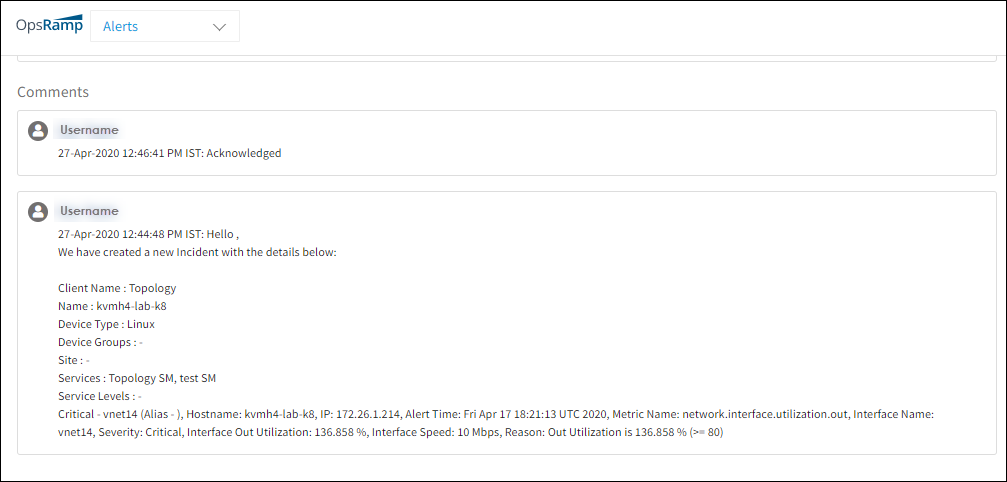
Changes in alert status can be tracked under the comments section on the Alert Details page.

Track Actions on an Alert
Alert filter attributes
| Attribute Name | Description |
|---|---|
| Client | View alerts of all clients or alerts related to the selected client. |
| Resource Origin | Alerts originate from either OpsRamp or other sources. View alerts from one source or all sources. |
| Sites | Refers to alerts specific to the site selected. |
| Resource Groups | Refers to groups of resources. |
| Resource Type | Alerts can be filtered on the type of a resource. If multiple resource types are selected from the list, only alerts relevant to the resources are listed. Note: A maximum of ten resource types can be selected from the list. |
| Name | Alerts can be filtered on the name of the resource. If a resource is selected from the list, alerts relevant to those resources are listed. |
| Source | Select a source (like one of the available integrations). |
| Entity Type | Select the entitle type: Resource, Service, Client, or Integration. |
| Alert Type | Filter according to one of the alert types: Agent, Appliance, Change Detection, Forecast, Maintenance, Monitoring, Obsolete, Scheduled Maintenance. |
| Metric | Select a metric from the list to view relevant alerts. |
| Priority | Alerts can be filtered on the priority where P0 is the low priority and P5 is the highest priority. If a priority is selected from the list, only those alerts relevant to that priority type are listed. |
| Current Status | Supported values for current status are: All Status, Critical, Observed, Warning, Ok, and Info. To view list of alerts in Observed state, select the observed value. |
| Actions | View alerts related to an action available in the list: Acknowledged, Closed, Correlated, Open, Suppressed, or Ticketed. |
| Duration | Filters alerts that are triggered within a specific duration. If duration is set to the last 7 days and the alert timestamp is set to created time, alerts created within the last seven days appear. |
| From Date | Refers to the starting date of duration. |
| To Date | Refers to the end date of duration. |
| Alert Timestamps | Refers to the alerts related to a specific timestamp. |
| Event Type | Refers to the multiple available event types. Select one of the three options: Alerts, RCA, or Inference Type. |
| Special Attribute | The special availability attribute is used to filter availability alerts. Alerts are triggered when resources become unavailable. |
Searching by unique ID
Search for an alert, incident, or event using the unique ID. After entering the unique ID, the related alerts are displayed as a search result.
For example:
- If you enter the event ID, the browser returns the alert created or updated from the event.
- If you enter an incident ID, the browser returns the alert attached to the incident.
Notes
- You can search only with a single ID at a time.
- Event ID is applicable only for the alerts created using the API.
- The entity created through the create alert(s) APIs is a raw event.
- After being ingested and going through alert processing, an event is either added to an existing alert or created as a new alert.
- Event ID is denoted in the string format and alert ID is denoted in the integer format.
Example event ID:fa3245ca-6740-4f7a-bf06-02414c51595e, Example alert ID: 92654733
To search for an entity:
- Click All Clients, select a client.
- Go to Alerts.
- Provide the ID in the Alert ID search field to fetch
Similarly, for incidents and events, from the Alert ID drop-down menu, select either Incident ID or Event ID and provide the ID. - Click the search icon.
Matching alert details are displayed.

